
Abstract
The bicycle is one of the most affordable and flexible means of transportation in a developing country such as India. Despite being an important mode of transportation, a sharp decline in bicycle mode share has been observed in small and medium-sized Indian cities where trip lengths are favorable for bicycling. This decline could be attributed to inadequate bicycle infrastructure which should be improved not only to preserve the existing bicycle base, but also to attract new bicycle users. For such an improvement, it is essential to identify and evaluate key attributes that users value to select a bicycle route. In this study users’ preferences for bicycle infrastructure were collected with the help of stated preference survey in two Indian cities, Kharagpur and Asansol, and were used to estimate the choice preferences of both commuter and non-commuter bicyclists. In total, five different attributes were found to influence bicycle route choice, namely, road width, level of risk, route visibility, journey time and operating cost. With the collected data, random parameter logit (RPL) models were developed with and without considering heterogeneity around the means of the attributes. Based on the results of these RPL model coefficients and willingness to pay (WTP) values, the five attributes were estimated to quantify the perceived benefits associated with each attribute. Results indicate that the level of risk (a measure of perceived risk associated with motorized vehicles) is considered the most significant deterrent influencing bicyclist’s route choice decisions in both cities referred to above, followed by route visibility, road width and bicycle journey time. For almost all attributes, the WTP’s for non-commuters are found significantly higher than those for commuters.
References
Aultman-Hall, L.: Commuter bicycle route choice: analysis of major determinants and safety implications. Ph.D. thesis. McMaster University (1996)
Aultman-Hall, L., Hall, F., Baetz, B.: Analysis of bicycle commuter routes using geographic information systems: implications for bicycle planning. Transp. Res. Rec. J. Transp. Res. Board 1578, 102–110 (1997)
Barnes, G., Thompson, K., Krizek, K.: A longitudinal analysis of the effect of bicycle facilities on commute mode share. In: 85th Annual Meeting of the Transportation Research Board. Transportation Research Board, Washington, DC (2006)
Basu, D., Maitra, B.: Stated preference approach for valuation of travel time displayed as traffic information on a VMS board. J. Urban Plan. Dev. 136(3), 214–224 (2010)
Ben-Akiva, M., Lerman, S.R.: Discrete Choice Analysis: Theory and application to predict travel demand, vol. 9. The MIT Press, Cambridge (1985)
Caulfield, B., Brick, E., McCarthy, O.T.: Determining bicycle infrastructure preferences—a case study of Dublin. Transp. Res. Part D Transp. Environ. 17(5), 413–417 (2012)
Dickinson, J.E., Kingham, S., Copsey, S., Hougie, D.J.P.: Employer travel plans, cycling, and gender: will travel plan measures improve the outlook for cycling to work in the UK? Transp. Res. Part D Transp. Environ. 8(1), 53–67 (2003)
Dill, J., Carr, T.: Bicycle commuting and facilities in major US cities: if you build them, commuters will use them. Transp. Res. Rec. J. Transp. Res. Board 1828, 116–123 (2003)
Dill, J., Voros, K.: Factors affecting bicycling demand—initial survey findings from the Portland, Oregon, Region. Transp. Res. Rec. J. Transp. Res. Board 2031, 9–17 (2007)
Greene, W.: NLOGIT Student Reference Guide. Econometric Software, Inc., Plainview, NY, USA (2007)
Hensher, D.A., Rose, J.M., Greene, W.H.: Applied Choice Analysis: A Primer. Cambridge University Press, New York, USA (2005)
Hood, J., Sall, E., Charlton, B.: A GPS-based bicycle route choice model for San Francisco, California. Transp. Lett. 3(1), 63–75 (2011)
Hopkinson, P., Wardman, M.: Evaluating the demand for new cycle facilities. Transp. Policy 3(4), 241–249 (1996)
Hunt, J.D., Abraham, J.E.: Influences on bicycle use. Transportation 34(4), 453–470 (2007)
Jain, H., Tiwari, G.: Discrete route choice model for bicyclists in Pune, India. Urban Transp. J. 9, 1–12 (2010)
Jain, H., Tiwari, G.: Bicycle traffic demand model: case of Pune, India. UNEP. Low Carbon Mobility Plan for Indian cities Workshop. Pune (2012)
Koppelman, F., Bhat, C.: A Self Instructing Course in Mode Choice Modelling: Multinomial and Nested Logit Models. U.S. Department of Transportation Federal Transit Administration (2006)
Krizek, K.J.: Two approaches to valuing some of bicycle facilities’ presumed benefits. J. Am. Plan. Assoc. 3, 309–319 (2006)
Maitra, B., Dandapat, S., Chintakayala, P.: Differences between the perceptions of captive and choice riders toward bus service attributes and the need for segmentation of bus services in urban India. J. Urban Plan. Dev. 141(2), 1–8 (2014)
Majumdar, B.B., Mitra, S., Pareekh, P.: Methodological framework to obtain key factors influencing choice of bicycle as a mode. Transp. Res. Rec. J. Transp. Res. Board 15–5891(2512), 110–121 (2015)
Nelson, A., Allen, D.: If you build them, commuters will use them. Transportation Research Record 1578. Paper no. 970132. pp. 79–83 (1997)
Noland, R.B., Kunreuther, H.: Short-run and long-run policies for increasing bicycle transportation for daily commuter trips. Transp. Policy 2(1), 67–79 (1995)
Phanikumar, C.V., Maitra, B.: Valuing urban bus attributes: an experience in Kolkata. J. Public Transp. 9(2), 69–87 (2006)
Poorfakhreai, A., Rowangould, G.M.: Estimating welfare change associated with improvements in urban bicycling facilities. J. Transp. Eng. 04015025, 1–7 (2015)
Rossetti, T., Saud, V., Hurtubia, R.: I want to ride it where I like: measuring design preferences in cycling infrastructure. Transportation. https://doi.org/10.1007/s11116-017-9830-y (2017)
Rudd, P.A.: Approximation and Simulation of the Multinomial Probit Model: An Analysis of Covariance Matrix Estimation. Department of Economics, University of California, Berkeley, USA (1996)
Sanko, N.: Guidelines for Stated Preference Experiment Design. Dissertation Master of Business Administration. School of International Management, Ecole Nationale des Ponts et Chaussées (2001)
Sener, I., Eluru, N., Bhat, C.: An analysis of bicycle route choice preferences in Texas. Transportation 36(5), 511–539 (2009)
Smith, R.L.: Determining the Sample Size. Department of Statistics and Operations Research, University of North Carolina, USA (2006)
Stinson, M.A., Bhat, C.: An analysis of commuter bicyclist route choice using a stated preference survey. In: Transportation Research Record: Journal of the Transportation Research Board. No. 1828, Transportation Research Board of National Academics, Washington, D.C. pp. 107–115 (2003)
TERI: Pedalling Towards A GREENER INDIA: A report on promoting cycling in the country. The Energy and Resources Institute, New Delhi (2014)
Train, K.E.: Discrete Choice Methods with Simulation. Cambridge University Press, New York, NY, USA (2009)
Wilbur Smith Associates: Study on Traffic and Transportation: Policies and Strategies in Urban Areas in India. Ministry of Urban Development, Columbia (2008)
Acknowledgements
This work was conducted as part of a research project funded by the Housing and Urban Development Corporation Ltd., HSMI, Ministry of Housing &Urban Poverty Alleviation, Government of India. The authors also acknowledge the opportunity to present the research work that forms the basis of this article at the TRB 96th Annual Meeting, which was held during January 8–12, 2017 in Washington, D.C. USA.
Author information
Authors and Affiliations
Corresponding author
Ethics declarations
Conflict of interest
On behalf of all authors, the corresponding author states that there is no conflict of interest.
Appendices
Appendix: Sample travel behavior questionnaire
IIT Kharagpur is conducting a research with assistance from Housing and Urban Development Corporation (HUDCO), Government of India for improving bicycle infrastructure in typical Indian context. In this regard, we are collecting travel behavior information of bicyclists. We will be thankful if you spend a little part of your precious time in filling up this questionnaire. Please answer the questionnaire keeping in mind your most recent trip in the city. This questionnaire has following three parts.
-
Part A: Attribute Descriptions
-
Part B: Socio-Economic and Trip-related information of respondents
-
Part C: Respondent’s stated choice against hypothetical options
Your responses will be kept confidential and only be used for academic purpose or research work.
Part A: Description of attributes
-
1.
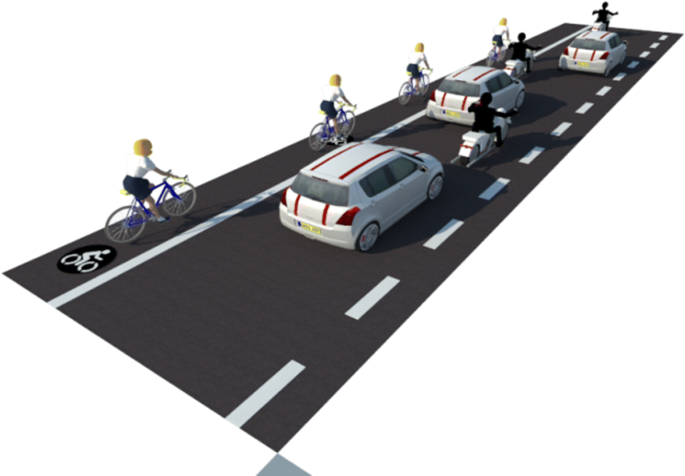
Road width: This attribute is an indicator of presence or absence of dedicated bicycle facility and available width for bicycling for a specific facility
-
Level 2: demarcated 1.5–2 m bicycle lane next to motorized traffic lane
-
Level 1 (Base level): A shared facility with an available width of 3.5 m, without any demarcation for bicyclists
-
-
2.
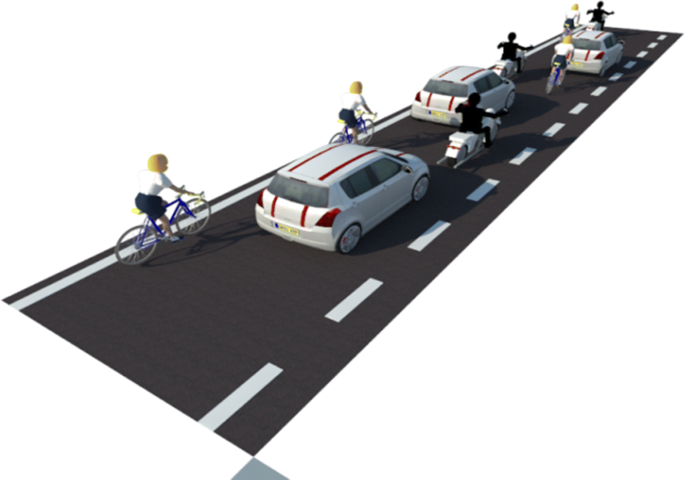
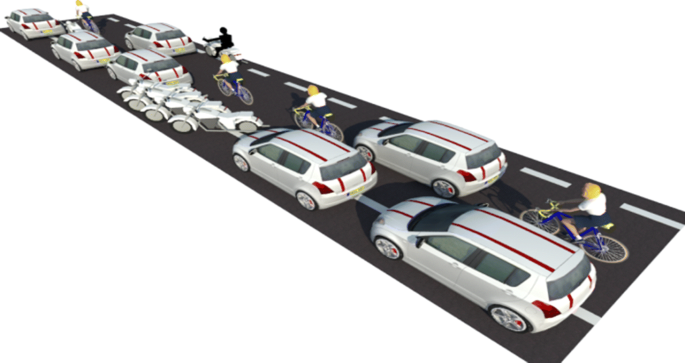
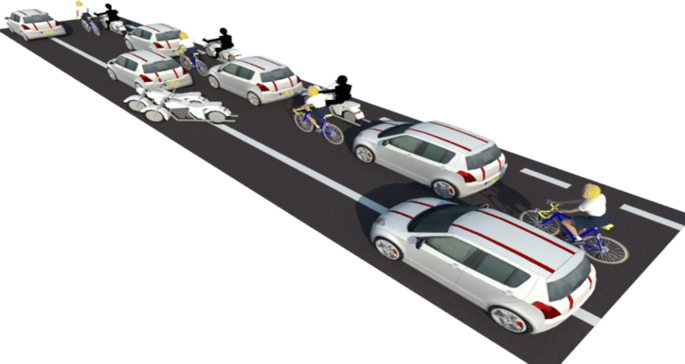
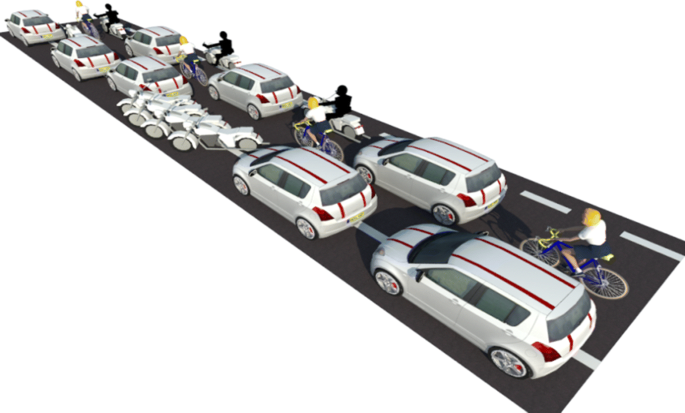
Level of Risk: This attribute defines the level of risk or safety concern associated with bicycling, especially in heterogeneous conditions. This is defined by two sub-attributes, namely presence of motorized traffic on route and on-street parking. The four levels of this attribute is presented as follows:
Level of Risk: least: Low level of motorized vehicle on road. Low-density on-street parking
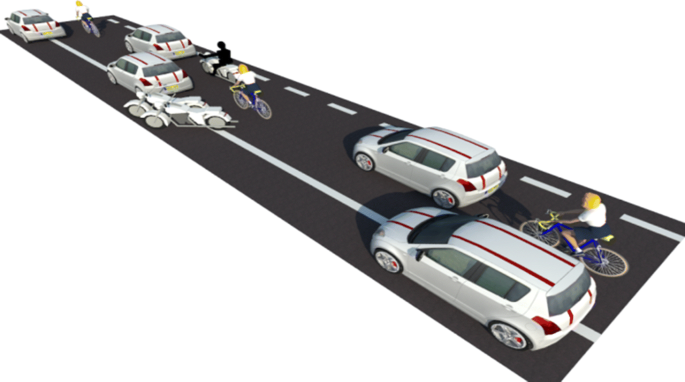
Level of Risk: lower: Low level of motorized vehicle on road. High-density on-street parking
Level of Risk: Moderate: High level of motorized vehicle on road. Low-density on-street parking
Level of Risk: Highest: High level of motorized vehicle on road. High-density on-street parking
-
3.
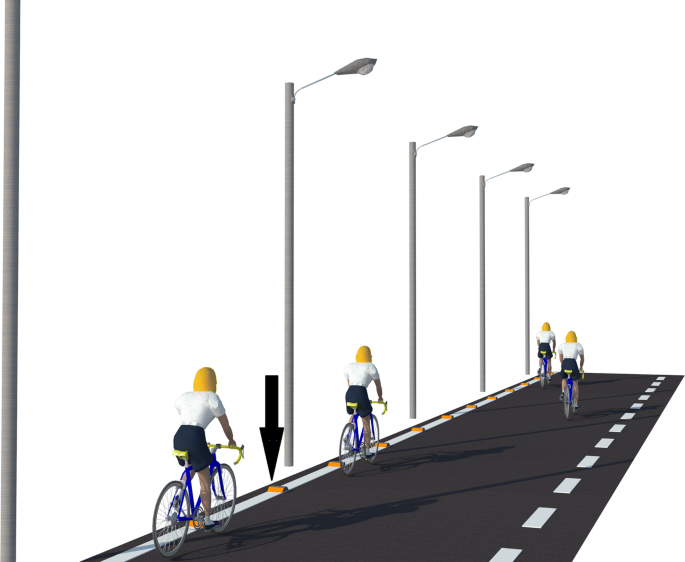
Route Visibility: This variable defines the route visibility condition of a particular bicycle route. Four levels are defined with presence or absence of street light and illuminated corridor (cat’s eye along the edge line). Three levels of route visibility are defined with illustrations as follows:
Route visibility Level 3: Streetlight is there, also illuminated corridor (cat’s eye along the edge line) present. (The cat’s eye is shown by the arrow)
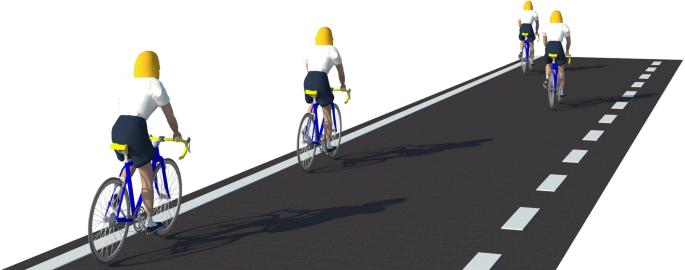
Route visibility Level 2: Streetlight is there, but no illuminated corridor (cat’s eye along the edge line absent)
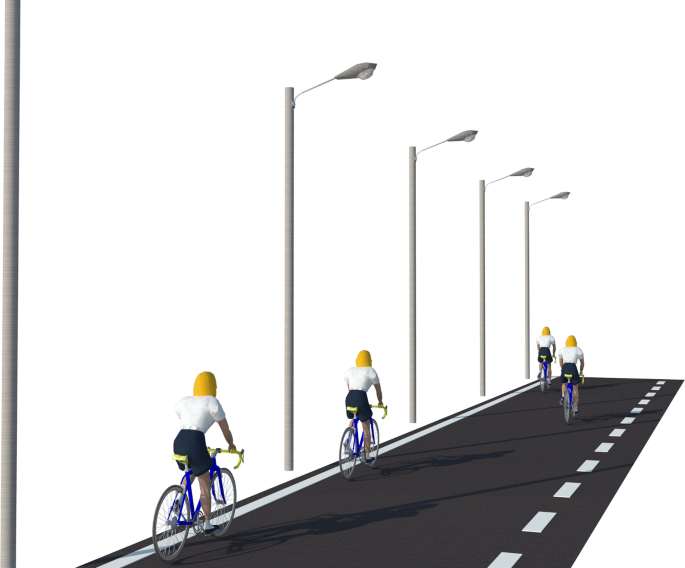
Route visibility Level 1: Streetlight is there, but no illuminated corridor (cat’s eye along the edge line absent)
-
4.
Bicycle Journey Time: It is the average travel time taken by bicycle to traverse 1 km. The average travel time for base condition is estimated from the travel behaviour data collected from Kharagpur and was found to be 6 min per km based on average journey speed of 10 Kmph. Other two levels are calculated according to journey speed of 12 and 15 Kmph.
Level 3: 4 Minute per Km
Level 2: 5 Minute per Km
Level 1 (Base level): 4 Minute per Km
-
5.
Bicycle operating cost per Km: The estimated bicycle operating cost of 35 paisa per km is considered as the operating cost for the existing or base scenario based on bicycle selling price, service life of bicycle, average daily usage and maintenance cost of bicycle in a typical small-sized Indian city.
-
The additional cost of infrastructure improvement may be collected from the bicyclists in the form of tax, which will be the additional out of pocket cost to the bicyclists. Hence, and the subsequent cost of infrastructure improvement is assumed to increase the selling cost of a bicycle by 20% and 40% respectively.
-
Thus the two other levels of operating cost is considered to be 40 and 45 paisa per km
-
The three levels of bicycle operating cost/km are as follows:
Level 3: 45 Paisa per Km
Level 2: 40 Paisa per Km
Level 1 (Base level): 35 Paisa per Km
-


Part B1: Socio-economic information of respondents
-
1.
Sex (a) Male (b) Female
-
2.
Age (a) up to 35 years (b) more than 35 years
-
3.
Monthly family income (in INR) (a) up to 10,000 (b) more than 10,000
-
4.
Two-wheeler ownership: (a) yes (b) no
Part B2: Trip-related information of respondents about their most recent bicycle trip
-
1.
Trip Purpose: (a) Work trip (Revenue generating). (b) Non-work (Non-revenue generating) trip
-
2.
What is your Travel Origin:
-
3.
What is your Travel Destination?
-
4.
Trip length:
Part C: Stated preference survey (Please tick the appropriate option for each choice set)
Attribute | Option-A | Option-B |
|---|---|---|
Choice Set 1 | ||
Road width | Marked bicycle lane with an available width for bicycling between 1.5 and 2 m | Available width for bicycling 3.5 m, which is a shared facility |
Bicycle journey time | 6 min/km | 5 min/km |
Bicycle operating cost | 40 paisa/km | 35 paisa/km |
Level of risk | Level of risk: Moderate | Level of risk: lower |
Route visibility | Streetlight is there, also illuminated corridor (cat’s eye along the edge line) present | Streetlight is there, but no illuminated corridor (cat’s eye along the edge line) present. |
Choice | Option-A | Option-B |
Choice Set 2 | ||
Road width | Marked bicycle lane with an available width for bicycling between 1.5–2 m | Available width for bicycling 3.5 m, which is a shared facility |
Bicycle journey time | 4 min/km | 6 min/km |
Bicycle operating cost | 40 paisa/km | 45 paisa/km |
Level of risk | Level of risk: least | Level of risk: highest |
Route visibility | No Streetlight and no illuminated corridor (cat’s eye along the edge line) present. | Streetlight is there, but no illuminated corridor (cat’s eye along the edge line) present. |
Choice | Option-A | Option-B |
Choice Set 3 | ||
Road width | 1.5–2 m Marked bicycle lane with an available width for bicycling between 1.5 and 2 m | Available width for bicycling 3.5 m, which is a shared facility |
Bicycle journey time | 4 min/km | 5 min/km |
Bicycle operating cost | 45 paisa/km | 35 paisa/km |
Level of risk | Level of risk: lower | Level of risk: least |
Route visibility | Streetlight is there, but no illuminated corridor (cat’s eye along the edge line) present. | No Streetlight and no illuminated corridor (cat’s eye along the edge line) present. |
Choice | Option-A | Option-B |
Choice Set 4 | ||
Road width | Marked bicycle lane with an available width for bicycling between 1.5 and 2 m | Available width for bicycling 3.5 m, which is a shared facility |
Bicycle journey time | 5 min/km | 4 min/km |
Bicycle operating cost | 45 paisa/km | 40 paisa/km |
Level of risk | Level of risk: Moderate | Level of risk: lower |
Route visibility | Streetlight is there, but no illuminated corridor (cat’s eye along the edge line) present | No Streetlight and no illuminated corridor (cat’s eye along the edge line) present |
Choice | Option-A | Option-B |
Thank for your cooperation??
Rights and permissions
About this article

Cite this article
Majumdar, B.B., Mitra, S. A study on route choice preferences for commuter and non-commuter bicyclists: a case study of Kharagpur and Asansol, India. Transportation 46, 1839–1865 (2019). https://doi.org/10.1007/s11116-018-9898-z
Published:
Issue Date:
DOI: https://doi.org/10.1007/s11116-018-9898-z