
Abstract
Medical imaging plays a significant role in different clinical applications such as medical procedures used for early detection, monitoring, diagnosis, and treatment evaluation of various medical conditions. Basicsof the principles and implementations of artificial neural networks and deep learning are essential for understanding medical image analysis in computer vision. Deep Learning Approach (DLA) in medical image analysis emerges as a fast-growing research field. DLA has been widely used in medical imaging to detect the presence or absence of the disease. This paper presents the development of artificial neural networks, comprehensive analysis of DLA, which delivers promising medical imaging applications. Most of the DLA implementations concentrate on the X-ray images, computerized tomography, mammography images, and digital histopathology images. It provides a systematic review of the articles for classification, detection, and segmentation of medical images based on DLA. This review guides the researchers to think of appropriate changes in medical image analysis based on DLA.
1 Introduction
In the health care system, there has been a dramatic increase in demand for medical image services, e.g. Radiography, endoscopy, Computed Tomography (CT), Mammography Images (MG), Ultrasound images, Magnetic Resonance Imaging (MRI), Magnetic Resonance Angiography (MRA), Nuclear medicine imaging, Positron Emission Tomography (PET) and pathological tests. Besides, medical images can often be challenging to analyze and time-consuming process due to the shortage of radiologists.
Artificial Intelligence (AI) can address these problems. Machine Learning (ML) is an application of AI that can be able to function without being specifically programmed, that learn from data and make predictions or decisions based on past data. ML uses three learning approaches, namely, supervised learning, unsupervised learning, and semi-supervised learning. The ML techniques include the extraction of features and the selection of suitable features for a specific problem requires a domain expert. Deep learning (DL) techniques solve the problem of feature selection. DL is one part of ML, and DL can automatically extract essential features from raw input data [88]. The concept of DL algorithms was introduced from cognitive and information theories. In general, DL has two properties: (1) multiple processing layers that can learn distinct features of data through multiple levels of abstraction, and (2) unsupervised or supervised learning of feature presentations on each layer. A large number of recent review papers have highlighted the capabilities of advanced DLA in the medical field MRI [8], Radiology [96], Cardiology [11], and Neurology [155].
Different forms of DLA were borrowed from the field of computer vision and applied to specific medical image analysis. Recurrent Neural Networks (RNNs) and convolutional neural networks are examples of supervised DL algorithms. In medical image analysis, unsupervised learning algorithms have also been studied; These include Deep Belief Networks (DBNs), Restricted Boltzmann Machines (RBMs), Autoencoders, and Generative Adversarial Networks (GANs) [84]. DLA is generally applicable for detecting an abnormality and classify a specific type of disease. When DLA is applied to medical images, Convolutional Neural Networks (CNN) are ideally suited for classification, segmentation, object detection, registration, and other tasks [29, 44]. CNN is an artificial visual neural network structure used for medical image pattern recognition based on convolution operation. Deep learning (DL) applications in medical images are visualized in Fig. 1.

2 Neural networks
2.1 History of neural networks
The study of artificial neural networks and deep learning derives from the ability to create a computer system that simulates the human brain [33]. A neurophysiologist, Warren McCulloch, and a mathematician Walter Pitts [97] developed a primitive neural network based on what has been known as a biological structure in the early 1940s. In 1949, a book titled “Organization of Behavior” [100] was the first to describe the process of upgrading synaptic weights which is now referred to as the Hebbian Learning Rule. In 1958, Frank Rosenblatt’s [127] landmark paper defined the structure of the neural network called the perceptron for the binary classification task.
In 1962, Windrow [172] introduced a device called the Adaptive Linear Neuron (ADALINE) by implementing their designs in hardware. The limitations of perceptions were emphasized by Minski and Papert (1969) [98]. The concept of the backward propagation of errors for purposes of training is discussed in Werbose1974 [171]. In 1979, Fukushima [38] designed artificial neural networks called Neocognitron, with multiple pooling and convolution layers. One of the most important breakthroughs in deep learning occurred in 2006, when Hinton et al. [9] implemented the Deep Belief Network, with several layers of Restricted Boltzmann Machines, greedily teaching one layer at a time in an unsupervised fashion. In 1989, Yann LeCun [71] combined CNN with backpropagation to effectively perform the automated recognition of handwritten digits. Figure 2 shows important advancements in the history of neural networks that led to a deep learning era.

2.2 Artificial neural networks
Artificial Neural Networks (ANN) form the basis for most of the DLA. ANN is a computational model structure that has some performance characteristics similar to biological neural networks. ANN comprises simple processing units called neurons or nodes that are interconnected by weighted links. A biological neuron can be described mathematically in Eq. (1). Figure 3 shows the simplest artificial neural model known as the perceptron.

Perceptron [77]
Let  be the vector of inputs (features),
  be the weight vector,
  be the bias, f be the non-linear activation (sigmoid) function and y be the scalar, the output of a node. For the construction of neural networks required parameters are i) The pattern of connections between the neurons (architecture) ii) The method of determining the weights on the connection (Training or learning) and iii) Activation function. Depending on the pattern of connection between nodes in the neural networks, they are mainly classified into two types, viz., a Feed-Forward Neural Network (FFNN) and Recurrent Neural Networks (RNN) [42]. For FFRN the requirement is that network has to be a directed acyclic graph. In RNN the connection between nodes forms a directed cycle. An FFNN consists of one or more layers in which each layer comprises one or more nodes. The network has one input layer and the last layer is called the output layer. The layers between the input and the output layer are considered as a hidden layer. FFNN is used for supervised [140] learning tasks like classification and regression.
2.3 Training a neural network with Backpropagation (BP)
In the neural networks, the learning process is modeled as an iterative process of optimization of the weights to minimize a loss function. Based on network performance, the weights are modified on a set of examples belonging to the training set. The necessary steps of the training procedure contain forward and backward phases. For Neural Network training, any of the activation functions in forwarding propagation is selected and BP training is used for changing weights. The BP algorithm helps multilayer FFNN to learn input-output mappings from training samples [16]. Forward propagation and backpropagation are explained with the one hidden layer deep neural networks in the following algorithm.
The backpropagation algorithm is as follows for one hidden layer neural network
-
1.
Initialize all weights to small random values.
-
2.
While the stopping condition is false, do steps 3 through10.
-
3.
For each training pair ((x1, y1)…(xn, yn) do steps 4 through 9.
Feed-forward propagation:
-
4.
Each input unit (Xi, i = 1, 2, …n) receives the input signal xi and send this signal to all hidden units in the above layer.
-
5.
Each hidden unit (Zj, j = 1. ., p) compute output using the below equation, and it transmits to the output unit (i.e.) \( {z}_{j\_ in}={b}_j+{\sum}_{i=1}^n{w}_{ij}{x}_i \) applies to an activation function Zj = f(Zj _ in).
-
6.
Compute the out signal for each output unit (Yk,k = 1, …., m).
\( {y}_{k\_ in}={b}_k+{\sum}_{j=1}^p{z}_j{w}_{jk} \) and calculate activation yk = f(yk _ in)
Backpropagation
-
7.
For input training pattern (x1, x2…., xn) corresponding output pattern (y1, y2, …, ym), let (t1, t2, …. . tm) be target pattern. For each output, the neuron computes network error δk
At output-layer neurons δk = (tk − yk)f′(yk _ in)
-
8.
For each hidden neuron, calculate its error information term δj while doing so, use δk of the output neurons as obtained in the previous step
At Hidden layer neurons \( {\delta}_j={f}^{\prime}\left({z}_{j\_ in}\right){\sum}_k^m{\delta}_k{w}_{jk} \)
-
9.
Update weights and biases using the following formulas where ηis learning rate
Each output layer (Yk, k = 1, 2, …. m) updates its weights (J = 0, 1, …P) and bias
wjk(new) = wjk(old) + ηδkzj;bk(new) = bk(old) + ηδk
Each hidden layer (ZJ, J = 1, 2, …p) updates its weights (i = 0, 1, …n) biases:
wij(new) = wij(old) + ηδjxi; bj(old) = bj(old) + ηδj
-
10.
Test stopping condition
2.4 Activation function
The activation function is the mechanism by which artificial neurons process and transfers information [42]. There are various types of activation functions which can be used in neural networks based on the characteristic of the application. The activation functions are non-linear and continuously differentiable. Differentiability property is important mainly when training a neural network using the gradient descent method. Some widely used activation functions are listed in Table 1.
3 Deep learning
Deep learning is a subset of the machine learning field which deals with the development of deep neural networks inspired by biological neural networks in the human brain.
3.1 Autoencoder
Autoencoder (AE) [128] is one of the deep learning models which exemplifies the principle of unsupervised representation learning as depicted in Fig. 4a. AE is useful when the input data have more number of unlabelled data compared to labeled data. AE encodes the input x into a lower-dimensional space z. The encoded representation is again decoded to an approximated representation x′ of the input x through one hidden layer z.

Basic AE consists of three main steps:
Encode: Convert input vector \( x\ \epsilon\ {\mathbf{\mathfrak{R}}}^{\boldsymbol{m}} \) into \( h\ \epsilon\ {\mathbf{\mathfrak{R}}}^{\mathrm{n}} \), the hidden layer by h = f(wx + b)where \( w\ \epsilon\ {\mathbf{\mathfrak{R}}}^{\boldsymbol{m}\ast \boldsymbol{n}} \) and\( b\ \epsilon\ {\mathbf{\mathfrak{R}}}^{\boldsymbol{n}} \).m and n are dimensions of the input vector and converted hidden state. The dimension of the hidden layer h is to be smaller than x.f is an activate function.
Decode: Based on the above h, reconstruct input vector z by equation z = f ′(w′h + b′) where \( {w}^{\prime}\epsilon\ {\mathbf{\mathfrak{R}}}^{\boldsymbol{n}\ast \boldsymbol{m}} \)and \( {b}^{\prime}\boldsymbol{\epsilon} {\mathbf{\mathfrak{R}}}^{\boldsymbol{m}}. \)The f′is the same as the above activation function.
Calculate square error:Lrecons(x, z) = ∥ x − z∥2, which is the reconstruction error cost function. Reconstruct error minimization is achieved by optimizing the cost function (2)
Another unsupervised algorithm representation is known as Stacked Autoencoder (SAE). The SAE comprises stacks of autoencoder layers mounted on top of each other where the output of each layer was wired to the inputs of the next layer. A Denoising Autoencoder (DAE) was introduced by Vincent et al. [159]. The DAE is trained to reconstruct the input from random noise added input data. Variational autoencoder (VAE) [66] is modifying the encoder where the latent vector space is used to represent the images that follow a Gaussian distribution unit. There are two losses in this model; one is a mean squared error and the Kull back Leibler divergence loss that determines how close the latent variable matches the Gaussian distribution unit. Sparse autoencoder [106] and variational autoencoders have applications in unsupervised, semi-supervised learning, and segmentation.
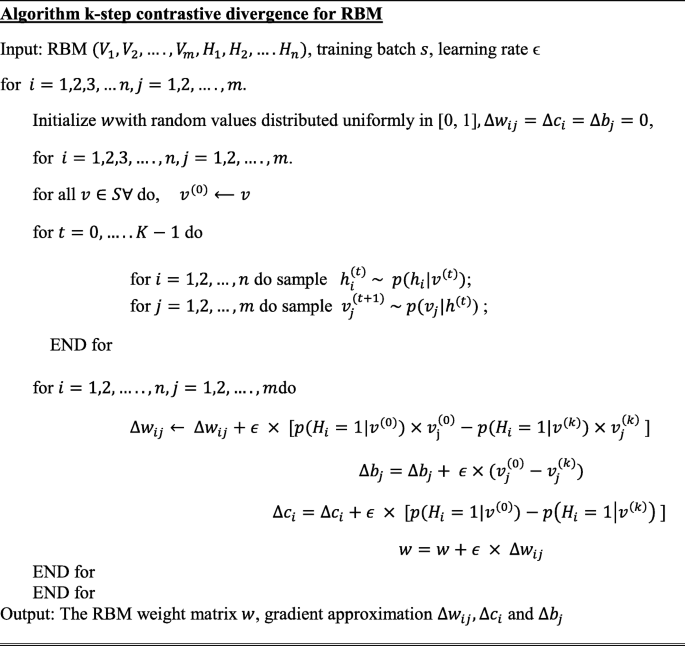
3.2 Restricted Boltzmann machine
A Restricted Boltzmann machine [RBM] is a Markov Random Field (MRF) associated with the two-layer undirected probabilistic generative model, as shown in Fig. 4b. RBM contains visible units (input) v and hidden (output) units h. A significant feature of this model is that there is no direct contact between the two visible units or either of the two hidden units. In binary RBMs, the random variables (v, h) takes (v, h) ∈ {0, 1}m + n. Like the general Boltzmann machine [50], the RBM is an energy-based model. The energy of the state {v, h} is defined as (3)
where vj, hi are the binary states of visible unit j ∈ {1, 2, …m} and hidden unit i ∈ {1, 2, .. n}, bj, ci are their biases of visible and hidden units, wij is the symmetric interaction term between the units vj and hi them. A joint probability of (v, h) is given by the Gibbs distribution in Eq. (4)
Z is a “partition function” that can be given by summing over all possible pairs of visual v and hidden h (5).
A significant feature of the RBM model is that there is no direct contact between the two visible units or either of the two hidden units. In term of probability, conditional distributions p(h| v) and p(v| h) is computed as (6) \( p\left(h|v\right)={\prod}_{i=1}^np\left({h}_i|v\right) \)
For binary RBM condition distribution of visible and hidden are given by (7) and (8)
where σ(·) is a sigmoid function
RBMs parameters (wij, bj, ci) are efficiently calculated using the contrastive divergence learning method [150]. A batch version of k-step contrastive divergence learning (CD-k) can be discussed in the algorithm below [36]
.
3.3 Deep belief networks
The Deep Belief Networks (DBN) proposed by Hinton et al. [51] is a non-convolution model that can extract features and learn a deep hierarchical representation of training data. DBNs are generative models constructed by stacking multiple RBMs. DBN is a hybrid model, the first two layers are like RBM, and the rest of the layers form a directed generative model. A DBN has one visible layer v and a series of hidden layers h(1), h(2), …, h(l) as shown in Fig. 4c. The DBN model joint distribution between the observed units v and the l hidden layers hk( k = 1, …l) as (9)
where v = h(0), P(hk| hk + 1) is a conditional distribution (10) for the layer k given the units of k + 1
A DBN has l weight matrices: W(1), …. , W(l) and l + 1 bias vectors: b(0), …, b(l)P(h(l), h(l − 1)) is the joint distribution of top-level RBM (11).
The probability distribution of DBN is given by Eq. (12)
3.4 Convolutional neural networks (CNN)
In neural networks, CNN is a unique family of deep learning models. CNN is a major artificial visual network for the identification of medical image patterns. The family of CNN primarily emerges from the information of the animal visual cortex [55, 116]. The major problem within a fully connected feed-forward neural network is that even for shallow architectures, the number of neurons may be very high, which makes them impractical to apply to image applications. The CNN is a method for reducing the number of parameters, allows a network to be deeper with fewer parameters.
CNN’s are designed based on three architectural ideas that are shared weights, local receptive fields, and spatial sub-sampling [70]. The essential element of CNN is the handling of unstructured data through the convolution operation. Convolution of the input signal x(t) with filter signal h(t) creates an output signal y(t) that may reveal more information than the input signal itself. 1D convolution of a discrete signals x(t) and h(t) is (13)
A digital image x(n1, n2) is a 2-D discrete signal. The convolution of images x(n1, n2) and h(n1, n2) is (14)
where 0 ≤ n1 ≤ M − 1, 0 ≤ n2 ≤ N − 1.
The function of the convolution layer is to detect local features xl from input feature maps xl − 1 using kernels kl by convolution operation (*) i.e. xl − 1 ∗ kl. This convolution operation is repeated for every convolutional layer subject to non-linear transform (15)
where \( {k}_{mn}^{(l)} \) represents weights between feature map m at layer l − 1 and feature map n at \( l.{x}_m^{\left(l-1\right)} \) represents the m feature map of the layer l − 1 and \( {x}_n^l \) is n feature map of the layer l. \( {b}_m^{(l)} \) is the bias parameter. f(.) is the non-linear activation function. Ml − 1 denotes a set of feature maps. CNN significantly reduces the number of parameters compared with a fully connected neural network because of local connectivity and weight sharing. The depth, zero-padding, and stride are three hyperparameters for controlling the volume of the convolution layer output.
A pooling layer comes after the convolutional layer to subsample the feature maps. The goal of the pooling layers is to achieve spatial invariance by minimizing the spatial dimension of the feature maps for the next convolution layer. Max pooling and average pooling are commonly used two different polling operations to achieve downsampling. Let the size of the pooling region M and each element in the pooling region is given as xj = (x1, x2, …xM × M), the output after pooling is given as xi. Max pooling and average polling are described in the following Eqs. (16) and (17).
The max-pooling method chooses the most superior invariant feature in a pooling region. The average pooling method selects the average of all the features in the pooling area. Thus, the max-pooling method holds texture information that can lead to faster convergence, average pooling method is called Keep background information [133]. Spatial pyramid pooling [48], stochastic polling [175], Def-pooling [109], Multi activation pooling [189], and detailed preserving pooling [130] are different pooling techniques in the literature. A fully connected layer is used at the end of the CNN model. Fully connected layers perform like a traditional neural network [174]. The input to this layer is a vector of numbers (output of the pooling layer) and outputs an N-dimensional vector (N number of classes). After the pooling layers, the feature of previous layer maps is flattened and connected to fully connected layers.
The first successful seven-layered LeNet-5 CNN was developed by Yann LeCunn in 1990 for handwritten digit recognition successfully. Krizhevsky et al. [68] proposed AlexNet is a deep convolutional neural network composed of 5 convolutional and 3 fully-connected layers. In AlexNet changed the sigmoid activation function to a ReLU activation function to make model training easier.
K. Simonyan and A. Zisserman invented the VGG-16 [143] which has 13 convolutional and 3 fully connected layers. The Visual Geometric Group (VGG) research group released a series of CNN starting from VGG-11, VGG-13, VGG-16, and VGG-19. The main intention of the VGG group to understand how the depth of convolutional networks affects the accuracy of the models of image classification and recognition. Compared to the maximum VGG19, which has 16 convolutional layers and 3 fully connected layers, the minimum VGG11 has 8 convolutional layers and 3 fully connected layers. The last three fully connected layers are the same as the various variations of VGG.
Szegedy et al. [151] proposed an image classification network consisting of 22 different layers, which is GoogleNet. The main idea behind GoogleNet is the introduction of inception layers. Each inception layer convolves the input layers partially using different filter sizes. Kaiming He et al. [49] proposed the ResNet architecture, which has 33 convolutional layers and one fully-connected layer. Many models introduced the principle of using multiple hidden layers and extremely deep neural networks, but then it was realized that such models suffered from the issue of vanishing or exploding gradients problem. For eliminating vanishing gradients’ problem skip layers (shortcut connections) are introduced. DenseNet developed by Gao et al. [54] consists of several dense blocks and transition blocks, which are placed between two adjacent dense blocks. The dense block consists of three layers of batch normalization, followed by a ReLU and a 3 × 3 convolution operation. The transition blocks are made of Batch Normalization, 1 × 1 convolution, and average Pooling.
Compared to state-of-the-art handcrafted feature detectors, CNNs is an efficient technique for detecting features of an object and achieving good classification performance. There are drawbacks to CNNs, which are that unique relationships, size, perspective, and orientation of features are not taken into account. To overcome the loss of information in CNNs by pooling operation Capsule Networks (CapsNet) are used to obtain spatial information and most significant features [129]. The special type of neurons, called capsules, can detect efficiently distinct information. The capsule network consists of four main components that are matrix multiplication, Scalar weighting of the input, dynamic routing algorithm, and squashing function.
3.5 Recurrent neural networks (RNN)
RNN is a class of neural networks used for processing sequential information (deal with sequential data). The structure of the RNN shown in Fig. 5a is like an FFNN and the difference is that recurrent connections are introduced among hidden nodes. A generic RNN model at time t, the recurrent connection hidden unit ht receives input activation from the present data xt and the previous hidden state ht − 1. The output yt is calculated given the hidden state ht. It can be represented using the mathematical Eqs. (18) and (19) as

Here f is a non-linear activation function, whx is the weight matrix between the input and hidden layers, whh is the matrix of recurrent weights between the hidden layers and itself wyh is the weight matrix between the hidden and output layer, and bhand by are biases that allow each node to learn and offset. While the RNN is a simple and efficient model, in reality, it is, unfortunately, difficult to train properly. Real-Time Recurrent Learning (RTRL) algorithm [173] and Back Propagation Through Time (BPTT) [170] methods are used to train RNN. Training with these methods frequently fails because of vanishing (multiplication of many small values) or explode (multiplication of many large values) gradient problem [10, 112]. Hochreiter and Schmidhuber (1997) designed a new RNN model named Long Short Term Memory (LSTM) that overcome error backflow problems with the aid of a specially designed memory cell [52]. Figure 5b shows an LSTM cell which is typically configured by three gates: input gate gt, forget gate ft and output gate ot, these gates add or remove information from the cell.
An LSTM can be represented with the following Eqs. (20) to (25)
3.6 Generative adversarial networks (GAN)
In the field of deep learning, one of the deep generative models are Generative Adversarial Networks (GANs) introduced by Good Fellow in [43]. GANs are neural networks that can generate synthetic images that closely imitate the original images. In GAN shown in Fig. 5c, there are two neural networks, namely generator, and discriminator, which are trained simultaneously. The generator G generates counterfeit data samples which aim to “fool” the discriminator D, while the discriminator attempts to correctly distinguish the true and false samples. In mathematical terms, D and G play a two player minimax game with the cost function of (26) [64].
Where x represents the original image, z is a noise vector with random numbers. pdata(x) and pz(z) are probability distributions of x and z, respectively. D(x) represents the probability that x comes from the actual data pdata(x) rather than the generated data. 1 − D(G(z)) is the probability that it can be generated from pz(z). The expectation of x from the real data distribution pdata is expressed by \( {E}_{x\sim {p}_{data(x)}} \) and the expectation of z sampled from noise is \( {E}_{\mathrm{z}\sim {P}_{\mathrm{z}}\left(\mathrm{z}\right)}. \) The goal of the training is to maximize the loss function for the discriminator, while the training objective for the generator is to reduce the term log(1 − D(G(z))).The most utilization of GAN in the field of medical image analysis is data augmentation (generating new data) and image to image translation [107]. Trustability of the Generated Data, Unstable Training, and evaluation of generated data are three major drawbacks of GAN that might hinder their acceptance in the medical community [183].
3.7 U-net
Ronneberger et al. [126] proposed CNN based U-Net architecture for segmentation in biomedical image data. The architecture consists of a contracting path (left side) to capture context and an expansive symmetric path (right side) that enables precise localization. U-Net is a generalized DLA used for quantification tasks such as cell detection and shape measurement in medical image data [34].
3.8 Software frameworks
There are several software frameworks available for implementing DLA which are regularly updated as new approaches and ideas are created. DLA encapsulates many levels of mathematical principles based on probability, linear algebra, calculus, and numerical computation. Several deep learning frameworks exist such as Theano, TensorFlow, Caffe, CNTK, Torch, Neon, pylearn, etc. [138]. Globally, Python is probably the most commonly used programming language for DL. PyTorch and Tensorflow are the most widely used libraries for research in 2019. Table 2 shows the analysis of various Deep Learning Frameworks based on the core language and supported interface language.
4 Use of deep learning in medical imaging
4.1 X-ray image
Chest radiography is widely used in diagnosis to detect heart pathologies and lung diseases such as tuberculosis, atelectasis, consolidation, pleural effusion, pneumothorax, and hyper cardiac inflation. X-ray images are accessible, affordable, and less dose-effective compared to other imaging methods, and it is a powerful tool for mass screening [14]. Table 3 presents a description of the DL methods used for X-ray image analysis.
S. Hwang et al. [57] proposed the first deep CNN-based Tuberculosis screening system with a transfer learning technique. Rajaraman et al. [119] proposed modality-specific ensemble learning for the detection of abnormalities in chest X-rays (CXRs). These model predictions are combined using various ensemble techniques toward minimizing prediction variance. Class selective mapping of interest (CRM) is used for visualizing the abnormal regions in the CXR images. Loey et al. [90] proposed A GAN with deep transfer training for COVID-19 detection in CXR images. The GAN network was used to generate more CXR images due to the lack of the COVID-19 dataset. Waheed et al. [160] proposed a CovidGAN model based on the Auxiliary Classifier Generative Adversarial Network (ACGAN) to produce synthetic CXR images for COVID-19 detection. S. Rajaraman and S. Antani [120] introduced weakly labeled data augmentation for increasing training dataset to improve the COVID-19 detection performance in CXR images.
4.2 Computerized tomography (CT)
CT uses computers and rotary X-ray equipment to create cross-section images of the body. CT scans show the soft tissues, blood vessels, and bones in different parts of the body. CT is a high detection ability, reveals small lesions, and provides a more detailed assessment. CT examinations are frequently used for pulmonary nodule identification [93]. The detection of malignant pulmonary nodules is fundamental to the early diagnosis of lung cancer [102, 142]. Table 4 summarizes the latest deep learning developments in the study of CT image analysis.
Li et al. 2016 [74] proposed deep CNN for the detection of three types of nodules that are semisolid, solid, and ground-glass opacity. Balagourouchetty et al. [5] proposed GoogLeNet based an ensemble FCNet classifier for The liver lesion classification. For feature extraction, basic Googlenet architecture is modified with three modifications. Masood et al. [95] proposed the multidimensional Region-based Fully Convolutional Network (mRFCN) for lung nodule detection/classification and achieved a classification accuracy of 97.91%. In lung nodule detection, the feature work is the detection of micronodules (less than 3 mm) without loss of sensitivity and accuracy. Zhao and Zeng 2019 [190] proposed DLA based on supervised MSS U-Net and 3DU-Net to automatically segment kidneys and kidney tumors from CT images. In the present pandemic situation, Fan et al. [35] and Li et al. [79] used deep learning-based techniques for COVID-19 detection from CT images.
4.3 Mammograph (MG)
Breast cancer is one of the world’s leading causes of death among women with cancer. MG is a reliable tool and the most common modality for early detection of breast cancer. MG is a low-dose x-ray imaging method used to visualize the breast structure for the detection of breast diseases [40]. Detection of breast cancer on mammography screening is a difficult task in image classification because the tumors constitute a small part of the actual breast image. For analyzing breast lesions from MG, three steps are involved that are detection, segmentation, and classification [139].
The automatic classification and detection of masses at an early stage in MG is still a hot subject of research. Over the past decade, DLA has shown some significant overcome in breast cancer detection and classification problem. Table 5 summarizes the latest DLA developments in the study of mammogram image analysis.
Fonseca et al. [37] proposed a breast composition classification according to the ACR standard based on CNN for feature extraction. Wang et al. [161] proposed twelve-layer CNN to detect Breast arterial calcifications (BACs) in mammograms image for risk assessment of coronary artery disease. Ribli et al. [124] developed a CAD system based on Faster R-CNN for detection and classification of benign and malignant lesions on a mammogram image without any human involvement. Wu et al. [176] present a deep CNN trained and evaluated on over 1,000,000 mammogram images for breast cancer screening exam classification. Conant et al. [26] developed a Deep CNN based AI system to detect calcified lesions and soft- tissue in digital breast tomosynthesis (DBT) images. Kang et al. [62] introduced Fuzzy completely connected layer (FFCL) architecture, which focused primarily on fused fuzzy rules with traditional CNN for semantic BI-RADS scoring. The proposed FFCL framework achieved superior results in BI-RADS scoring for both triple and multi-class classifications.
4.4 Histopathology
Histopathology is the field of study of human tissue in the sliding glass using a microscope to identify different diseases such as kidney cancer, lung cancer, breast cancer, and so on. The staining is used in histopathology for visualization and highlight a specific part of the tissue [45]. For example, Hematoxylin and Eosin (H&E) staining tissue gives a dark purple color to the nucleus and pink color to other structures. H&E stain plays a key role in the diagnosis of different pathologies, cancer diagnosis, and grading over the last century. The recent imaging modality is digital pathology
Deep learning is emerging as an effective method in the analysis of histopathology images, including nucleus detection, image classification, cell segmentation, tissue segmentation, etc. [178]. Tables 6 and 7 summarize the latest deep learning developments in pathology. In the study of digital pathology image analysis, the latest development is the introduction of whole slide imaging (WSI). WSI allows digitizing glass slides with stained tissue sections at high resolution. Dimitriou et al. [30] reviewed challenges for the analysis of multi-gigabyte WSI images for building deep learning models. A. Serag et al. [135] discuss different public “Grand Challenges” that have innovations using DLA in computational pathology.
4.5 Other images
Endoscopy is the insertion of a long nonsurgical solid tube directly into the body for the visual examination of an internal organ or tissue in detail. Endoscopy is beneficial in studying several systems inside the human body, such as the gastrointestinal tract, the respiratory tract, the urinary tract, and the female reproductive tract [60, 101]. Du et al. [31] reviewed the Applications of Deep Learning in the Analysis of Gastrointestinal Endoscopy Images. A revolutionary device for direct, painless, and non-invasive inspection of the gastrointestinal (GI) tract for detecting and diagnosing GI diseases (ulcer, bleeding) is Wireless capsule endoscopy (WCE). Soffer et al. [145] performed a systematic analysis of the existing literature on the implementation of deep learning in the WCE. The first deep learning-based framework was proposed by He et al. [46] for the detection of hookworm in WCE images. Two CNN networks integrated (edge extraction and classification of hookworm) to detect hookworm. Since tubular structures are crucial elements for hookworm detection, the edge extraction network was used for tubular region detection. Yoon et al. [185] developed a CNN model for early gastric cancer (EGC) identification and prediction of invasion depth. The depth of tumor invasion in early gastric cancer (EGC) is a significant factor in deciding the method of treatment. For the classification of endoscopic images as EGC or non-EGC, the authors employed a VGG-16 model. Nakagawa et al. [105] applied DL technique based on CNN to enhance the diagnostic assessment of oesophageal wall invasion using endoscopy. J.choi et al. [22] express the feature aspects of DL in endoscopy.
Positron Emission Tomography (PET) is a nuclear imaging tool that is generally used by the injection of particular radioactive tracers to visualize molecular-level activities within tissues. T. Wang et al. [168] reviewed applications of machine learning in PET attenuation correction (PET AC) and low-count PET reconstruction. The authors discussed the advantages of deep learning over machine learning in the applications of PET images. AJ reader et al. [123] reviewed the reconstruction of PET images that can be used in deep learning either directly or as a part of traditional reconstruction methods.
5 Discussion
The primary purpose of this paper is to review numerous publications in the field of deep learning applications in medical images. Classification, detection, and segmentation are essential tasks in medical image processing [144]. For specific deep learning tasks in medical applications, the training of deep neural networks needs a lot of labeled data. But in the medical field, at least thousands of labeled data is not available. This issue is alleviated by a technique called transfer learning. Two transfer learning approaches are popular and widely applied that are fixed feature extractors and fine-tuning a pre-trained network. In the classification process, the deep learning models are used to classify images into two or more classes. In the detection process, Deep learning models have the function of identifying tumors and organs in medical images. In the segmentation task, deep learning models try to segment the region of interest in medical images for processing.
5.1 Segmentation
For medical image segmentation, deep learning has been widely used, and several articles have been published documenting the progress of deep learning in the area. Segmentation of breast tissue using deep learning alone has been successfully implemented [104]. Xing et al. [179] used CNN to acquire the initial shape of the nucleus and then isolate the actual nucleus using a deformable pattern. Qu et al. [118] suggested a deep learning approach that could segment the individual nucleus and classify it as a tumor, lymphocyte, and stroma nuclei. Pinckaers and Litjens [115] show on a colon gland segmentation dataset (GlaS) that these Neural Ordinary Differential Equations (NODE) can be used within the U-Net framework to get better segmentation results. Sun 2019 [149] developed a deep learning architecture for gastric cancer segmentation that shows the advantage of utilizing multi-scale modules and specific convolution operations together. Figure 6 shows U-Net is the most usually used network for segmentation (Fig. 6).

U-Net architecture for segmentation,comprising encoder (downsampling) and decoder (upsampling) sections [135]
5.2 Detection
The main challenge posed by methods of detection of lesions is that they can give rise to multiple false positives while lacking a good proportion of true positive ones. For tuberculosis detection using deep learning methods applied in [53, 57, 58, 91, 119]. Pulmonary nodule detection using deep learning has been successfully applied in [82, 108, 136, 157].
Shin et al. [141] discussed the effect of CNN pre-trained architectures and transfer learning on the identification of enlarged thoracoabdominal lymph nodes and the diagnosis of interstitial lung disease on CT scans, and considered transfer learning to be helpful, given the fact that natural images vary from medical images. Litjens et al. [85] introduced CNN for the identification of Prostate cancer in biopsy specimens and breast cancer metastasis identification in sentinel lymph nodes. The CNN has four convolution layers for feature extraction and three classification layers. Riddle et al. [124] proposed the Faster R-CNN model for the detection of mammography lesions and classified these lesions into benign and malignant, which finished second in the Digital Mammography DREAM Challenge. Figure 7 shows VGG architecture for detection.

CNN architecture for detection [144]
An object detection framework named Clustering CNN (CLU-CNNs) was proposed by Z. Li et al. [76] for medical images. CLU-CNNs used Agglomerative Nesting Clustering Filtering (ANCF) and BN-IN Net to avoid much computation cost facing medical images. Image saliency detection aims at locating the most eye-catching regions in a given scene [21, 78]. The goal of image saliency detection is to locate a given scene in the most eye-catching regions. In different applications, it also acts as a pre-processing tool including video saliency detection [17, 18], object recognition, and object tracking [20]. Saliency maps are a commonly used tool for determining which areas are most important to the prediction of a trained CNN on the input image [92]. NT Arun et al. [4] evaluated the performance of several popular saliency methods on the RSNA Pneumonia Detection dataset and was found that GradCAM was sensitive to the model parameters and model architecture.
5.3 Classification
In classification tasks, deep learning techniques based on CNN have seen several advancements. The success of CNN in image classification has led researchers to investigate its usefulness as a diagnostic method for identifying and characterizing pulmonary nodules in CT images. The classification of lung nodules using deep learning [74, 108, 117, 141] has also been successfully implemented.
Breast parenchymal density is an important indicator of the risk of breast cancer. The DL algorithms used for density assessment can significantly reduce the burden of the radiologist. Breast density classification using DL has been successfully implemented [37, 59, 72, 177]. Ionescu et al. [59] introduced a CNN-based method to predict Visual Analog Score (VAS) for breast density estimation. Figure 8 shows AlexNet architecture for classification.
Alcoholism or alcohol use disorder (AUD) has effects on the brain. The structure of the brain was observed using the Neuroimaging approach. S.H.Wang et al. [162] proposed a 10-layer CNN for alcohol use disorder (AUD) problem using dropout, batch normalization, and PReLU techniques. The authors proposed a 10 layer CNN model that has obtained a sensitivity of 97.73, a specificity of 97.69, and an accuracy of 97.71. Cerebral micro-bleeding (CMB) are small chronic brain hemorrhages that can result in cognitive impairment, long-term disability, and neurologic dysfunction. Therefore, early-stage identification of CMBs for prompt treatment is essential. S. Wang et al. [164] proposed the transfer learning-based DenseNet to detect Cerebral micro-bleedings (CMBs). DenseNet based model attained an accuracy of 97.71% (Fig. 8).

CNN architecture for classification [144]
5.4 Limitations and challenges
The application of deep learning algorithms to medical imaging is fascinating, but many challenges are pulling down the progress. One of the limitations to the adoption of DL in medical image analysis is the inconsistency in the data itself (resolution, contrast, signal-to-noise), typically caused by procedures in clinical practice [113]. The non-standardized acquisition of medical images is another limitation in medical image analysis. The need for comprehensive medical image annotations limits the applicability of deep learning in medical image analysis. The major challenge is limited data and compared to other datasets, the sharing of medical data is incredibly complicated. Medical data privacy is both a sociological and a technological issue that needs to be discussed from both viewpoints. For building DLA a large amount of annotated data is required. Annotating medical images is another major challenge. Labeling medical images require radiologists’ domain knowledge. Therefore, it is time-consuming to annotate adequate medical data. Semi-supervised learning could be implemented to make combined use of the existing labeled data and vast unlabelled data to alleviate the issue of “limited labeled data”. Another way to resolve the issue of “data scarcity” is to develop few-shot learning algorithms using a considerably smaller amount of data. Despite the successes of DL technology, there are many restrictions and obstacles in the medical field. Whether it is possible to reduce medical costs, increase medical efficiency, and improve the satisfaction of patients using DL in the medical field cannot be adequately checked. However, in clinical trials, it is necessary to demonstrate the efficacy of deep learning methods and to develop guidelines for the medical image analysis applications of deep learning.
6 Conclusion and future directions
Medical imaging is a place of origin of the information necessary for clinical decisions. This paper discusses the new algorithms and strategies in the area of deep learning. In this brief introduction to DLA in medical image analysis, there are two objectives. The first one is an introduction to the field of deep learning and the associated theory. The second is to provide a general overview of the medical image analysis using DLA. It began with the history of neural networks since 1940 and ended with breakthroughs in medical applications in recent DL algorithms. Several supervised and unsupervised DL algorithms are first discussed, including auto-encoders, recurrent, CNN, and restricted Boltzmann machines. Several optimization techniques and frameworks in this area include Caffe, TensorFlow, Theano, and PyTorch are discussed. After that, the most successful DL methods were reviewed in various medical image applications, including classification, detection, and segmentation. Applications of the RBM network is rarely published in the medical image analysis literature. In classification and detection, CNN-based models have achieved good results and are most commonly used. Several existing solutions to medical challenges are available. However, there are still several issues in medical image processing that need to be addressed with deep learning. Many of the current DL implementations are supervised algorithms, while deep learning is slowly moving to unsupervised and semi-supervised learning to manage real-world data without manual human labels.
DLA can support clinical decisions for next-generation radiologists. DLA can automate radiologist workflow and facilitate decision-making for inexperienced radiologists. DLA is intended to aid physicians by automatically identifying and classifying lesions to provide a more precise diagnosis. DLA can help physicians to minimize medical errors and increase medical efficiency in the processing of medical image analysis. DL-based automated diagnostic results using medical images for patient treatment are widely used in the next few decades. Therefore, physicians and scientists should seek the best ways to provide better care to the patient with the help of DLA. The potential future research for medical image analysis is the designing of deep neural network architectures using deep learning. The enhancement of the design of network structures has a direct impact on medical image analysis. Manual design of DL Model structure requires rich knowledge; hence Neural Network Search will probably replace the manual design [73]. A meaningful feature research direction is also the design of various activation functions. Radiation therapy is crucial for cancer treatment. Different medical imaging modalities are playing a critical role in treatment planning. Radiomics was defined as the extraction of high throughput features from medical images [28]. In the feature, Deep-learning analysis of radionics will be a promising tool in clinical research for clinical diagnosis, drug development, and treatment selection for cancer patients. Due to limited annotated medical data, unsupervised, weakly supervised, and reinforcement learning methods are the emerging research areas in DL for medical image analysis. Overall, deep learning, a new and fast-growing field, offers various obstacles as well as opportunities and solutions for a range of medical image applications.
References
Abadi M et al. (2016) TensorFlow: Large-Scale Machine Learning on Heterogeneous Distributed Systems, [Online]. Available: http://arxiv.org/abs/1603.04467.
Abbas A, Abdelsamea MM, Gaber MM (2020) Classification of COVID-19 in chest X-ray images using DeTraC deep convolutional neural network, pp. 1–9, [Online]. Available: http://arxiv.org/abs/2003.13815.
Apostolopoulos ID, Mpesiana TA (2020) Covid-19: automatic detection from X-ray images utilizing transfer learning with convolutional neural networks, Phys Eng Sci Med, no. 0123456789, pp. 1–6, DOI: https://doi.org/10.1007/s13246-020-00865-4.
Arun NT et al. (2020) Assessing the validity of saliency maps for abnormality localization in medical imaging, pp. 1–5, [Online]. Available: http://arxiv.org/abs/2006.00063.
L. Balagourouchetty, J. K. Pragatheeswaran, B. Pottakkat, and R. G, “GoogLeNet based ensemble FCNet classifier for focal liver lesion diagnosis,” IEEE J Biomed Heal Inf, vol. 2194, no. c, pp. 1–1, 2019, DOI: https://doi.org/10.1109/jbhi.2019.2942774, 1694.
Bastien F et al. (2012) Theano: new features and speed improvements, pp. 1–10, [Online]. Available: http://arxiv.org/abs/1211.5590.
Basu S, Mitra S, Saha N (2020) Deep Learning for Screening COVID-19 using Chest X-Ray Images, pp. 1–6, [Online]. Available: http://arxiv.org/abs/2004.10507.
Bauer S, Wiest R, Nolte LP, Reyes M (2013) A survey of MRI-based medical image analysis for brain tumor studies. Phys Med Biol 58(13):1–44. https://doi.org/10.1088/0031-9155/58/13/R97
Bengio Y, Lamblin P, Popovici D, Larochelle H (2006) Greedy layer-wise training of deep networks. In: The 19th International Conference on Neural Information Processing Systems(NIPS’06), pp 153–160. https://doi.org/10.5555/2976456.2976476
Bengio Y, Simard P, Palo F (1994) Learning long -term dependencies with gradient descent is difficult. IEEE Trans Neural Netw 5(2):157–166
Bizopoulos P, Koutsouris D (2019) Deep learning in cardiology. IEEE Rev Biomed Eng 12(c):168–193. https://doi.org/10.1109/RBME.2018.2885714
Bulten W, Litjens G (2018) Unsupervised Prostate Cancer Detection on H&E using Convolutional Adversarial Autoencoders, [Online]. Available: http://arxiv.org/abs/1804.07098.
Cai H et al. (2019) Breast Microcalcification Diagnosis Using Deep Convolutional Neural Network from Digital Mammograms, Comput Math Methods Med, vol. 2019, DOI: https://doi.org/10.1155/2019/2717454.
Candemir S, Rajaraman S, Thoma G, Antani S (2018) Deep learning for grading cardiomegaly severity in chest x-rays : an investigation. In: 2018 IEEE Life Sciences Conference (LSC), pp 109–113. https://doi.org/10.1109/LSC.2018.8572113
Capizzi G, Lo Sciuto G, Napoli C, Połap D (2020) Small Lung Nodules Detection based on Fuzzy-Logic and Probabilistic Neural Network with Bio-inspired Reinforcement Learning, IEEE Trans Fuzzy Syst, vol. PP, no. XX, p. 1. https://doi.org/10.1109/TFUZZ.2019.2952831.
Chen DS, Jain RC (1994) A robust back propagation learning algorithm for function approximation. IEEE Trans. Neural Networks 5(3):467–479. https://doi.org/10.1109/72.286917
Chen C, Li S, Qin H, Pan Z, Yang G (2018) Bilevel feature learning for video saliency detection. IEEE Trans Multimed 20(12):3324–3336. https://doi.org/10.1109/TMM.2018.2839523
Chen C, Li S, Wang Y, Qin H, Hao A (2017) Video saliency detection via spatial-temporal fusion and low-rank coherency diffusion. IEEE Trans Image Process 26(7):3156–3170. https://doi.org/10.1109/TIP.2017.2670143
Chen H, Qi X, Yu L, Dou Q, Qin J, Heng PA (2017) DCAN: deep contour-aware networks for object instance segmentation from histology images. Med Image Anal 36:135–146. https://doi.org/10.1016/j.media.2016.11.004
Chen C, Wang G, Peng C, Zhang X, Qin H (2020) Improved robust video saliency detection based on long-term spatial-temporal information. IEEE Trans Image Process 29:1090–1100. https://doi.org/10.1109/TIP.2019.2934350
Chen C, Wei J, Peng C, Zhang W, Qin H (2020) Improved saliency detection in RGB-D images using two-phase depth estimation and selective deep fusion. IEEE Trans Image Process 29:4296–4307. https://doi.org/10.1109/TIP.2020.2968250
Choi J, Shin K, Jung J, Bae HJ, Kim DH, Byeon JS, Kim N (2020) Convolutional neural network technology in endoscopic imaging: artificial intelligence for endoscopy. Clin Endosc 53(2):117–126. https://doi.org/10.5946/ce.2020.054
Chougrad H, Zouaki H, Alheyane O (2018) Deep convolutional neural networks for breast cancer screening. Comput Methods Prog Biomed 157:19–30. https://doi.org/10.1016/j.cmpb.2018.01.011
Clevert DA, Unterthiner T, Hochreiter S (2016) Fast and accurate deep network learning by exponential linear units (ELUs). In: 4th International Conference on Learning Representations, ICLR 2016, pp 1–14
Collobert R, Kavukcuoglu K, Farabet C (2011) Torch7: A matlab-like environment for machine learning, BigLearn, NIPS Work, pp. 1–6, [Online]. Available: http://infoscience.epfl.ch/record/192376/files/Collobert_NIPSWORKSHOP_2011.pdf.
Conant EF et al (2019) Improving Accuracy and Efficiency with Concurrent Use of Artificial Intelligence for Digital Breast Tomosynthesis. Radiol Artif Intell 1(4):e180096. https://doi.org/10.1148/ryai.2019180096
Coudray N, Ocampo PS, Sakellaropoulos T, Narula N, Snuderl M, Fenyö D, Moreira AL, Razavian N, Tsirigos A (2018) Classification and mutation prediction from non–small cell lung cancer histopathology images using deep learning. Nat Med 24(10):1559–1567. https://doi.org/10.1038/s41591-018-0177-5
Dercle L, Henry T, Carré A, Paragios N, Deutsch E, Robert C (2020) Reinventing radiation therapy with machine learning and imaging bio-markers (radiomics): State-of-the-art, challenges and perspectives, Methods, no. May, pp. 0–1, DOI: https://doi.org/10.1016/j.ymeth.2020.07.003.
Dhillon A, Verma GK (2019) Convolutional neural network: a review of models, methodologies, and applications to object detection Prog Artif Intell, no. 0123456789, DOI: https://doi.org/10.1007/s13748-019-00203-0.
Dimitriou N, Arandjelović O, Caie PD (2019) Deep Learning for Whole Slide Image Analysis: An Overview. Front Med 6(November):1–7. https://doi.org/10.3389/fmed.2019.00264
Du W et al (2019) Review on the applications of deep learning in the analysis of gastrointestinal endoscopy images. IEEE Access 7:142053–142069. https://doi.org/10.1109/ACCESS.2019.2944676
Dugas C, Bengio Y, Bélisle F, Nadeau C, Garcia R (2000) Incorporating second-order functional knowledge for better option pricing. In: 13th International Conference on Neural Information Processing Systems (NIPS’00), pp 451–457. https://doi.org/10.5555/3008751.3008817
Eberhart RC, Dobbins RW (1990) Early neural network development history: the age of Camelot. IEEE Eng Med Biol Mag 9(3):15–18. https://doi.org/10.1109/51.59207
Falk T, Mai D, Bensch R, Çiçek Ö, Abdulkadir A, Marrakchi Y, Böhm A, Deubner J, Jäckel Z, Seiwald K, Dovzhenko A, Tietz O, Dal Bosco C, Walsh S, Saltukoglu D, Tay TL, Prinz M, Palme K, Simons M, Diester I, Brox T, Ronneberger O (2019) U-net: deep learning for cell counting, detection, and morphometry. Nat Methods 16(1):67–70. https://doi.org/10.1038/s41592-018-0261-2
Fan D-P et al. (2020) Inf-Net: Automatic COVID-19 Lung Infection Segmentation from CT Scans, pp. 1–10, [Online]. Available: http://arxiv.org/abs/2004.14133.
Fischer A, Igel C (2014) Training restricted Boltzmann machines: an introduction. Pattern Recogn 47(1):25–39. https://doi.org/10.1016/j.patcog.2013.05.025
Fonseca P et al (2015) Automatic breast density classification using a convolutional neural network architecture search procedure. Med Imaging 2015 Comput Diagnosis 9414(c):941428. https://doi.org/10.1117/12.2081576
Fukushima K (1980) Neocognitron: a self-organizing neural network model for a mechanism of pattern recognition unaffected by shift in position. Biol Cybern 36(4):193–202. https://doi.org/10.1007/BF00344251
Gadermayr M, Gupta L, Appel V, Boor P, Klinkhammer BM, Merhof D (2019) Generative adversarial networks for facilitating stain-independent supervised and unsupervised segmentation: a study on kidney histology. IEEE Trans Med Imaging 38(10):2293–2302. https://doi.org/10.1109/TMI.2019.2899364
Gardezi SJS, Elazab A, Lei B, Wang T (2019) Breast cancer detection and diagnosis using mammographic data: systematic review. J Med Internet Res 21(7):1–22. https://doi.org/10.2196/14464
Geras KJ et al. (2017) High-Resolution Breast Cancer Screening with Multi-View Deep Convolutional Neural Networks, pp. 1–9, [Online]. Available: http://arxiv.org/abs/1703.07047.
Goodfellow I, Bengio Y, Courville A (2016) “Deep learning,” DOI: https://doi.org/10.1038/nmeth.3707
Goodfellow IJ et al (2014) Generative adversarial nets. Adv Neural Inf Process Syst 3(January):2672–2680
Greenspan H, Van Ginneken B, Summers RM (2016) Guest editorial deep learning in medical imaging: overview and future promise of an exciting new technique. IEEE Trans Med Imaging 35(5):1153–1159. https://doi.org/10.1109/TMI.2016.2553401
Gurcan MN, Boucheron LE, Can A, Madabhushi A, Rajpoot NM, Yener B (2009) Histopathological image analysis: a review. IEEE Rev Biomed Eng 2:147–171. https://doi.org/10.1109/RBME.2009.2034865
He JY, Wu X, Jiang YG, Peng Q, Jain R (2018) Hookworm detection in wireless capsule endoscopy images with deep learning. IEEE Trans Image Process 27(5):2379–2392. https://doi.org/10.1109/TIP.2018.2801119
He K, Zhang X, Ren S., Sun J (2015) Delving deep into rectifiers: Surpassing human-level performance on imagenet classification, Proc IEEE Int Conf Comput Vis, vol. 2015 Inter, pp 1026–1034, DOI: https://doi.org/10.1109/ICCV.2015.123.
He K, Zhang X, Ren S, Sun J (2015) Spatial pyramid pooling in deep convolutional networks for visual recognition. IEEE Trans Pattern Anal Mach Intell 37(9):1904–1916
He K, Zhang X, Ren S, Sun J (2016) Deep residual learning for image recognition. Proc IEEE Comput Soc Conf Comput Vis Pattern Recognit 2016(Decem):770–778. https://doi.org/10.1109/CVPR.2016.90
Hinton G (2014) Boltzmann Machines, Encycl Mach Learn Data Min, no. 1, pp. 1–7, DOI: https://doi.org/10.1007/978-1-4899-7502-7_31-1.
Hinton GE, Osindero S, Teh Y-W (2006) A fast learning algorithm for deep belief nets. Neural Comput 18:1527–1554. https://doi.org/10.1162/neco.2006.18.7.1527
Hochreiter S, Schmidhuber J (1997) Long short-term memory. Neural Comput 9(8):1735–1780. https://doi.org/10.1162/neco.1997.9.8.1735
Hooda R, Mittal A, Sofat S (2019) Automated TB classification using ensemble of deep architectures. Multimed Tools Appl 78(22):31515–31532. https://doi.org/10.1007/s11042-019-07984-5
Huang G, Liu Z, Van Der Maaten L, Weinberger KQ (2017) Densely connected convolutional networks. Proc - 30th IEEE Conf Comput Vis Pattern Recognition, CVPR 2017 2017(Janua):2261–2269. https://doi.org/10.1109/CVPR.2017.243
Hubel DH, Wiesel TN (1962) Receptive fields, binocular interaction and functional architecture in the cat’s visual cortex. J Physiol 160(1):106–154. https://doi.org/10.1113/jphysiol.1962.sp006837
Huynh BQ, Li H, Giger ML (2016) Digital mammographic tumor classification using transfer learning from deep convolutional neural networks. J Med Imaging 3(3):034501. https://doi.org/10.1117/1.jmi.3.3.034501
Hwang S, Kim H-E, Jeong J, Kim H-J (2016) A novel approach for tuberculosis screening based on deep convolutional neural networks. Med Imaging 2016 Comput Diagnosis 9785:97852W. https://doi.org/10.1117/12.2216198
Hwang EJ, Park S, Jin KN, Kim JI, Choi SY, Lee JH, Goo JM, Aum J, Yim JJ, Park CM, Deep Learning-Based Automatic Detection Algorithm Development and Evaluation Group, Kim DH, Woo W, Choi C, Hwang IP, Song YS, Lim L, Kim K, Wi JY, Oh SS, Kang MJ (2019) Development and validation of a deep learning–based automatic detection algorithm for active pulmonary tuberculosis on chest radiographs. Clin Infect Dis 69(5):739–747. https://doi.org/10.1093/cid/ciy967
Ionescu GV et al (2019) Prediction of reader estimates of mammographic density using convolutional neural networks. J Med Imaging 6(03):1. https://doi.org/10.1117/1.jmi.6.3.031405
Jani KK, Srivastava R (2019) A survey on medical image analysis in capsule endoscopy. Curr Med Imaging Rev 15(7):622–636. https://doi.org/10.2174/1573405614666181102152434
Jia Y et al. (2014) Caffe: Convolutional architecture for fast feature embedding,” MM 2014 – Proc 2014 ACM Conf Multimed , pp. 675–678, DOI: https://doi.org/10.1145/2647868.2654889.
Kang C, Yu X, Wang SH, Guttery DS, Pandey HM, Tian Y, Zhang YD (2020) A heuristic neural network structure relying on fuzzy logic for images scoring. IEEE Trans Fuzzy Syst 6706(c):1–1. https://doi.org/10.1109/tfuzz.2020.2966163 45
S. Karthik, R. Srinivasa Perumal, and P. V. S. S. R. Chandra Mouli, “Breast cancer classification using deep neural networks,” Knowl Comput Its Appl Knowl Manip Process Tech Vol. 1, pp. 227–241, 2018, DOI: https://doi.org/10.1007/978-981-10-6680-1_12
Kazeminia S et al. (2020) GANs for Medical Image Analysis,” Artif Intell Med, p. 104262, DOI: https://doi.org/10.1016/j.jece.2020.104262.
Kim EK, Kim HE, Han K, Kang BJ, Sohn YM, Woo OH, Lee CW (2018) Applying data-driven imaging biomarker in mammography for breast Cancer screening: preliminary study. Sci Rep 8(1):1–8. https://doi.org/10.1038/s41598-018-21215-1
Kingma DP, Welling M Auto-encoding variational bayes. In: 2nd International Conference on Learning, ICLR 2014, vol 2014, pp 1–14
Klambauer G, Unterthiner T, Mayr A, Hochreiter S (2017) Self-normalizing neural networks. Adv Neural Inf Process Syst 2017(Decem):972–981
Krizhevsky A, Sutskever I, Hinton GE (2012) ImageNet classification with deep convolutional neural networks. In: The 25th International Conference on Neural Information Processing Systems, pp 1097–1105. https://doi.org/10.1145/3065386
Kyono T, Gilbert FJ, van der Schaar M (2018) MAMMO: A Deep Learning Solution for Facilitating Radiologist-Machine Collaboration in Breast Cancer Diagnosis, pp. 1–18, [Online]. Available: http://arxiv.org/abs/1811.02661.
LeCun Y, Bengio Y (1998) Convolutional networks for images, speech, and time-series. In: The handbook of brain theory and neural networks, pp 255–258
LeCun Y, Boser B, Denker JS, Henderson D, Howard RE, Hubbard W, Jackel LD (1989) Backpropagation applied to digit recognition. Neural Comput 1(4):541–551
Lehman CD, Yala A, Schuster T, Dontchos B, Bahl M, Swanson K, Barzilay R (2019) Mammographic breast density assessment using deep learning: clinical implementation. Radiology 290(1):52–58. https://doi.org/10.1148/radiol.2018180694
Lei T, Wang R, Wan Y, Du X, Meng H, Nandi AK (2020) Medical Image Segmentation Using Deep Learning: A survey, vol. 171, pp. 17–31, DOI: https://doi.org/10.1007/978-3-030-32606-7_2.
Li W, Cao P, Zhao D, Wang J (2016) Pulmonary Nodule Classification with Deep Convolutional Neural Networks on Computed Tomography Images, Comput Math Methods Med, vol. 2016, DOI: https://doi.org/10.1155/2016/6215085.
Li X, Chen H, Qi X, Dou Q, Fu CW, Heng PA (2018) H-DenseUNet: hybrid densely connected UNet for liver and tumor segmentation from CT volumes. IEEE Trans Med Imaging 37(12):2663–2674. https://doi.org/10.1109/TMI.2018.2845918
Li Z, Dong M, Wen S, Hu X, Zhou P, Zeng Z (2019) CLU-CNNs: Object detection for medical images. Neurocomputing 350(May):53–59. https://doi.org/10.1016/j.neucom.2019.04.028
Li Y, Huang C, Ding L, Li Z, Pan Y, Gao X (2019) Deep learning in bioinformatics: introduction, application, and perspective in the big data era. Methods 166:4–21. https://doi.org/10.1016/j.ymeth.2019.04.008
Li Y, Li S, Chen C, Hao A, Qin H (2020) A Plug-and-play Scheme to Adapt Image Saliency Deep Model for Video Data, IEEE Trans Circuits Syst Video Technol, no. Xx, pp. 1–1, DOI: https://doi.org/10.1109/tcsvt.2020.3023080.
Li L, Qin L, Yin Y, Wang X et al (2019) Artificial Intelligence Distinguishes COVID-19 from Community Acquired Pneumonia on Chest CT. Radiology 2020:1–5. https://doi.org/10.1007/s10489-020-01714-3
Li C, Wang X, Liu W, Latecki LJ, Wang B, Huang J (2019) Weakly supervised mitosis detection in breast histopathology images using concentric loss. Med Image Anal 53:165–178. https://doi.org/10.1016/j.media.2019.01.013
Liang Q, Nan Y, Coppola G, Zou K, Sun W, Zhang D, Wang Y, Yu G (2019) Weakly supervised biomedical image segmentation by reiterative learning. IEEE J Biomed Heal Inf 23(3):1205–1214. https://doi.org/10.1109/JBHI.2018.2850040
Liao F, Liang M, Li Z, Hu X, Song S (2019) Evaluate the malignancy of pulmonary nodules using the 3-D deep leaky Noisy-OR network. IEEE Trans Neural Netw Learn Syst 30(11):3484–3495. https://doi.org/10.1109/TNNLS.2019.2892409
Lin H, Chen H, Graham S, Dou Q, Rajpoot N, Heng PA (2019) Fast ScanNet: fast and dense analysis of multi-Gigapixel whole-slide images for Cancer metastasis detection. IEEE Trans Med Imaging 38(8):1948–1958. https://doi.org/10.1109/TMI.2019.2891305
Litjens G, Kooi T, Bejnordi BE, Setio AAA, Ciompi F, Ghafoorian M, van der Laak JAWM, van Ginneken B, Sánchez CI (2017) A survey on deep learning in medical image analysis. Med Image Anal 42(1995):60–88. https://doi.org/10.1016/j.media.2017.07.005
Litjens G et al (2016) Deep learning as a tool for increased accuracy and efficiency of histopathological diagnosis. Sci Rep 6(January):1–11. https://doi.org/10.1038/srep26286
Little WA (1974) The existence of persistent states in the brain. Math Biosci 19(1–2):101–120. https://doi.org/10.1016/0025-5564(74)90031-5
Little WA, Shaw GL (1978) Analytic study of the memory storage capacity of a neural network. Math Biosci 39(3–4):281–290. https://doi.org/10.1016/0025-5564(78)90058-5
Liu W, Wang Z, Liu X, Zeng N, Liu Y, Alsaadi FE (2017) A survey of deep neural network architectures and their applications. Neurocomputing 234(November 2016):11–26. https://doi.org/10.1016/j.neucom.2016.12.038
Lo SLJLMFMCSMSC, Lo SCB, Lou SLA, Chien MV, Mun SK (1995) Artificial convolution neural network techniques and applications for lung nodule detection. IEEE Trans Med Imaging 14(4):711–718. https://doi.org/10.1109/42.476112
Loey M, Smarandache F, Khalifa NEM (2020) Within the lack of chest COVID-19 X-ray dataset: A novel detection model based on GAN and deep transfer learning, Symmetry (Basel)., vol. 12, no. 4, DOI: https://doi.org/10.3390/SYM12040651.
Lopes UK, Valiati JF (2017) Pre-trained convolutional neural networks as feature extractors for tuberculosis detection. Comput Biol Med 89(August):135–143. https://doi.org/10.1016/j.compbiomed.2017.08.001
Ma G, Li S, Chen C, Hao A, Qin H (2020) Stage-wise salient object detection in 360 omnidirectional image via object-level Semantical saliency ranking. IEEE Trans Vis Comput Graph 26:3535–3545. https://doi.org/10.1109/tvcg.2020.3023636
Ma J, Song Y, Tian X, Hua Y, Zhang R, Wu J (2020) Survey on deep learning for pulmonary medical imaging. Front Med 14(4):450–469. https://doi.org/10.1007/s11684-019-0726-4
Maas AL, Hannun AY, Ng AY (2013) Rectifier nonlinearities improve neural network acoustic models. In: The 30th International Conference on Machine Learning, vol 30
Masood A, Sheng B, Yang P, Li P, Li H, Kim J, Feng DD (2020) Automated decision support system for lung Cancer detection and classification via enhanced RFCN with multilayer fusion RPN. IEEE Trans Ind Inf 3203(c):1–1. https://doi.org/10.1109/tii.2020.2972918 7801
Mazurowski MA, Buda M, Saha A, Bashir MR (2019) Deep learning in radiology: an overview of the concepts and a survey of the state of the art with a focus on MRI. J Magn Reson Imaging 49(4):939–954. https://doi.org/10.1002/jmri.26534
Mcculloch WS, Pitts W (1943) A logical calculus of the ideas immanent in nervous activity. Bull Math Biophys 5:115–133. https://doi.org/10.1007/BF02478259
Minsky M, Papert S (1969) Perceptrons: an introduction to computational geometry, vol 522. MIT Press, Cambridge MA, pp 20–522. https://doi.org/10.1016/S0019-9958(70)90409-2
Mittal A, Hooda R, Sofat S (2018) LF-SegNet : a fully convolutional encoder – decoder network for segmenting lung fields from chest, Wirel Pers Commun, DOI: https://doi.org/10.1007/s11277-018-5702-9
Morris RGM, Hebb DO (1949) The Organization of Behavior, Wiley: New York; 1949,” Brain Res Bull, vol. 50, no. 5–6, p. 437, DOI: https://doi.org/10.1016/S0361-9230(99)00182-3.
Münzer B, Schoeffmann K, Böszörmenyi L (2018) Content-based processing and analysis of endoscopic images and videos: a survey. Multimed Tools Appl 77(1):1323–1362. https://doi.org/10.1007/s11042-016-4219-z
Murphy A, Skalski M, Gaillard F (2018) The utilisation of convolutional neural networks in detecting pulmonary nodules: a review. Br J Radiol 91(1090):1–6. https://doi.org/10.1259/bjr.20180028
Murphy K et al. (2019) Computer aided detection of tuberculosis on chest radiographs: An evaluation of the CAD4TB v6 system, pp. 1–11, [Online]. Available: http://arxiv.org/abs/1903.03349.
Nair V, Hinton GE (2010) Rectified linear units improve restricted Boltzmann machines. Proc 27th Int Conf Mach Learn (ICML-10), 807–814 33(5):807–814
Nakagawa K, Ishihara R, Aoyama K, Ohmori M (2019) Classification for invasion depth of esophageal squamous cell carcinoma using a deep neural network compared with experienced endoscopists. Gastrointest Endosc 90(3):407–414. https://doi.org/10.1016/j.gie.2019.04.245
Ng A (2011) Sparse autoencoder. CS294A Lect. Notes 72:1–19
Nie D, Trullo R, Lian J, Wang L, Petitjean C, Ruan S, Wang Q, Shen D (2018) Medical image synthesis with deep convolutional adversarial networks. IEEE Trans Biomed Eng 65(12):2720–2730. https://doi.org/10.1109/TBME.2018.2814538
Onishi Y et al. (2019) Automated Pulmonary Nodule Classification in Computed Tomography Images Using a Deep Convolutional Neural Network Trained by Generative Adversarial Networks, Biomed Res Int, vol. 2019, DOI: https://doi.org/10.1155/2019/6051939.
Ouyang W et al (2015) DeepID-Net: Deformable deep convolutional neural networks for object detection. Proc IEEE Comput Soc Conf Comput Vis Pattern Recognit 07–12(June):2403–2412. https://doi.org/10.1109/CVPR.2015.7298854
Ozturk T, Talo M, Yildirim EA, Baloglu UB, Yildirim O, Rajendra Acharya U (2020) Automated detection of COVID-19 cases using deep neural networks with X-ray images. Comput Biol Med 121(April):103792. https://doi.org/10.1016/j.compbiomed.2020.103792
Pang S, Zhang Y, Ding M, Wang X, Xie X (2020) A deep model for lung Cancer type identification by densely connected convolutional networks and adaptive boosting. IEEE Access 8:4799–4805. https://doi.org/10.1109/ACCESS.2019.2962862
Pascanu R, Mikolov T, Bengio Y (2013) On the difficulty of training recurrent neural networks. 30th Int Conf Mach Learn ICML 2013(PART 3):2347–2355
Perone CS, Cohen-Adad J (2019) Promises and limitations of deep learning for medical image segmentation. J Med Artif Intell 2:1–1. https://doi.org/10.21037/jmai.2019.01.01
Pezeshk A, Hamidian S, Petrick N, Sahiner B (2018) 3D convolutional neural networks for automatic detection of pulmonary nodules in chest CT. IEEE J Biomed Heal Inf PP(c):1. https://doi.org/10.1109/JBHI.2018.2879449
Pinckaers H, Litjens G (2019) Neural Ordinary Differential Equations for Semantic Segmentation of Individual Colon Glands, no. NeurIPS, [Online]. Available: http://arxiv.org/abs/1910.10470.
Poggio T, Serre T (2013) Models of visual cortex. Scholarpedia 8(4):3516. https://doi.org/10.4249/scholarpedia.3516
Qiang Y, Ge L, Zhao X, Zhang X, Tang X (2017) Pulmonary nodule diagnosis using dual-modal supervised autoencoder based on extreme learning machine. Expert Syst 34(6):1–12. https://doi.org/10.1111/exsy.12224
Qu H et al (2019) Joint Segmentation and fine -grained classification of nuclei in histopathology images. In: 2019 IEEE 16th International Symposium on Biomedical Imaging (ISBI 2019), pp 900–904. https://doi.org/10.1109/ISBI.2019.8759457
Rajaraman S, Antani SK (2020) Modality-specific deep learning model ensembles toward improving TB detection in chest radiographs. IEEE Access 8:27318–27326. https://doi.org/10.1109/ACCESS.2020.2971257
Rajaraman S, Antani S (2020) Weakly labeled data augmentation for deep learning: a study on COVID-19 detection in chest X-rays. Diagnostics 10(6):1–17. https://doi.org/10.3390/diagnostics10060358
Rajpurkar P, Irvin J, Ball RL, Zhu K, Yang B, Mehta H, Duan T, Ding D, Bagul A, Langlotz CP, Patel BN, Yeom KW, Shpanskaya K, Blankenberg FG, Seekins J, Amrhein TJ, Mong DA, Halabi SS, Zucker EJ, Ng AY, Lungren MP (2018) Deep learning for chest radiograph diagnosis: a retrospective comparison of the CheXNeXt algorithm to practicing radiologists. PLoS Med 15(11):1–17. https://doi.org/10.1371/journal.pmed.1002686
Rajpurkar P et al. (2017) CheXNet: Radiologist-Level Pneumonia Detection on Chest X-Rays with Deep Learning, pp. 3–9, [Online]. Available: http://arxiv.org/abs/1711.05225.
Reader AJ, Corda G, Mehranian A, da Costa-Luis C, Ellis S, Schnabel JA (2020) Deep learning for PET image reconstruction. IEEE Trans Radiat Plasma Med Sci 7311(1):1–1. https://doi.org/10.1109/trpms.2020.3014786 25
Ribli D, Horváth A, Unger Z, Pollner P, Csabai I (2018) Detecting and classifying lesions in mammograms with deep learning. Sci Rep 8(1):1–7. https://doi.org/10.1038/s41598-018-22437-z
Rodríguez-Ruiz A, Krupinski E, Mordang JJ, Schilling K, Heywang-Köbrunner SH, Sechopoulos I, Mann RM (2019) Detection of breast cancer with mammography: effect of an artificial intelligence support system. Radiology 290(3):1–10. https://doi.org/10.1148/radiol.2018181371
Ronneberger O, Fischer P, Brox T (2015) U-net: Convolutional networks for biomedical image segmentation. Lect Notes Comput Sci (including Subser Lect. Notes Artif Intell Lect Notes Bioinformatics) 9351:234–241. https://doi.org/10.1007/978-3-319-24574-4_28
Rosenblatt F (1958) The perceptron: a probabilistic model for information storage and organization in the brain. Psychol Rev 65(6):386–408. https://doi.org/10.1037/h0042519
Rumelhart DE, Hinton GE, Williams RJ (1986) Learning representations by back-propagating errors. Nature 323(9):533–536
Sabour S, Frosst N, Hinton GE (2017) Dynamic routing between capsules. Adv Neural Inf Process Syst 2017-Decem(Nips):3857–3867
Saeedan F, Weber N, Goesele M, Roth S (2018) Detail-Preserving Pooling in Deep Networks,” Proc IEEE Comput Soc Conf Comput Vis Pattern Recognit , no. June, pp. 9108–9116, DOI: https://doi.org/10.1109/CVPR.2018.00949.
Sahiner B, Heang-Ping Chan, Petrick N, Datong Wei, Helvie MA, Adler DD, Goodsitt MM (1996) Classification of mass and normal breast tissue: a convolution neural network classifier with spatial domain and texture images. IEEE Trans Med Imaging 15(5):598–610. https://doi.org/10.1109/42.538937
Sari CT, Gunduz-Demir C (2019) Unsupervised feature extraction via deep learning for Histopathological classification of Colon tissue images. IEEE Trans Med Imaging 38(5):1139–1149. https://doi.org/10.1109/TMI.2018.2879369
Scherer D, Müller A, Behnke S (2010) Evaluation of pooling operations in convolutional architectures for object recognition. Lect Notes Comput Sci (including Subser Lect Notes Artif Intell Lect Notes Bioinformatics) 6354 LNCS(PART 3):92–101. https://doi.org/10.1007/978-3-642-15825-4_10
Schmidhuber J (2015) Deep learning in neural networks: an overview. Neural Netw 61:85–117. https://doi.org/10.1016/j.neunet.2014.09.003
Serag A et al (2019) Translational AI and Deep Learning in Diagnostic Pathology. Front Med 6(October):1–15. https://doi.org/10.3389/fmed.2019.00185
Setio AAA, Ciompi F, Litjens G, Gerke P, Jacobs C, van Riel SJ, Wille MMW, Naqibullah M, Sanchez CI, van Ginneken B (2016) Pulmonary nodule detection in CT images: false positive reduction using multi-view convolutional networks. IEEE Trans Med Imaging 35(5):1160–1169. https://doi.org/10.1109/TMI.2016.2536809
Shah A, Kadam E, Shah H, Shinde S, Shingade S (2016) Deep residual networks with exponential linear unit. ACM Int Conf Proceeding Ser 21–24(Sept):59–65. https://doi.org/10.1145/2983402.2983406
Shatnawi A, Al-Bdour G, Al-Qurran R, Al-Ayyoub M (2018) A comparative study of open source deep learning frameworks. 2018 9th Int Conf Inf Commun Syst ICICS 2018 2018-Janua:72–77. https://doi.org/10.1109/IACS.2018.8355444
Shen L, Margolies LR, Rothstein JH, Fluder E, McBride R, Sieh W (2019) Deep learning to improve breast Cancer detection on screening mammography. Sci Rep 9(1):1–13. https://doi.org/10.1038/s41598-019-48995-4
Shickel B, Tighe PJ, Bihorac A, Rashidi P (2017) Deep EHR : A Survey of Recent Advances in Deep Learning Techniques for Electronic Health Record, vol. 2194, no. c, pp. 1–17, DOI: https://doi.org/10.1109/JBHI.2017.2767063.
Shin HC, Roth HR, Gao M, Lu L, Xu Z, Nogues I, Yao J, Mollura D, Summers RM (2016) Deep convolutional neural networks for computer-aided detection: CNN architectures, dataset characteristics and transfer learning. IEEE Trans Med Imaging 35(5):1285–1298. https://doi.org/10.1109/TMI.2016.2528162
Siegel RL, Miller KD, Jemal A (2019) Cancer statistics, 2019. CA Cancer J Clin 69(1):7–34. https://doi.org/10.3322/caac.21551
Simonyan K, Zisserman (2015) A Very deep convolutional networks for large-scale image recognition. In: 3rd International Conference on Learning Representations, ICLR 2015, pp 1–14
Soffer S, Ben-Cohen A, Shimon O, Amitai MM, Greenspan H, Klang E (2019) Convolutional neural networks for radiologic images: a Radiologist’s guide. Radiology 290(3):590–606. https://doi.org/10.1148/radiol.2018180547
Soffer S, Klang E, Shimon O, Nachmias N, Eliakim R (2020) Deep learning for wireless capsule endoscopy : a systematic review and meta-analysis. Gastrointest Endosc 92(4):831–839.e8. https://doi.org/10.1016/j.gie.2020.04.039
Song TH, Sanchez V, Eidaly H, Rajpoot NM (2019) Simultaneous cell detection and classification in bone marrow histology images. IEEE J Biomed Heal Inf 23(4):1469–1476. https://doi.org/10.1109/JBHI.2018.2878945
Song Y, Tan EL, Jiang X, Cheng JZ, Ni D, Chen S, Lei B, Wang T (2017) Accurate cervical cell segmentation from overlapping clumps in pap smear images. IEEE Trans Med Imaging 36(1):288–300. https://doi.org/10.1109/TMI.2016.2606380
Souza JC, Bandeira Diniz JO, Ferreira JL, França da Silva GL, Corrêa Silva A, de Paiva AC (2019) An automatic method for lung segmentation and reconstruction in chest X-ray using deep neural networks. Comput Methods Prog Biomed 177:285–296. https://doi.org/10.1016/j.cmpb.2019.06.005
Sun M, Zhang G, Dang H, Qi X, Zhou X, Chang Q (2019) Accurate gastric Cancer segmentation in digital pathology images using deformable convolution and multi-scale embedding networks. IEEE Access 7:75530–75541. https://doi.org/10.1109/ACCESS.2019.2918800
Swersky K, Chen B, Marlin B, de Freitas N (2010) A tutorial on stochastic approximation algorithms for training restricted Boltzmann machines and deep belief nets,” 2010 Inf Theory Appl Work ITA 2010, Conf Proc, pp. 80–89, DOI: https://doi.org/10.1109/ITA.2010.5454138.
Szegedy C, Reed S, Sermanet P, Vanhoucke V, Rabinovich A (2015) Going deeper with convolutions. In: The IEEE conference on Computer Vision and Pattern Recognition (CVPR), pp 1–9. https://doi.org/10.1109/CVPR.2015.7298594
Tabibu S, Vinod PK, Jawahar CV (2019) Pan-renal cell carcinoma classification and survival prediction from histopathology images using deep learning. Sci Rep 9(1):1–9. https://doi.org/10.1038/s41598-019-46718-3
The Theano Development Team et al. (2016) Theano: A Python framework for fast computation of mathematical expressions, pp. 1–19, [Online]. Available: http://arxiv.org/abs/1605.02688.
Valkonen M, Isola J, Ylinen O, Muhonen V, Saxlin A, Tolonen T, Nykter M, Ruusuvuori P (2020) Cytokeratin-supervised deep learning for automatic recognition of epithelial cells in breast cancers stained for ER, PR, and Ki-67. IEEE Trans Med Imaging 39(2):534–542. https://doi.org/10.1109/TMI.2019.2933656
Valliani AAA, Ranti D, Oermann EK (2019) Deep learning and neurology: a systematic review. Neurol Ther 8(2):351–365. https://doi.org/10.1007/s40120-019-00153-8
Van Eycke YR, Balsat C, Verset L, Debeir O, Salmon I, Decaestecker C (2018) Segmentation of glandular epithelium in colorectal tumours to automatically compartmentalise IHC biomarker quantification: a deep learning approach. Med Image Anal 49:35–45. https://doi.org/10.1016/j.media.2018.07.004
van Ginneken B, Setio AAA, Jacobs C, Ciompi F (2015) Off-the-shelf convolutional neural network features for pulmonary nodule detection in computed tomography scans. In: 2015 IEEE 12th International Symposium on Biomedical Imaging (ISBI), pp 286–289. https://doi.org/10.1109/ISBI.2015.7163869
Vedaldi A, Lenc K (2015) MatConvNet: Convolutional neural networks for MATLAB, MM 2015 – Proc 2015 ACM Multimed Conf, pp. 689–692, DOI: https://doi.org/10.1145/2733373.2807412.
Vincent P, Larochelle H, Lajoie I, Bengio Y, Manzagol PA (2010) Stacked denoising autoencoders: learning useful representations in a deep network with a local Denoising criterion. J Mach Learn Res 11:3371–3408
Waheed A, Goyal M, Gupta D, Khanna A, Al-Turjman F, Pinheiro PR (2020) CovidGAN: data augmentation using auxiliary classifier GAN for improved Covid-19 detection. IEEE Access 8:91916–91923. https://doi.org/10.1109/ACCESS.2020.2994762
Wang J, Ding H, Bidgoli FA, Zhou B, Iribarren C, Molloi S, Baldi P (2017) Detecting cardiovascular disease from mammograms with deep learning. IEEE Trans Med Imaging 36(5):1172–1181. https://doi.org/10.1109/TMI.2017.2655486
Wang SH, Muhammad K, Hong J, Sangaiah AK, Zhang YD (2020) Alcoholism identification via convolutional neural network based on parametric ReLU, dropout, and batch normalization. Neural Comput & Applic 32(3):665–680. https://doi.org/10.1007/s00521-018-3924-0
Wang H, Raj B (2017) On the Origin of Deep Learning,” pp. 1–72, [Online]. Available: http://arxiv.org/abs/1702.07800.
Wang S, Tang C, Sun J, Zhang Y (2019) Cerebral micro-bleeding detection based on densely connected neural network. Front Neurosci 13(MAY):1–11. https://doi.org/10.3389/fnins.2019.00422
Wang L, Wong A (2020) COVID-Net: A Tailored Deep Convolutional Neural Network Design for Detection of COVID-19 Cases from Chest X-Ray Images, pp. 1–12, [Online]. Available: http://arxiv.org/abs/2003.09871.
Wang Y, Yan F, Lu X, Zheng G, Zhang X, Wang C, Zhou K, Zhang Y, Li H, Zhao Q, Zhu H, Chen F, Gao C, Qing Z, Ye J, Li A, Xin X, Li D, Wang H, Yu H, Cao L, Zhao C, Deng R, Tan L, Chen Y, Yuan L, Zhou Z, Yang W, Shao M, Dou X, Zhou N, Zhou F, Zhu Y, Lu G, Zhang B (2019) IILS: intelligent imaging layout system for automatic imaging report standardization and intra-interdisciplinary clinical workflow optimization. EBioMedicine 44:162–181. https://doi.org/10.1016/j.ebiom.2019.05.040
Wang X et al (2019) Weakly Supervised Deep Learning for Whole Slide Lung Cancer Image Analysis. IEEE Trans Cybern PP:1–13. https://doi.org/10.1109/tcyb.2019.2935141
Wang T et al (2020) Machine learning in quantitative PET: A review of attenuation correction and low-count image reconstruction methods. Phys Medica 76(March):294–306. https://doi.org/10.1016/j.ejmp.2020.07.028
Wei JW, Tafe LJ, Linnik YA, Vaickus LJ, Tomita N, Hassanpour S (2019) Pathologist-level classification of histologic patterns on resected lung adenocarcinoma slides with deep neural networks. Sci Rep 9(1):1–8. https://doi.org/10.1038/s41598-019-40041-7
Werbos PJ (1990) Backpropagation through time: what it does and how to do it. Proc IEEE 78(10):1550–1560. https://doi.org/10.1109/5.58337
Werbose J (1974) Beyond regression: new tools for prediction and analysis in the behavioral
Widrow B, Hoff ME (1962) Associative Storage and Retrieval of Digital Information in Networks of Adaptive ‘Neurons. Biol Prototypes Synth Syst:160–160. https://doi.org/10.1007/978-1-4684-1716-6_25
Williams RJ, David Z (1995) Gradient-based learning algorithms for recurrent networks and their computational complexity. In: Back-propagation: theory, architectures and applications. L. Erlbaum Associates Inc, pp 433–486
Wu J (2017) Convolutional Neural Networks. Med Imaging Inf Sci 34(2):109–111. https://doi.org/10.11318/mii.34.109
Wu H, Gu X (2015) Max-pooling dropout for regularization of convolutional neural networks. Lect Notes Comput Sci (including Subser Lect Notes Artif Intell Lect Notes Bioinformatics) 9489:46–54. https://doi.org/10.1007/978-3-319-26532-2_6
Wu N, Phang J, Park J, Shen Y, Huang Z, Zorin M, Jastrzebski S, Fevry T, Katsnelson J, Kim E, Wolfson S, Parikh U, Gaddam S, Lin LLY, Ho K, Weinstein JD, Reig B, Gao Y, Toth H, Pysarenko K, Lewin A, Lee J, Airola K, Mema E, Chung S, Hwang E, Samreen N, Kim SG, Heacock L, Moy L, Cho K, Geras KJ (2019) Deep neural networks improve radiologists’ performance in breast Cancer screening. IEEE Trans Med Imaging 39:1–1. https://doi.org/10.1109/tmi.2019.2945514 1194
Wu N et al (2018) Breast density classification with deep convolutional neural networks. ICASSP, IEEE Int Conf Acoust Speech Signal Process - Proc 2018-April:6682–6686. https://doi.org/10.1109/ICASSP.2018.8462671
Xing F, Xie Y, Su H, Liu F, Yang L (2018) Deep learning in microscopy image analysis: a survey. IEEE Trans Neural Netw Learn Syst 29(10):4550–4568. https://doi.org/10.1109/TNNLS.2017.2766168
Xing F, Xie Y, Yang L (2016) An automatic learning-based framework for robust nucleus segmentation. IEEE Trans Med Imaging 35(2):550–566. https://doi.org/10.1109/TMI.2015.2481436
Xu B, Wang N, Chen T, Li M (2015) Empirical Evaluation of Rectified Activations in Convolutional Network , [Online]. Available: http://arxiv.org/abs/1505.00853.
Xu S, Wu H, Bie R (2019) CXNet-m1: anomaly detection on chest X-rays with image-based deep learning. IEEE Access 7(c):4466–4477. https://doi.org/10.1109/ACCESS.2018.2885997
Xu J, Xiang L, Liu Q, Gilmore H, Wu J, Tang J, Madabhushi A (2016) Stacked sparse autoencoder (SSAE) for nuclei detection on breast cancer histopathology images. IEEE Trans Med Imaging 35(1):119–130. https://doi.org/10.1109/TMI.2015.2458702
Yi X, Walia E, Babyn P (2019) Generative adversarial network in medical imaging: A review,” Med Image Anal, vol. 58, DOI: https://doi.org/10.1016/j.media.2019.101552.
Yi F, Yang L, Wang S, Guo L, Huang C, Xie Y, Xiao G (2018) Microvessel prediction in H&E Stained Pathology Images using fully convolutional neural networks. BMC Bioinform 19(1):1–9. https://doi.org/10.1186/s12859-018-2055-z
Yoon HJ et al (2019) A Lesion-Based Convolutional Neural Network Improves Endoscopic Detection and Depth Prediction of Early Gastric Cancer. J Clin Med 8(9):1310. https://doi.org/10.3390/jcm8091310
Yu D et al (2014) An Introduction to Computational Networks and the Computational Network Toolkit. INTERSPEECH, Microsoft Research
Zhang S, Zhang S, Wang B, Habetler TG (2020) Deep learning algorithms for bearing fault diagnostics - a comprehensive review. IEEE Access 8:29857–29881. https://doi.org/10.1109/ACCESS.2020.2972859
Zhang X et al (2017) Whole mammogram image classification with convolutional neural networks. Proc - 2017 IEEE Int Conf Bioinforma Biomed BIBM 2017 2017-Janua(Cc):700–704. https://doi.org/10.1109/BIBM.2017.8217738
Zhao Q, Lyu S, Zhang B, Feng W (2018) Multiactivation pooling method in convolutional neural networks for image recognition. Wirel Commun Mob Comput 2018:1–16. https://doi.org/10.1155/2018/8196906
Zhao W, Zeng Z (2019) Multi Scale Supervised 3D U-Net for Kidney and Tumor Segmentation,, DOI: https://doi.org/10.24926/548719.007.
Author information
Authors and Affiliations
Corresponding author
Additional information
Publisher’s note
Springer Nature remains neutral with regard to jurisdictional claims in published maps and institutional affiliations.
Rights and permissions
About this article

Cite this article
Puttagunta, M., Ravi, S. Medical image analysis based on deep learning approach. Multimed Tools Appl 80, 24365–24398 (2021). https://doi.org/10.1007/s11042-021-10707-4
Received:
Revised:
Accepted:
Published:
Issue Date:
DOI: https://doi.org/10.1007/s11042-021-10707-4