
Abstract
As losses from natural disasters steadily increase, communities search for ways to increase resilience. Northern Australia strengthened their wind codes in 1980 after Tropical Cyclone Tracy devastated Darwin and recommendations from engineers in Queensland, Australia suggest further enhancements. Florida, United States Of America (US) also enacted stronger building codes after the devastation brought by Hurricane Andrew as a way to limit future windstorm losses. This study uses the case study of Florida to develop understanding of the economic effectiveness of wind-enhanced building codes across regions of varying wind risk. Realized insured loss data are used to examine the effect of the Florida Building Code (FBC) on windstorm losses. Further, we analyze the effectiveness of the FBC in different regions within the state. We find that overall the FBC passes a benefit/cost test with the exception of the use of a higher cost option for impact protection. Our results suggest that wind code changes in other regions, such as those recommended for the Australian wind code, would also be cost-effective. Finally, potential changes in wind speed from hurricanes due to climate change increase the cost-effectiveness of actions that mitigate the damage from wind storms.


Notes
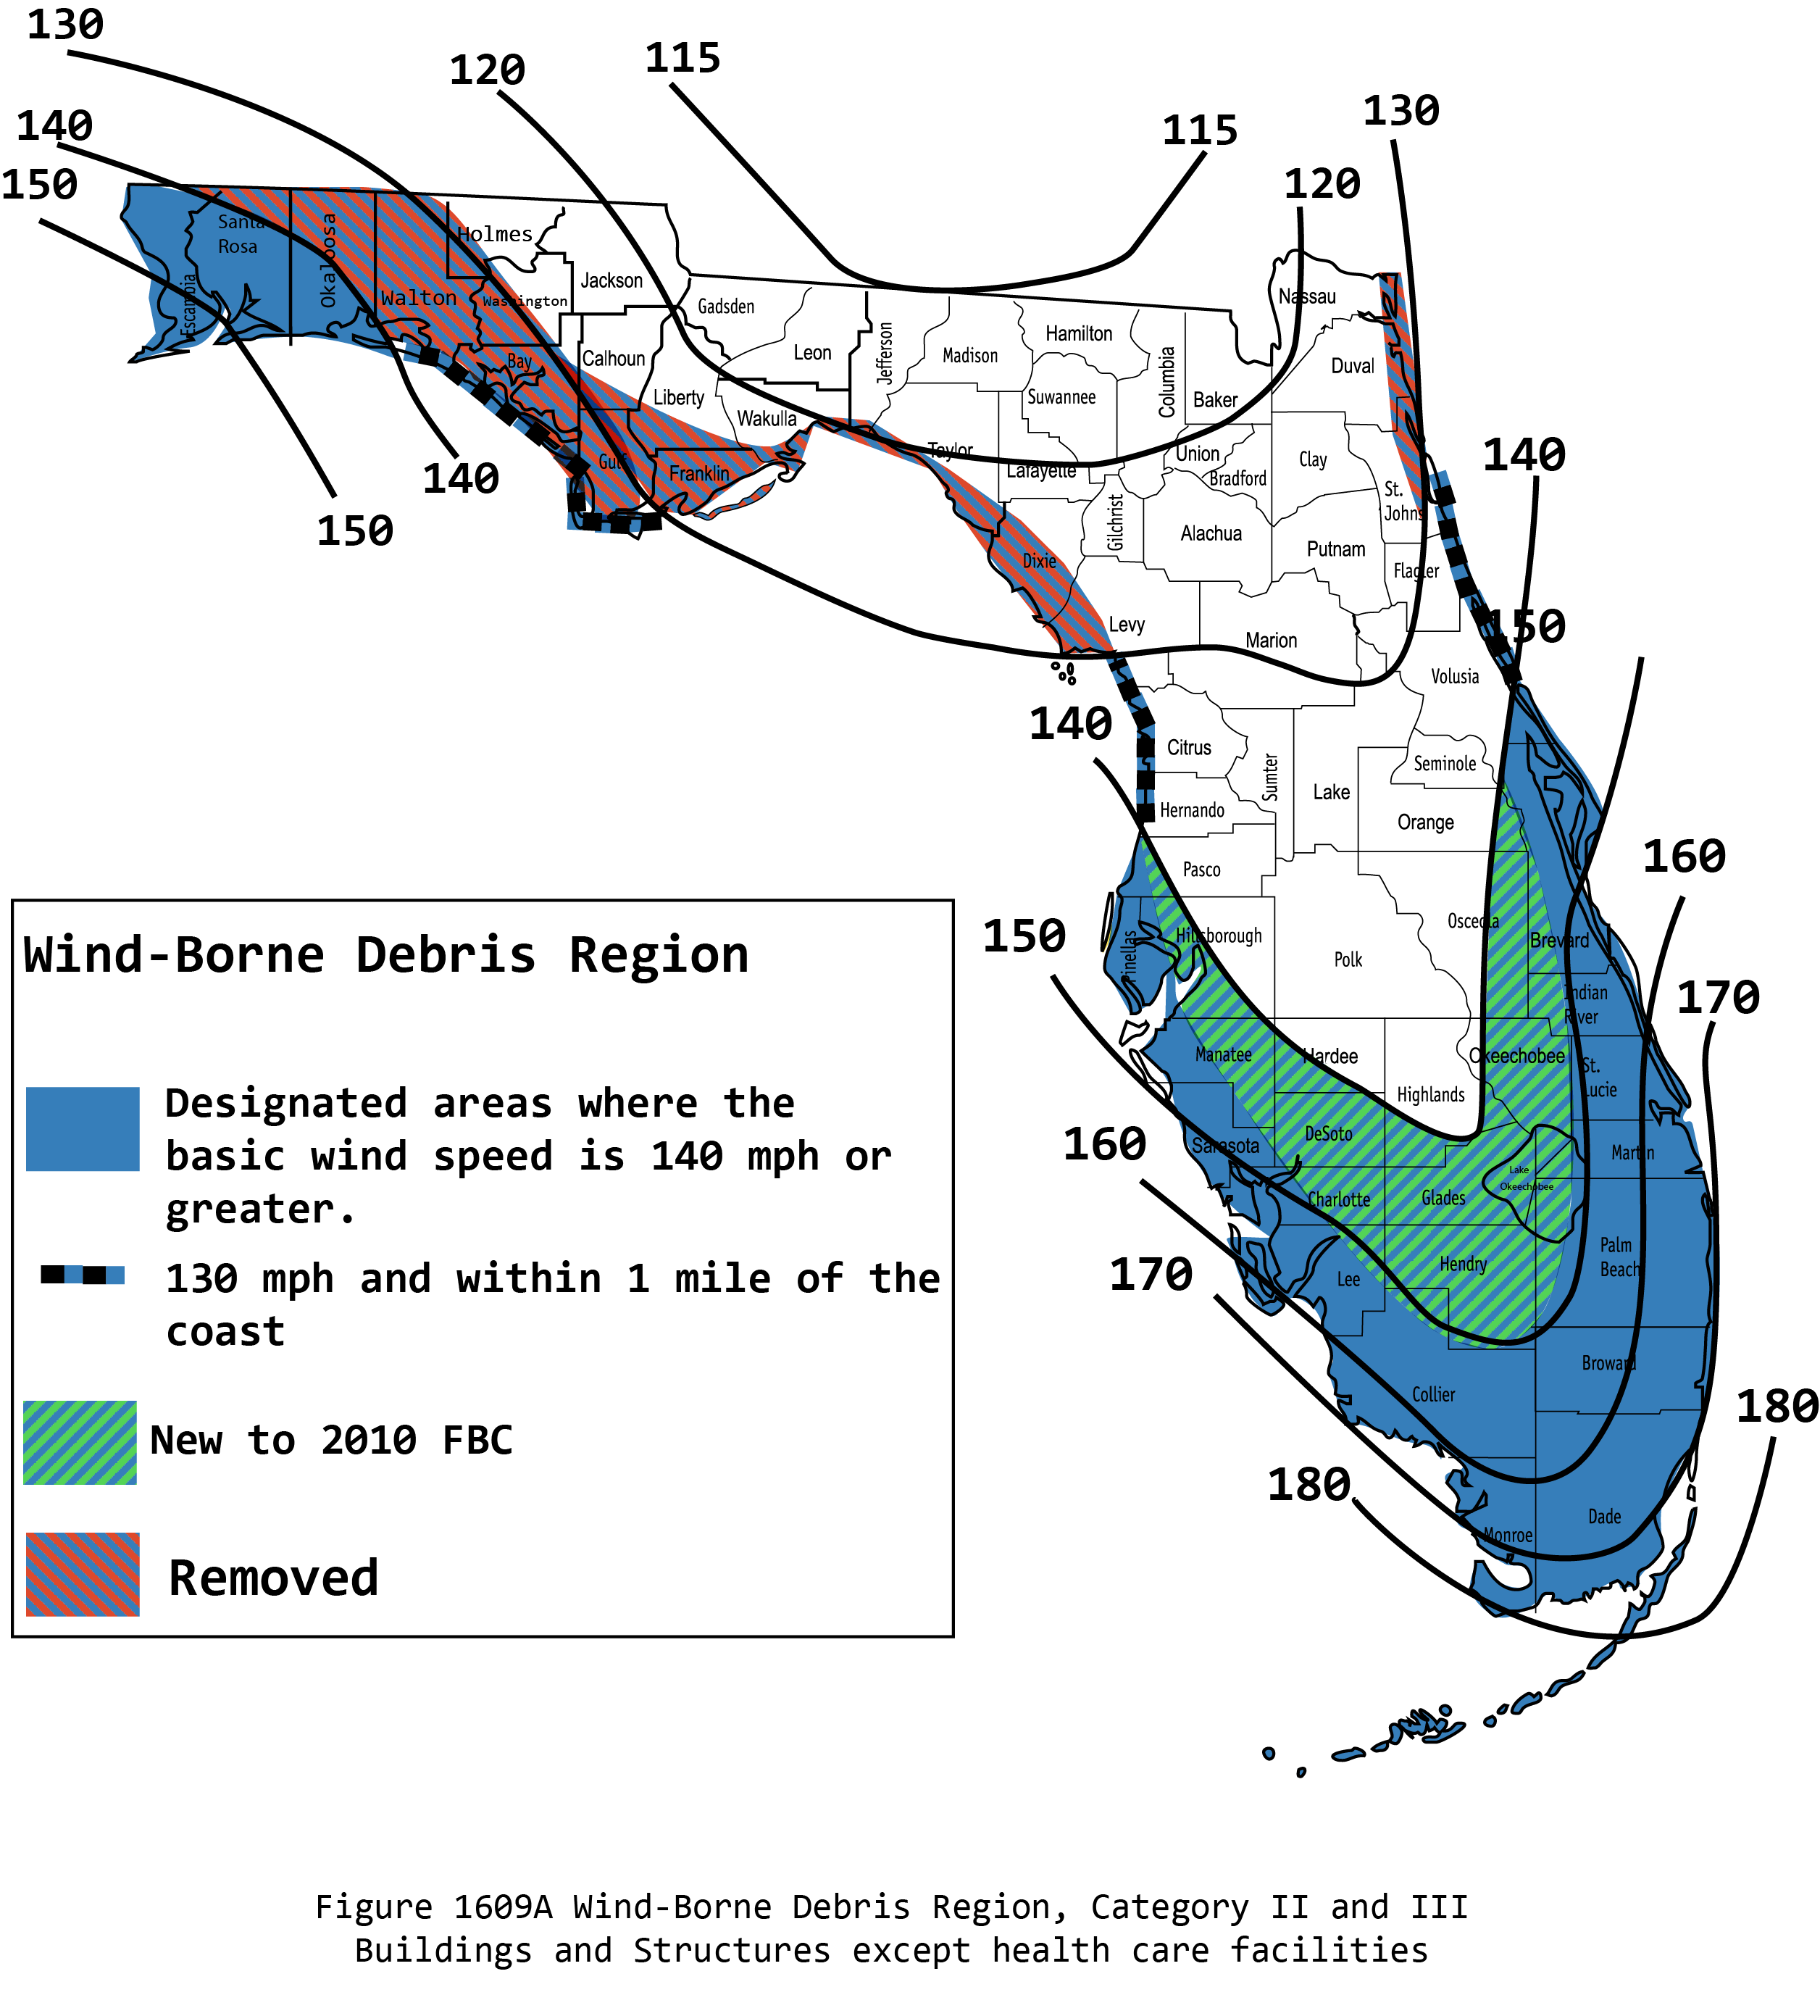
A state provided map of the region can be found here: http://www.floridabuilding.org/fbc/Wind_2010/figurea_colors8.png.
More explanation of the protection of openings can be found in Section R.301.2.1.2 of the Florida Building Code. Available online at: http://floridabuilding2.iccsafe.org/app/book/toc/2014/Florida/Residential%20Code/index.html.
Insurance Council of Australia, http://www.icadataglobe.com/access-catastrophe-data/.
The statewide estimate of added cost uses the covered option of the WBDR.
We use Census aged estimates for home size. Census estimates are regional and we are using the South region. However, we compared those estimates to Zillow for Florida over the last 5 years and found them to be almost identical.
A more detailed discussion of our loss data is provided in the next section.
Earned House Years is an insurance industry term to denote the number of customers by year or year part.
A full description of our wind hazard data is in the Appendix.
A more detailed discussion of the regression results along with tables containing results from each model are included in the Appendix.
Norman, OK, is one example based on personal communication.
References
Applied Research Associates, Inc. (2002). Florida building code cost and loss reduction benefit comparison study
ASCE. (2013). Minimum design loads for buildings and other structures. ASCE/SEI 7-10. 1801 Alexander Bell Drive, Reston, Virginia 20191
Crompton RP, McAneney KJ (2008) Normalised Australian insured losses from meteorological hazards: 1967–2006. Environ Sci Pol 11(5):371–378
Czajkowski J, Done J (2014) As the wind blows? Understanding hurricane damages at the local level through a case study analysis. Wea. Clim. Soc 6(2):202–217. https://doi.org/10.1175/WCAS-D-13-00024.1
Dehring CA, Halek M (2013) Coastal building codes and hurricane damage. Land Econ 89(4):597–613
Dixon R (2009). Florida building commission presentation. Available at - http://www.sbafla.com/method/portals/methodology/WindstormMitigationCommittee/2009/20090917_DixonFLBldgCode.pdf
Done JM, Owens B (2017) Tropical cyclones. In: Mitchell-Wallace K, Jones M, Hillier J, Foote M (eds) Natural catastrophe risk management and modelling: a practitioner’s guide. Wiley-Blackwell, Hoboken
Done JM, Holland GJ, Bruyère CL, Leung LR, Suzuki-Parker A (2015) Modeling high-impact weather and climate: lessons from a tropical cyclone perspective. Clim Chang 129(3–4):381–395. https://doi.org/10.1007/s10584-013-0954-6
Emanuel K (2011) Global warming effects on U.S. hurricane damage. Wea Clim Soc 3:261–268
Englehardt JD, Peng C (1996) A Bayesian benefit-risk model applied to the South Florida Building Code. Risk Anal 16(1):81–91
Florida Catastrophic Storm Risk Management Center, 2013. The State of Florida’s Property Insurance Market 2nd Annual Report Released January 2013 for the Florida Legislature. Available from http://www.stormrisk.org/sites/default/files/2nd%20Annual%20Insurance%20Market%20Rpt-FSU%20Storm%20Risk%20Center.pdf
Frank WM, Young GS (2007) The interannual variability of tropical cyclones. Mon Wea Rev 135:3587–3598
Geoscience Australia (2018) http://www.ga.gov.au/interactive-maps/#/theme/hazards/map/windhazards Accessed March 6, 2018
Ginger J, Henderson D, Edwards M, and Holmes J (2010). Housing damage in windstorms and mitigation for Australia: 1-18, Working Paper
Greene W (2003) Econometric analysis, 5th edn. Prentice Hall, Upper Saddle River, NJ
Hallegate S (2007) The use of synthetic hurricane tracks in risk analysis and climate change damage assessment. J Appl Met Clim 46:1956–1966
Hamid SS, Pinelli J-P, Chen S-C, Gurley K (2011) Catastrophe model-based assessment of hurricane risk and estimates of potential insured losses for the state of Florida. Nat Hazards Rev 12(4):171–176
Heckman J (1976) The common structure of statistical models of truncation, sample selection and limited dependent variables and a simple estimator for such models. Ann Econ Soc Meas 5(4):475–492
Heckman J (1979) Sample selection as a specification error. Econometrica 47(1):153–161
Insurance Institute for Business and Home Safety (IBHS) (2004). Hurricane Charley executive summary. Available at http://disastersafety.org/wp-content/uploads/hurricane_charley.pdf. (last accessed, February 10, 2016)
Insurance Institute for Business and Home Safety (IBHS) (2015). New IBHS report rates building codes in 18 coastal states. Available at https://disastersafety.org/ibhs-news-releases/new-ibhs-report-rates-building-codes-18-coastal-states/ (last accessed, February 10, 2016).
Jain V 2010: The role of wind duration in damage estimation. AIR Currents, 4 pp. [Available online at http://www.air-worldwide.com/Publications/AIR-Currents/attachments/AIRCurrents–The-Role-of-Wind-Duration-in-Damage-Estimation/
Laprise R, de Elía R, Caya D, Biner S, Lucas-Picher P, Diaconescu EP, Leduc M, Alexandru A, Separovic L (2008) Challenging some tenets of regional climate modeling. Meteorog Atmos Phys 100(1–4):3–22
Mendelsohn R, Emanuel K, Chonabayashi S, Bakkensen L (2012) The impact of climate change on global tropical cyclone damage. Nature Clim Change 2:205–209. https://doi.org/10.1038/nclimate1357
Mesinger F et al (2006) North American regional reanalysis. Bull Amer Meteor Soc 87:343–360. https://doi.org/10.1175/BAMS-87-3-343
NARR 2015: National Centers for Environmental Prediction/National Weather Service/NOAA/U.S. Department of Commerce. 2005, updated monthly. NCEP North American Regional Reanalysis (NARR). Research Data Archive at the National Center for Atmospheric Research, Computational and Information Systems Laboratory. http://rda.ucar.edu/datasets/ds608.0/. Accessed 22 May 2015
Pielke RAJ (2007) Future economic damage from tropical cyclones: sensitivities to societal and climate changes. Philos Trans R Soc 365:1–13
Simmons KM, Kruse JB (2000) Market value and perceived risk: empirical results, J of Economics, Vol 26, No 1, Summer 2000
Simmons KM, Kovacs P, Kopp G (2015) Tornado damage mitigation: benefit/cost analysis of enhanced building codes in Oklahoma, Wea. Clim. Soc, April, 2015
Simmons KM, Czajkowski J, Done J (2018) Economic effectiveness of implementing a statewide building code: the case of Florida. Land Economics forthcoming
Stewart MG (2015) Risk and economic viability of housing climate adaptation strategies for wind hazards in Southeast Australia. Mitig Adapt Strateg Glob Change 20(4):601–622
Stewart MG, Wang X, and Willgoose GR (2012) Direct and indirect cost and benefit assessment of climate adaptation strategies for extreme wind events in Queensland, CSIRO Climate Adaptation Flagship, Canberra
Stewart MG, Wang X, and Willgoose GR (2014) Indirect and direct cost and benefit assessment of climate adaptation strategies for extreme wind events in Queensland, Nat. Hazards Rev., Vol. 15, No. 4, November 2014.
Tye MR, Stephenson DB, Holland GJ, Katz RW (2014) A Weibull approach for improving climate model projections of tropical cyclone wind-speed distributions. J Clim 27:6119–6133
Walsh KJE, McBride JL, Klotzbach PJ, Balachandran S, Camargo SJ, Holland G, Knutson TR, Kossin JP, Lee TC, Sobel A, Sugi M (2016) Tropical cyclones and climate change. WIREs Climate Change 7:65–89. https://doi.org/10.1002/wcc371.
Zhai AR, Jiang JH (2014) Dependence of US hurricane economic loss on maximum wind speed and storm size. Environmental Res Letters 9(6):064019
Acknowledgements
The authors would like to acknowledge the assistance of the Insurance Services Office, the Florida Department of Emergency Management, and Florida International University for the data and research support. The National Center for Atmospheric Research is sponsored by the National Science Foundation.
Author information
Authors and Affiliations
Corresponding author
Appendix
Appendix
1.1 Florida windstorm values 2001 to 2010
Spatial wind hazard data over Florida from 2001 to 2010 are sourced from the National Center for Environmental Prediction’s (NCEP) North American Regional Reanalysis (NARR 2015; Mesinger et al. 2006). NARR is a dynamically consistent historical climate dataset based on historical climate observations. Data are available 3-hourly on a 32-km grid and interpolated here to the postal code level. Of importance to this study Mesinger et al. (2006) showed that the winds just above the surface compare well with surface station observations. The 32-km grid captures hurricanes and other large-scale wind events but is too coarse to resolve high-impact small-scale features in the wind field such as thunderstorm winds or tornadoes. We therefore restrict this study to wind damage from large-scale weather phenomena such as hurricanes which were the major hazard drivers of damage over the period 2001–2010 (with 18 TCs affecting Florida in this period). Although the dataset captures hurricanes, it fails to capture the peak intensity of the strongest hurricanes (as discussed in Done et al. 2015). Rather than downscaling the NARR data to obtain these small-scale details using dynamical (e.g., Laprise et al. 2008) or statistical (e.g., Tye et al. 2014) methods (that could introduce further uncertainties), we choose to sacrifice the small-scale details of the wind field and peak hurricane intensity for location accuracy of the NARR data. To account for these missing wind extremes, all wind speed values are normalized by the maximum value of wind speed in the dataset.
A comparison of these normalized wind speed data to the design wind speed is possible by similarly normalizing the design wind speed by the maximum value across Florida. This normalization procedure removes the effects of differences in the durations over which maximum wind speeds are defined and differences in the overall wind speed intensity distributions. Figure 6 shows a comparison of maximum wind speed distributions over the WBDR and N-WBDR between the period 2001 and 2010 and the design wind speed. Whereas the design wind speed shows a clear separation between the WBDR and the N-WBDR (Fig. 6, top row) with the mean wind speed in the N-WBDR at 85% of the WBDR mean, there are no significant differences between regions using the period 2001–2010 (Fig. 6, bottom row). This period is therefore too short to sample the extreme winds resulting in the design wind distributions and therefore does not capture the long-term difference in hazard between the regions. More importantly the wind speeds in the period 2001–2010 are 16% closer to the design speeds for the N-WBDR than for the WBDR (not shown). This has implications for the BCA analysis split by wind borne region. Winds farther from the design wind speed in the WBDR than in the N-WBDR may cause the FBC to be less cost-effective in the WBDR than it otherwise would be under a longer period with winds closer to the design winds.

Distributions of (top) design wind speed and (bottom) maximum wind speed over the period 2001–2010, for (left) WBDR and (right) N-WBDR. All winds have been normalized by the maximum value. Mean values are indicated in each plot
1.2 Expanded discussion of regression results
We present our results by N-WBDR, WBDR and the whole state. Beginning in the 1950s Miami-Dade County independently adopted the South Florida Building Code (SFBC), followed by Broward County in the 1970sFootnote 17 and Monroe County soon after. Miami-Dade, Broward, and Monroe are all in the WBDR but having adopted the SFBC prior to the implementation of the FBC the cost of construction to meet the FBC did not change. We removed those counties so we can obtain the effect of the FBC for areas in the WBDR that did not adopt the SFBC earlier.
To estimate how the FBC affected losses, we first provide an estimate of the reduction in losses for each strata, N-WBDR, WBDR, and the state. Table 8 provides regression results for the model using all observations (full loss reduction) and Table 9 provides the regression results from the second stage (direct loss reduction) of the hurdle model for the stratified regression. Table 10 provides the loss reduction percent for each region and for the direct and full regression results.
The N-WBDR shows the highest reduction in wind losses from the FBC. In the full model (Table 10), losses are shown to decrease an average of 81% while direct loss is reduced by 57%. The WBDR zone shows lower reduced losses, a reduction of 64% from the full model and 32% in direct loss reduction. Statewide, the full model shows a 72% reduction and the direct model, 53%.
1.3 Sensitivity analysis
Our BCA has used the average added cost of construction and the average loss reduction that can be expected. To test the sensitivity of our BCA, we now examine what happens to the BCA, with deductibles, using the full range of increased costs plus the full range of expected loss reduction.
1.3.1 Full range of added cost and split of WBDR by window resistance type
Here, in addition to the average added cost of construction, we use the full range of estimated costs from Applied Research Associates (ARA 2002). Table 1 in Section 3 shows the minimum added cost per square foot, the maximum added cost per square foot, and the average between the two that has been used until now. Using this full range of estimated costs, in Table 11, we provide the BCA, for the state, the N-WBDR, and both options within the WBDR. For this table, we focus on the range of BCA using losses with deductibles.
Even using the highest estimate of added construction cost, the N-WBDR continues to be a cost-effective policy regardless of the estimated reduction in loss. The same is true for the lower cost option for impact protection while the higher cost of using impact-resistant glazing in the WBDR does attain cost-effectiveness in the lower end of the cost range, but quickly loses that effectiveness as estimated costs rise and the estimated reduction in loss decreases.
1.3.2 Damage reduction confidence interval
We now examine what happens to the BCA when we use the 95% confidence interval on the parameter estimate for the estimated reduction in loss from the FBC. Again, we use losses including an estimate for deductibles and return to using the average cost of construction. Table 12 shows the result.
Both the N-WBDR and lower cost option for the WBDR continue to show cost-effectiveness for the FBC. The higher cost option, glazed impact protection, for the WBDR does clear the BCA, barely, for all but one of the possible scenarios but only reaches a BCA of 2 in two of the six scenarios for that option.
1.3.3 Worst-case scenario
Finally, we perform a sensitivity analysis assuming the worst-case scenario for all variables we are considering, cost of construction, and the percent of loss that can be reduced. So we use the highest estimate of increased cost and the lowest level of the confidence interval for the estimate of reduced loss from our statistical model. Further, we remove the adjustment for deductibles and focus solely on the direct reduction in loss that might be achieved. Table 13 shows these results.
Even with this worst-case scenario, we see that the N-WBDR continues to be cost-effective. The WBDR, however, is no longer cost-effective.
Rights and permissions
About this article

Cite this article
Simmons, K.M., Czajkowski, J. & Done, J.M. Building code economic performance under variable wind risk. Mitig Adapt Strateg Glob Change 24, 235–258 (2019). https://doi.org/10.1007/s11027-018-9808-x
Received:
Accepted:
Published:
Issue Date:
DOI: https://doi.org/10.1007/s11027-018-9808-x