
Abstract
Objectives
We analyze the contribution of changes in the black–white racial disparity in imprisonment to changes in the black incarceration rate. We also describe the behavior of the racial disparity across states and across time.
Methods
We use state level incarceration data for non-Hispanic black and white males to perform a decomposition of the black incarceration rate. This allows us to attribute changes in black incarceration to changes in the racial disparity and changes in the overall incarceration rate. We use a Fourier approximation to identify structural change points for the racial disparity at both the state and national level.
Results
The large increase in black imprisonment between 1978 and 1999 was driven by increases in the overall rate of imprisonment, while the smaller decrease which occurred between 1999 and 2014 was driven by reductions in the black–white racial disparity. For many states, the racial disparity increased starting in the mid-1980s, where this increase may have been linked to the crack epidemic. Many states experienced a downturn in the racial disparity starting in the 1990s. Whatever its other effects, this suggests that the 1994 crime bill did not aggravate the preexisting racial disparity in imprisonment. California’s experience has been strongly counter to national trends with a large increase in the racial disparity beginning in the early 1990s and continuing until near the end of our sample.
Conclusion
While the racial disparity in imprisonment has been falling since 1996, it remains quite high as of 2014. Future work is required to better understand the policy determinants of this disparity.

Sources: National Prisoner Statistics (NPS), compiled by the Bureau of Justice Statistics. FBI, Uniform Crime Reports, prepared by the National Archive of Criminal Justice Data
Notes
The Institute for Criminal Policy Research lists Seychelles as having a higher imprisonment rate than the United States. You can view their ranking at http://www.prisonstudies.org/highest-to-lowest/prison_population_rate?field_region_taxonomy_tid=All.
Our analysis throughout focuses on the imprisonment rates of non-Hispanic black and white males at the state level.
All subsequent references to the incarceration rate, this should be understood as being per 100,000 population of the relevant group. The figures throughout include state prisoners only.
This is the earliest year in which we can get jurisdictional data on race.
Figure 1 shows the violent crime rate, but the story is similar if we graph the overall crime rate, the felony arrest rate or the overall arrest rate. Our figure begins in 1978 which is the starting point for our sample on incarceration. However the increase in violent crime rates dates to the 1960s.
Using the technique of Granger causality for almost 20 years of state-level data on incarceration and crime rate, Marvell and Moody (1995) found that a 10% increase in prison populations led to a 1.5% reduction in crime rates.
This despite the fact that crack cocaine and powdered cocaine are pharmacologically equivalent. The sentencing disparity is reduced, but not eliminated in 2010. Bjerk (2017) argues that court rulings in the mid-2000s, which made sentencing guidelines advisory and revisions to these guidelines in 2007 had a larger effect on reducing crack sentences than the 2010 act.
The 1994 Violent Crime Control and Law Enforcement Act.
There were many other provisions of the bill, but these provisions are unlikely to affect either the black incarceration rate or the racial disparity for prisoners held at the state level. Among other things, the bill provided for an expansion of the federal death penalty and the establishment of a federal three strikes provision. Neither of these provisions is likely to have a significant effect on state level incarceration data.
This argument runs counter to Alexander (2010).
Crutchfield et al. (1994) argue that aggregate results conceal considerable heterogeneity across jurisdictions. For example, the percentage of the black-white imprisonment disparity which can be explained by arrests varies considerably across states.
Another recent contribution is by Kim and Kiesel (2017). They use New York data and while they find some heterogeneity across the state they find that the racial disparity in prison sentencing is largely explained by the racial disparity in arrests. Thus, the racial disparity in imprisonment is largely explained by factors occurring at the arrest stage or earlier in the process.
The result on inequality is consistent with the theoretical model developed by Curry and Klumpp (2009).
A few missing variables were estimated by taking the mean of the adjacent observations. We do not use federal prisoner data due to major changes in reporting by race and Hispanic origin, which begin in 2011. Because of these changes, the federal time series is not comparable to the time series produced by the state level data. As noted by Pfaff (2017), among others, the vast majority (approximately 87%) of prisoners are held at the state level.
Data on the Hispanic population from 1980 was only available at the National-level, so the state-level population needed to be estimated. The census provides state level estimates on the Hispanic population 1981–2014.
Prior to 2000, this person would have been accounted for only once under either white or Asian.
If g is the growth rate of, say, the black alone population over 2000–2004, then our estimate of the black population in 2000 is (1 + g) × black population in 1999 and our 2001 estimate is (1 + g)2 × black population in 1999 and so on.
This racial disparity is reported in Beck and Blumstein (2017), except that they allocated Hispanics to the black and white categories. One result of this is that their reported ratios are generally somewhat smaller than ours. Their Table 4 reports this ratio for 1990 and 2011 for the 10 states with the highest ratio and the 10 states with the lowest ratio.
Muller (2012, 288–291) also performs a decomposition, but his emphasizes black migration across states and is concerned with the period 1880–1950.
The percentages reported in the text are obtained by taking the absolute value of the remainder and then averaging. The magnitude of the remainder tends to be larger in percentage terms when there is a small change in the black incarceration rate. Since the changes in the black incarceration rate tend to be smaller in magnitude in the 1999–2014 period, the average magnitude of the remainder is higher in this period than in 1978–1999.
While an increase in the racial disparity explains 5.3% of the increase in black incarceration, the changes in the demographic variable explain − 6.8%.
Because there are too many missing observations, our analysis does not include Vermont.
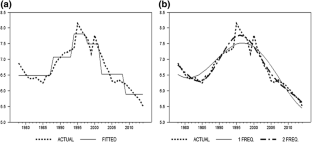
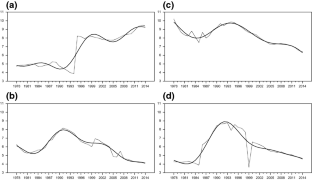
As such, the solid line shows the best fitting line allowing for the sharp breaks estimated by the Bai–Perron methodology. These estimates minimize the residual sum of squares. Note that the method requires us to specify a minimum number of years between successive breaks. In order to avoid fitting outliers, we specified that a break lasts no less than 5 years.
Note that the sine and cosine functions have a period of π/2. As such, for the functions sin(2πkt/T) and cos(2πkt/T), the value of k is the number of complete sine and cosine cycles (i.e., the frequency) over the sample period. By appropriately aligning these sine and cosine functions it is possible to capture the behavior of almost any integral function by the appropriate choice of n.
This discussion closely follows Enders and Jones (2014, pp. 60–61).
Formally, structural breaks shift the spectral density function towards zero. As such, the low frequency components of a Fourier approximation can capture such shifts. Note that estimating (10) by OLS guarantees that \(e\left( n \right)_{t}\) has mean value of zero although it is likely to be serially correlated. Enders and Lee (2012) and the survey article by Enders and Jones (2014) discuss additional details concerning the Fourier methodology.
We calculated the AIC as − 2 log(likelihood)/T + 2 * (# regressors)/T, to determine which number of n = 1–3 that best fits the data for each state. Note that adding regressors improves the fit and so reduces the value of − 2 log(likelihood) but increases the value of 2 * (# regressors)/T. The regression selected is the one with the smallest value of the AIC.
Twenty-four states enact three strikes statutes in the 1993–1995 period, while only a handful experience a subsequent rise in the racial disparity. However, the details of the laws differ by state and California had a particularly stringent version of the law. As of July 1998, California had more persons sentenced under this statute on a per capita basis than any other state. See Marvell and Moody (2001, fn. 27 and p. 102).
We cannot conclusively rule out the possibility that the aggregate racial disparity would have fallen faster absent the 1994 bill. We can only conclude that the prima facie evidence does not support the idea that the bill aggravated the racial disparity in state level imprisonment.
In addition to California, the other states reaching a global maximum in the racial disparity in the 2000–2014 period are Colorado, Maine, New Jersey, New Mexico, New York, and North Dakota.
Presumably both factors contribute to the increased racial disparity during this period, but our analysis does not allow us to put weights on these two factors. Because we use state level data, the Federal sentencing disparity is not directly relevant. However, 16 states introduced sentencing disparities between crack and powder cocaine. See Porter and Wright (2011). At the time of the writing of their report in 2011, three states had passed legislation to remove this disparity.
See, for example, Stemen et al. (2005).
References
Alexander ML (2010) The new Jim Crow: mass incarceration in the age of colorblindness. New Press, New York
Arvanites TM (1992) The mental health and criminal justice systems: complementary forms of coercive control. In: Liska AE (ed) Social threat and social control. State University of New York Press, New York, pp 131–149
Arvanites TM, Asher MA (1995) The direct and indirect effects of socio-economic variables on state imprisonment rates. Crim Justice Policy Rev 7:27–53
Arvanites TM, Asher MA (1998) State and county incarceration rates. Am J Econ Sociol 57:207–222
Bai J, Perron P (1998) Estimating and testing linear models with multiple structural changes. Econometrica 66:47–78
Bai J, Perron P (2003) Computation and analysis of multiple structural change models. J Appl Econom 18:1–22
Baumer EP (2013) Reassessing and redirecting research on race and sentencing. Justice Q 30:231–261
Beck AJ, Blumstein A (2017) Racial disproportionality in the U.S. state prisons: accounting for the effects of racial and ethnic differences in criminal involvement, arrests, sentencing, and time served. J Quant Criminol. https://doi.org/10.1007/s10940-017-9357-6
Beckett K, Western B (2001) Governing social marginality welfare, incarceration, and the transformation of state policy. Punishm Soc 3:43–59
Bjerk D (2017) Mandatory minimum policy reform and the sentencing of crack cocaine defendants: an analysis of the fair sentencing act. J Empir Leg Stud 14:370–396
Blumstein A (1982) On the racial disproportionality of United States’ prison populations. J Crim Law Criminol 73:1259–1281
Blumstein A, Beck AJ (1999) Population growth in US prisons, 1980–1996. Crime Justice 26:17–61
Bridges GS, Crutchfield RD (1988) Law, social standing and racial disparities in imprisonment. Soc Forces 66:699–724
Crutchfield RD, Bridges GS, Pitchford SR (1994) Analytical and aggregation biases in analyses of imprisonment: reconciling discrepancies in studies of racial disparity. J of Res Crime Delinq 31:166–182
Curry PA, Klumpp T (2009) Crime, punishment, and prejudice. J Public Econ 93:73–84
Enders W, Jones P (2014) On the use of the flexible Fourier form in unit roots tests, endogenous breaks, and parameter instability. In: Ma J, Wohar M (eds) Recent advances in estimating nonlinear time series. Springer, Berlin
Enders W, Lee J (2012) A unit root test using a Fourier series to approximate smooth breaks. Oxf Bull Econ Stat 74:575–599
Evans W, Garthwaite C, Moore TJ (2016) The white/black education gap, stalled progress, and the long-term consequences of the emergence of crack cocaine markets. Rev Econ Stat 98:832–847
Fryer RG Jr, Heaton PS, Levitt SD, Murphy K (2013) Measuring crack cocaine and its impact. Econ Inq 51:1651–1681
Gallant R, Souza G (1991) On the asymptotic normality of Fourier flexible form estimates. J Econom 50:329–353
Greenberg DF, West V (2001) State prison populations and their growth, 1971–1991. Criminology 39:615–654
Jacobs D, Helms R (2001) Toward a political sociology of punishment: politics and changes in the incarcerated population. Soc Sci Res 30:171–194
Kim J, Kiesel A (2017) The long shadow of police racial treatment: racial disparity in criminal justice processing. Public Adm Rev. https://doi.org/10.1111/puar.12842
Langan PA (1985) Racism on trial: new evidence to explain the racial composition of prisons in the United States. J Crim Law Criminol 76:666–683
Listokin Y (2003) Does more crime mean more prisoners? An instrumental variables approach. J Law Econ 46:181–206
Marvell TB, Moody CE (1995) The impact of enhanced prison terms for felonies committed with guns. Criminology 33:247
Marvell TB, Moody CE (2001) The lethal effects of three-strikes laws. J Leg Stud 30:89–106
Michalowski RJ, Pearson MA (1990) Punishment and social structure at the state level: a cross-sectional comparison of 1970 and 1980. J Res Crime Delinq 27:52–78
Muller C (2012) Northward migration and the rise of racial disparity in American incarceration, 1880–1950. Am J Sociol 118:281–326
Pfaff JF (2017) Locked in: the true causes of mass incarceration and how to achieve real reform. Basic Books, New York
Porter ND, Wright V (2011) Cracked justice. The Sentencing Project. http://www.sentencingproject.org/wp-content/uploads/2016/01/Cracked-Justice.pdf. Accessed 11 Aug 2017
Smith KB (2004) The politics of punishment: evaluating political explanations of incarceration rates. J Polit 66:925–938
Sorensen J, Stemen D (2002) The effect of state sentencing policies on incarceration rates. Crime Delinq 48:456–475
Stemen D, Rengifo A, Wilson J (2005) Of fragmentation and ferment: the impact of state sentencing policies on incarceration rates, 1975–2002. Vera Institute of Justice, New York
Tonry M, Melewski M (2008) The malign effects of drug and crime control policies on black Americans. Crime Justice 37:1–44
Zimring FE, Hawkins GJ (1993) The scale of imprisonment. University of Chicago Press, Chicago
Acknowledgements
We would like to thank Shawn D. Bushway, Phil Curry, Shahar Dilbury, Griffin Edwards, Gary Hoover, Bryan McCannon, Lesley Reid, Daiquiri Steele and two anonymous referees for providing helpful comments and suggestions. We thank E. Ann Carson for her help with the prisoner data. Pecorino and Souto would like to thank the Department of Economics, Finance and Legal Studies at the University of Alabama for providing financial support.
Author information
Authors and Affiliations
Corresponding author
Rights and permissions
About this article

Cite this article
Enders, W., Pecorino, P. & Souto, AC. Racial Disparity in U.S. Imprisonment Across States and Over Time. J Quant Criminol 35, 365–392 (2019). https://doi.org/10.1007/s10940-018-9389-6
Published:
Issue Date:
DOI: https://doi.org/10.1007/s10940-018-9389-6