Abstract
This paper presents a comprehensive overview of the rapid damage assessment and reconnaissance efforts following the devastating earthquakes on February 6, 2023, in Türkiye. It specifically focuses on implementing the SiteEye Disaster Plugin, an additional component of SiteEye software developed by i4 Company engineers and Middle East Technical University researchers. This tool played a critical role in managing and analyzing a massive dataset comprising over 28,000 images and videos. The research highlights the plugin’s innovative features, such as offline data collection, georeferenced-based layering, and an integrated damage classification system, significantly improving earthquake impact assessments’ accuracy and efficiency. It also underscores the importance of interdisciplinary collaboration involving national and international teams and the role of open data in disaster management. The findings demonstrate how digital technologies can transform the field of disaster response, offering new approaches for rapid assessment and effective management in the aftermath of seismic events. This research contributes valuable insights into enhancing disaster preparedness and response strategies, particularly in earthquake-prone areas.
1 Introduction
On February 6, 2023, a sequence of devastating earthquakes struck Türkiye, leaving an unforgettable mark on history. These seismic events along the East Anatolian Fault (EAF), a zone of significant seismic activity, had far-reaching consequences for the southern and eastern parts of the nation. The initial quake’s moment magnitude (Mw) was 7.7, near Pazarcık, Kahramanmaraş, at 04:17 local Türkiye time (UTC + 3). Subsequently, a 7.6 earthquake occurred near Elbistan in Kahramanmaraş at 13:24 local Türkiye time (UTC + 3) (AFAD 2023). These seismic events occurred at depths of 8.6 km and 7.0 km, respectively, and were profoundly perceived over an extensive surface area. The first earthquake resulted in a fault approximately 190 km in length and 25 km in width. The subsequent earthquake occurred roughly 90 km to the northeast of the initial event. This second seismic event produced a rupture around 120 km long and 18 km wide (USGS 2023).
The earthquakes had geographical and social consequences in Türkiye, affecting more than 15 million people across eleven cities and an area of nearly 100,000 km2. Additionally, the earthquakes Mw 7.7 and Mw 7.6 shook portions of northern Syria. More than 35,000 structures collapsed, and nearly 180,000 were severely damaged due to the shaking, with most of the damage occurring in Hatay and Kahramanmaraş (TMMOB 2023). The casualty toll stood at around 50,000 fatalities and 107,000 injuries, according to the Ministry of Interior of Türkiye, highlighting the tragic human impact of the disaster (TRT Haber 2023). The widespread destruction caused by this event had a profound impact on numerous infrastructures—including industrial and residential structures, bridges, and transportation networks—resulting in economic losses surpassing $100 billion, with industrial facility damage accounting for a considerable portion of these losses (Avcil et al. 2023; Ozkula et al. 2023; Wang et al. 2023). Many reinforced concrete buildings in the earthquake region were severely damaged or collapsed entirely (Avcil 2023; Binici et al. 2023; Mertol et al. 2023; Vuran et al. 2024). In addition, cultural heritage sites, such as mosques and churches, also underwent damage and collapsed at multiple levels (Boyoğlu et al. 2023; Işık et al. 2023; Onat et al. 2023).
The earthquake’s devastation implied the criticality of efficient emergency response and disaster management procedures where digital information is vital. It was suggested that data collection and analysis efficiency in disaster reconnaissance might be improved using digital data modeling and communication strategies for information transfer (Schroeder et al. 2016). Earthquake databases, which contain a significant volume of images collected by engineering teams following hazard events, highlight a growing trend toward leveraging digital data sources for earthquake reconnaissance (Choi et al. 2022). Furthermore, increasing earthquake reconnaissance tasks utilize crowdsourcing and social media platforms as data sources, reflecting the trend toward combining digital data sources in earthquake reconnaissance (Contreras et al. 2021). The Preliminary Virtual Reconnaissance Report (PVRR) on the M7.2 Nippes Earthquake in Haiti (Kijewski-Correa et al. 2021a) underscores the significance of digital platforms in enhancing the speed and accuracy of damage assessments. The “Did You Feel It?” (DYFI) system by Wald et al. (2011) exemplifies leveraging internet-based tools for rapid, widespread public engagement in seismic data collection. The integration of the MyShake smartphone application for crowdsourcing earthquake reports, as discussed by Kong et al. (2023), underscores the increasing dependence on digital technology for collecting seismic data.
In addition to underlining the utility of several earthquake missions, the significance of digital data collection utilizing omnidirectional images during post-earthquake reconnaissance missions has been underscored (Rossetto et al. 2014). Moreover, using unmanned aerial vehicles (UAVs) for aerial observation and rapid damage assessment in disaster management has been acknowledged as a crucial instrument for collecting digital data after seismic events (Stone et al. 2018). Likewise, reconnaissance organizations that collect wind, seismic, and coastal damage data during field reconnaissance missions upload and publish this information, emphasizing the significance of digital data sharing and dissemination in disaster risk management (Zwegliński 2020).
The comprehensive study on the catastrophic consequences of the Türkiye earthquake sequence highlights the need for digital innovation (Aktaş et al. 2023). The Structural Extreme Events Reconnaissance (StEER) Network’s community-centered approach (Kijewski-Correa et al. 2021b) illustrates the role of digital tools in facilitating rapid knowledge sharing and data collection. The examination of traditional buildings’ seismic performance (Aktas et al. 2022a) and the hybrid reconnaissance mission methodologies (Aktas et al. 2022b) further reflect on the utility of digital and remote sensing methods in assessing earthquake impacts. The utilization of remote post-earthquake reconnaissance methodologies in response to the Haiti earthquake (Whitworth et al. 2022) and the evolving landscape of disaster reconnaissance missions (Aktas and So 2022) underscore the shift towards digital and hybrid approaches in disaster management.
The literature study illustrates the growing dependence on enhanced data modeling, remote sensing methods, and digital data for earthquake reconnaissance and disaster management (Giardina et al. 2023; Rathje and Franke 2016; Zwegliński 2020). Several tools have been developed that leverage digital data for post-disaster damage assessment and recovery. Roeslin et al. (2018) introduced a comprehensive tool for assessing building damage after earthquakes, effectively utilized in Mexico City following the 2017 Puebla earthquake. This tool, aiming for global applicability, includes detailed sections for recording various aspects of building damage and characteristics, underscoring the necessity for uniform methodologies in damage assessment. Similarly, Behrouzi and Pantoja (2018) focused on creating a software tool that analyzes high-resolution image data for structural damage post-earthquakes. Their tool simplifies the image tagging process, enhancing the training of deep learning algorithms for automatic damage identification. Additionally, Lin et al. (2019) developed the Real-time Individual Asset Attribute Collection Tool (RiACT), a framework for capturing attribute data of assets before and after disasters. RiACT facilitates efficient data capture, real-time transfer, and access to historical asset information, thereby supporting improved decision-making in disaster response. These tools represent significant advancements in integrating digital disaster management and recovery technology.
In light of these, the present study investigates the significance of data gathering and digital data management following the Kahramanmaraş-Türkiye earthquakes. It emphasizes the criticality of efficient data management practices for researchers to collect, analyze, and interpret enormous volumes of information to rapidly understand the scale of damage, identify weaknesses, and assess the performance of structures. It also implied the proper use of knowledge acquired from these analyses in guiding policymakers, revising design codes, and improving subsequent evaluations of earthquake risk.
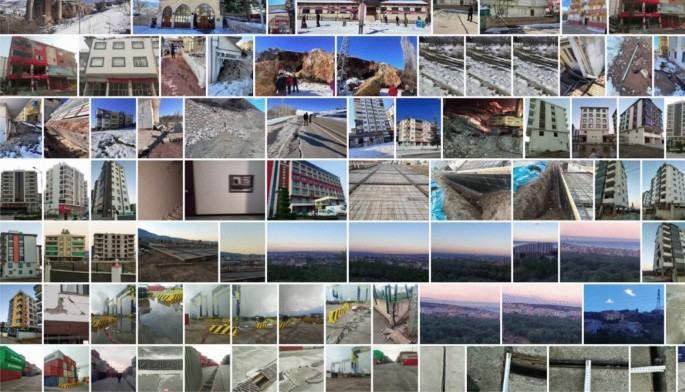
During the 6th February Earthquakes, effective planning of large-scale, coordinated reconnaissance operations was possible by integrating diverse digital technologies, which also permitted instant access to field-acquired data (Cetin and Ilgac 2023). Researchers from several academic fields visited the affected locations, utilizing their respective areas of knowledge to analyze and record the effects on the infrastructure. Figure 1 displays images collected through the SiteEye Disaster Plugin from various locations, including reinforced concrete buildings, roads, and coastal structures, illustrating the diversity of both aerial and ground-level perspectives users provide. The collection of data was facilitated by national teams of professors from diverse universities, the Disaster and Emergency Management Presidency (AFAD), and the Ministry of Environment, Urbanization and Climate Change. Furthermore, the data-gathering procedure was joined by international teams such as EEFIT (Earthquake Engineering Field Investigation Team), GEER (Geotechnical Extreme Events Reconnaissance), and CAEES (The Canadian Association for Earthquake Engineering and Seismology). The excellence and scope of the gathered data are enhanced by this interdisciplinary collaboration, which takes place on a national and global scale; consequently, a more integrated knowledge of the effects of earthquakes is developed.
The utilization of SiteEye (www.siteeye.co), a visual data management and cloud-based photogrammetry software, represents significant progress in digital data management. To respond to the earthquakes that struck Türkiye, engineers from i4 Company and researchers from the Department of Civil Engineering and Middle East Technical University worked together to develop the SiteEye Disaster Plugin voluntarily. This plugin is designed to facilitate earthquake examinations, enabling the integration of geolocated site data, including videos, drone footage, and ground images. The system handles the information effectively, merges the data with earthquake map layers, and facilitates damage interpretation. The data gathered consists of over 80 videos and more than 28,000 images, of which over 5,600 have labeled damage types immediately available to the users.
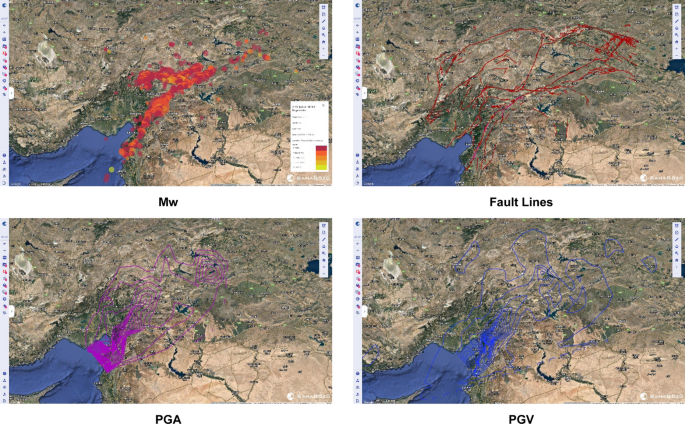
While SiteEye and tools like Fulcrum (www.fulcrumapp.com) and Survey123 (www.survey123.arcgis.com) aim to facilitate post-earthquake assessments, they differ significantly in customization and data integration capabilities. Fulcrum and Survey123 represent field data collection tools that allow users to customize and tailor forms to meet their specific requirements. In contrast, the SiteEye Disaster Plugin does not allow users to modify damage assessment forms; however, it has been methodically refined by incorporating expert feedback. Beyond the collection of damage classification data, as previously outlined, SiteEye enables researchers to upload either 2D/3D models, including orthophotos/point clouds, or generate such models through photogrammetry employing UAV photographs, thereby facilitating comprehensive terrain analysis. Furthermore, SiteEye integrates various seismological data sets, such as fault lines, surface ruptures, moment magnitude (Mw), peak ground acceleration (PGA), and peak ground velocity (PGV) distributions, into interactive maps as supplementary information layers, thereby presenting a multifaceted perspective on the impact of earthquakes.
Reflecting on the utility of the SiteEye Disaster Plugin, it is evident that its development was timely and critical for enhancing the effectiveness of earthquake reconnaissance efforts. This tool was designed and developed shortly after the two catastrophic earthquakes. It comprises a collection of purposefully engineered functionalities to optimize and enhance damage assessment investigations. The researchers’ improved efficiency and accuracy in data collection and evaluation, made possible by the SiteEye Disaster Plugin, exemplifies the platform’s critical contribution to disaster management. The procedures for data collection, management, and analysis utilizing the SiteEye Disaster Plugin are elaborated upon in the following sections of this paper. This demonstrates how digital technologies transform field studies conducted after earthquakes and provide novel approaches to rapid damage assessment and reconnaissance.
2 Development of the plugin
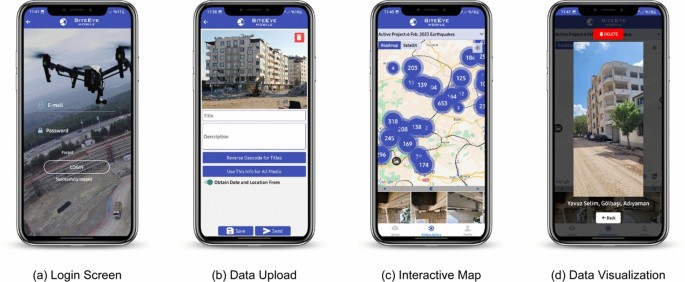
SiteEye, a cloud-based data management system, was created by developers and researchers affiliated with Middle East Technical University. Featuring a multi-level architecture, it efficiently facilitates data storage in the cloud and operates on several platforms, including web, iOS, and Android. SiteEye is utilized for construction site documentation, enabling extensive data collection through web and mobile applications. The mobile application efficiently manages ground data, gathering media directly from construction job sites to support detailed monitoring and reporting. Figure 2 illustrates the user interfaces of the SiteEye mobile application, exemplifying its application in collecting earthquake imagery data. SiteEye is distinguished by its georeferenced-based layering technology. This approach facilitates the utilization of diverse geographical layers, which serve as a data collection and processing framework. The software’s strength lies in its capability to autonomously extract geographic coordinates from the EXIF and embedded metadata of files, therefore cartographically representing this information with pinpoint accuracy.
In the aftermath of two earthquakes, authors have explored strategies to enhance support for researchers conducting field investigations. Within the initial week, researchers initiated the collection of ground images from various affected cities, with damage classification labels determined through consultation with earthquake experts. After the beginning of SiteEye Disaster Plugin development, deficiencies in SiteEye’s web and mobile platform were identified by both the development team and researchers. One of the first challenges was rendering media annotations within the map and list as the dataset expanded. Performance optimizations were instituted to mitigate this, including adopting virtual scrolling for the list and clustering annotation markers on the map based on zoom level. Additionally, absent functionalities on the mobile application, such as map-view and saving media for later upload under optimal service conditions, were addressed.
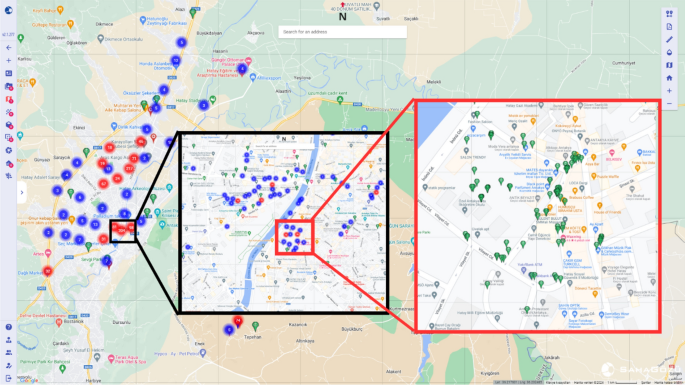
Managing substantial quantities of data is an essential component of SiteEye’s operation. SiteEye platform has been used in the field surveying industry for the last seven years, handling the visualization of gigabytes of mesh and point cloud data generated using UAV (Unmanned Aerial Vehicle) imagery on a web browser, which makes it suitable for handling the substantial quantities of image data an earthquake aftermath provides. In the month following the February 6, 2023 earthquakes, 28,000 images and videos were uploaded to the servers, and it was critical to preserve optimal system performance. In order to handle this, the system implements clustering methods for proper visualization. By utilizing marker clustering, data locations are displayed on-screen at many zoom levels (Fig. 3). In this figure, markers are colored red if the corresponding cluster contains more than 15 images, blue if it contains fewer, and they are green if it is a singular image. This attribute is particularly critical as it facilitates the organization of enormous quantities of data into feasible segments, categorized based on the contributions of the researchers. Enriching the dataset with openly available geotagged data and facilitating data uploads from affected citizens was initially considered for data collection. However, given the plugin’s principal aim of aiding earthquake researchers in their investigations, it was decided to restrict data collection and labeling exclusively to these experts. Despite data collection and processing being undertaken by these experts, the decision to share this data for broader research endeavors was made and implemented by collecting access requests from individual researchers and groups.
Due to the extensive disruptions in communication and internet access during the earthquakes, SiteEye modified its data collection methodologies to accommodate the challenging site conditions. Researchers can collect data in various ways using the mobile application: when internet access is available, they can shoot photographs or videos with direct geolocation tagging and upload them to SiteEye; otherwise, they can gather data offline for subsequent upload. When internet connectivity is restored, geolocation information data can be loaded into the application from the mobile device’s gallery.
SiteEye Disaster Plugin has been thoughtfully constructed to assist researchers in accurately and effortlessly classifying and evaluating data. An essential component of this framework is integrating a damage classification system. The interface incorporates this system, which enables field researchers to efficiently categorize their data according to the observed degree of damage and the type of structure. Determining the level of earthquake damage and strategizing for subsequent recovery and reconstruction endeavors require this classification. An exhaustive effort was devoted to defining classes throughout the construction of this classification system, which included consultation with earthquake experts from various fields. The classes of damages are given in Table 1 in the Appendices. The building damage categories are based on the official classification of earthquake damages on the structures reported by the Ministry of Environment, Urbanization and Climate Change, Republic of Türkiye (2024), given in Table 2 in Appendices. Immediately classified damage data benefited the engineers and researchers working in the field for reconnaissance studies as the damage was distributed in 11 provinces. This way SiteEye Disaster Plugin contributed to proper guidance for the reconnaissance. An illustrative example of the SiteEye Disaster Plugin’s impact on ground operations involves the route selection of international teams. Before their field visit, they checked the SiteEye platform to select areas they intended to focus on more closely. Specifically, the GEER team actively utilized the SiteEye platform for their visiting area selection, significantly optimizing their reconnaissance efficiency. Moreover, they also contributed their data to the platform, enriching the database with firsthand, valuable insights from the field. This synergy between SiteEye and its users facilitated targeted reconnaissance efforts and fostered a collaborative environment for data sharing and analysis.
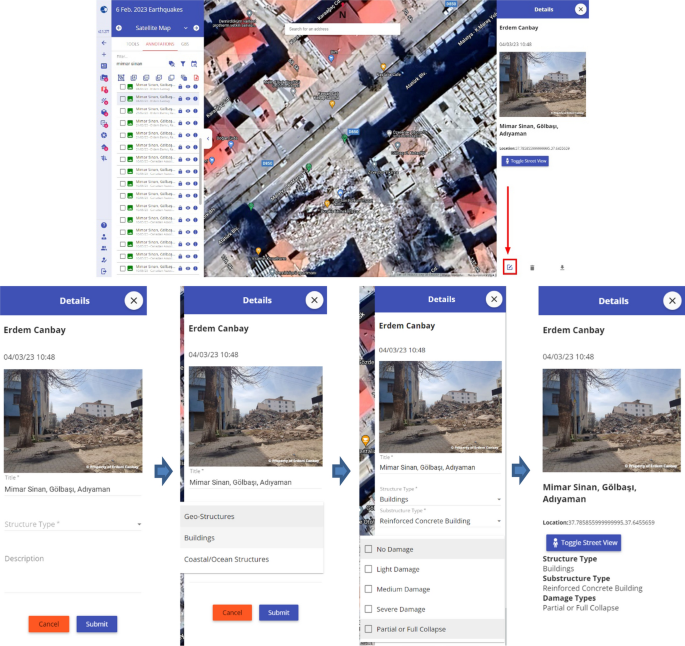
Furthermore, the web interface, illustrated in Fig. 4, has undergone optimization to simplify and enhance the user experience while selecting damage types, contributing to overall data analysis and reporting efficiency. Specifically, SiteEye introduces a feature allowing users to create title and description records for each photo beyond damage classifications. This capability enables users to input detailed text descriptions and pertinent tags for every image, making the dataset more informative and searchable. For instance, a user might tag a photo with “collapsed bridge or main street,” providing specific context that can be filtered and queried. This attribute is particularly advantageous for researchers, allowing them to explain their field data comprehensively. Such detailed records prove beneficial, especially when the collected data is queried by institutions and researchers from countries outside Türkiye, allowing for precise filtering based on text descriptions.
A disclosure method was implemented to attribute researchers’ contributions regarding intellectual property and data ownership. The researcher’s name obtaining the data is watermarked on every image published to the portal. In a collaborative context, this function is critical for preserving the integrity of the data and acknowledging the efforts of individual researchers.
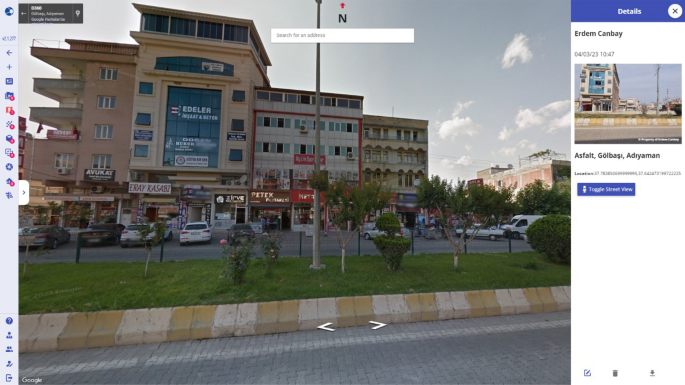
One notable improvement to SiteEye technology is the use of Google Street View imagery. Google Street View has become a highly beneficial instrument in earthquake damage assessment, performing virtual inspections of constructed surroundings. Evangelista et al. (2022) emphasized Google Street View’s capability to capture vital information required to assess the effects of disasters on urban infrastructure. Thus, the inclusion of this functionality emerged from the requirement of researchers to observe the state of the built environment and its components before the earthquake to facilitate comparative analyses (Fig. 5). Employing this integration, researchers are granted access to Google Street View images that precisely align with the geographical coordinates of the data they provide.
3 Data collection and processing
Data acquisition for the post-earthquake assessment was initiated immediately after the earthquakes. Rapid mobilization of national and international research teams to the earthquake-affected regions followed. Data was collected with the assistance of these teams, including images and videos obtained from the ground and aerial imagery utilizing UAVs. The timely accessibility of information was pivotal in enabling the systematic organization of reconnaissance operations. A critical component of this data collection effort was the consistent continuation of communication with field researchers. This communication was crucial in informing researchers on adequately utilizing the SiteEye tool. In addition, it facilitated the prompt reporting of any discovered problems in real-time, empowering the SiteEye Disaster Plugin development team to resolve concerns immediately and guarantee the application’s seamless operation within demanding field conditions.
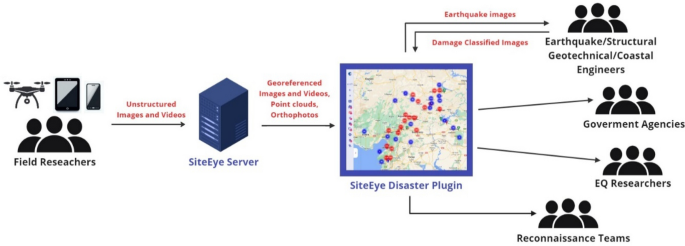
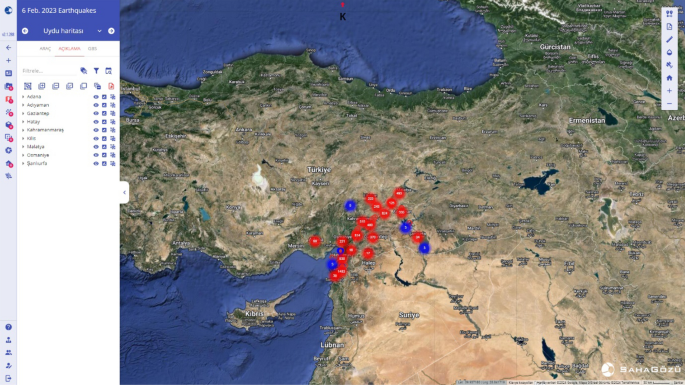
The primary method for collecting field data involved using the SiteEye mobile application and its corresponding web plugin. The framework of data flow is given in Fig. 6. Following the data collection, the data processing phase contained a sequence of procedures to manage the gathered images and videos efficiently. These procedures included sorting and categorization based on geographic and structural attributes, tagging with predefined classifications, geocoding to enhance searchability and analysis, the integration of seismological data for multidimensional analysis, and utilizing the photogrammetry engine capabilities to generate detailed 3D models from aerial imagery for advanced spatial analysis. However, before delving into these processes, it was crucial to visualize the data on a map first. This initial step of visual representation highlighted the geographical distribution of the earthquake’s consequences across the impacted regions, serving as a foundational activity for subsequent analysis and decision-making processes (Fig. 7).
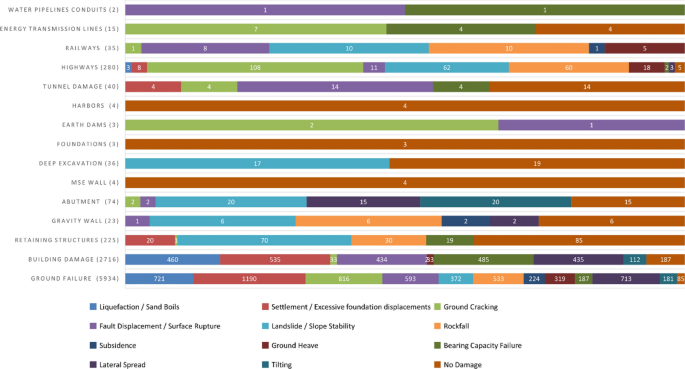
In order to further enhance the practical interpretation of the information, the data was carefully labeled with the predetermined classifications using the structure type, substructure type, and types of damage among these particulars. Experts from numerous disciplines, including coastal, geotechnical, and structural engineering, compiled an exhaustive list from which the tags were chosen. A total of 5658 images were classified. 4387 geotechnical photos were incorporated into this comprehensive classification, which yielded vital insights regarding the earthquake’s geotechnical/geological consequences. Furthermore, 1160 images were allocated for evaluating the buildings, and 111 images were explicitly targeted at coastal structures to underscore the earthquake’s impact on these vital assets. The majority of data in SiteEye is primarily geotechnical because the platform’s user base consists mainly of geotechnical researchers, leading to a higher volume of contributions in this area. The graphical distribution of the specifics of these classes can be seen in Figs. 8, 9, and 10. The values presented alongside the feature titles represent the number of photos in the figures.
An integral component of the data processing procedure entailed geocoding the image coordinates. Geocoding involves converting geographic coordinates into more comprehensible and searchable formats, such as city, district, and street names. The incorporation of geographical information into the images significantly facilitated the process of filtering and classifying the data. An example of tagging an image would be “Yarbaşı, Pazarcık, Kahramanmaraş,” which would enable researchers to filter images according to specific locations or cities. The organization of this data played a critical role in analyzing the spatial distribution of damage and developing targeted response strategies.
The data processing phase integrated various seismological data into the mapping and imagery systems. The components mentioned above comprised fault lines, surface ruptures, moment magnitude (Mw), peak ground acceleration (PGA), and peak ground velocity (PGV) distributions. By utilizing the layering technique, it was possible to represent various data types simultaneously, thereby providing a multidimensional view of the earthquake’s effects. Those map layers are given in Fig. 11. SiteEye Disaster Plugin, in this sense, uniquely delivered this information online as it interacted with the field researcher’s findings and provided them to others.
In addition to its collection and visualization of standard imagery and videos, the SiteEye software leverages photogrammetry techniques to transform aerial imagery into three-dimensional models. This process predominantly utilizes drone images, ideal for capturing high-resolution data of the earth’s surface from various angles. Through a sophisticated Structure from Motion (SfM) (Schonberger and Frahm 2016) and Multi-View Stereo (MVS) (Furukawa and Ponce 2010) pipeline, SiteEye constructs detailed 3D point clouds and orthophotos. This SfM-MVS methodology enables the accurate modeling of surface geometries, thereby facilitating a comprehensive analysis of physical terrain attributes. The generated 3D point clouds are particularly invaluable in assessing earthquake-damaged regions, allowing for an in-depth inspection of buildings with structural damage. This capability aids in the immediate evaluation of the damage and the strategic planning of reconstruction efforts. Utilizing the photogrammetry capabilities of the SiteEye software, several earthquake-affected regions were successfully transformed into detailed 3D models.
Meanwhile, the orthophotos produced by SiteEye provide an essential bird’s-eye view of the affected areas, making it possible to monitor the availability of tent areas—where tents were installed for earthquake victims—. Figure 12 exemplifies this by showcasing the tent areas to shelter earthquake victims. Also, the online accessibility of the data guarantees that professionals from various geographical locations and disciplines can readily access, collaborate on, and share it. This feature facilitates seamless teamwork across different geographies, allowing users to engage in real-time discussions, make precise model adjustments, and share insights without needing physical presence. Moreover, the cloud storage capability ensures that all modifications and annotations are saved and instantly accessible to all team members, streamlining the collaborative process and enhancing the efficiency of analyzing and planning reconstruction efforts for earthquake-affected areas.
Finally, an essential field research component used markers in the mapping system to designate significant locations, such as soil sample positions. The markers functioned as critical reference points on the map, facilitating researchers and analysts to identify and examine particular sites of interest rapidly. By facilitating the correlation between physical samples and observations and the corresponding geospatial data, this function significantly enhanced the analysis and comprehension of the earthquake’s impacts as a whole.
4 Discussion
SiteEye Disaster Plugin demonstrated its ability to adapt and respond effectively to the complex data challenges from the February 6, 2023, earthquakes in Türkiye. This plugin efficiently organizes and visualizes massive datasets in order to accommodate the collection of more than 28,000 images and videos. Immediate processing and data analysis are critical for effective response and recovery action plans, making this capability crucial in disaster scenarios. This contribution emphasizes the significance of scalable and adaptable data management systems in crises, which can significantly affect the speed and efficacy of disaster relief operations.
SiteEye’s adaptable approaches to data collection effectively tackle significant obstacles in disaster management, specifically in the aftermath of such events. The software’s design incorporates protections for data collection in disaster zones, taking into account the potential disruptions in communications that may occur even in the absence of internet connectivity. This function guarantees uninterrupted data gathering, essential for the timely and detailed damage evaluation. By permitting data collection offline and subsequently uploading it once connectivity is restored, SiteEye guarantees the preservation of critical information and improves the efficiency of field operations under challenging circumstances.
The implementation of georeferenced-based layering technology in SiteEye represents a significant advancement in the visualization and management of geographical data. The capability of this technology to independently extract geographic coordinates from file metadata substantially enhances the accuracy and dependability of spatial data analysis. It facilitates the integration of diverse geographical layers, offering a more comprehensive data presentation and interpretation framework. This technological progress improves the precision of data visualization. It facilitates more informed and up-to-date decision-making in disaster response and urban planning, particularly in the aftermath of earthquakes.
SiteEye contributed substantially to disaster assessment by using photogrammetry technology to generate three-dimensional models from aerial imagery. This technology provides a dense point cloud representation of the impacted terrain, enabling in-depth topographical evaluations and spatial analyses. In understanding the extent and particulars of the damage, the capacity to produce sophisticated 3D models is essential; this capability improves the precision of assessments and facilitates the organization of reconstruction endeavors.
Developing an integrated damage classification system into SiteEye significantly advances earthquake research and disaster management. By allowing field researchers to classify data according to observed damage, this system facilitates the evaluation of earthquake impacts in a streamlined manner. The participation of experts in earthquake engineering in the process of establishing classification criteria guarantees that the system is comprehensive and pertinent. This characteristic facilitates immediate disaster response and supports critical long-term recovery planning and infrastructure resilience evaluation, substantially contributing to structural engineering and urban planning in earthquake-prone areas. This technology plays an essential role in urban planning by enabling planners to identify and map areas at high risk for earthquakes more accurately, ensuring that zoning and development regulations can be appropriately adjusted to mitigate risk. Additionally, the improved visualization technologies integral to this system aid in designing and optimizing evacuation routes, enhancing the preparedness and efficiency of emergency responses by ensuring immediate access to emergency services following a disaster.
The tool also facilitates collaborative efforts by streamlining data collection and interpretation integration between remote and on-site researchers. It aids in efficiently planning paths and strategies by utilizing previously uploaded images and analyzing the distribution of damage within specific locations. Researchers were able to plan their site visits efficiently with the assistance of classified information that was shared regarding the earthquake zone. By maximizing the coverage and efficiency of data collection efforts and guaranteeing exhaustive documentation of the extensive damage, this strategic planning was crucial. Gaining insight into the earthquake’s far-reaching effects required implementing such a methodical strategy. Additionally, its analysis was significantly impacted by the structured nature of the gathered data.
A noteworthy data analysis element was the application of Google Street View imagery captured before the earthquake. Employing SiteEye and Google Street View comparison, the destruction caused by the earthquake was clearly illustrated, offering a distinct before-and-after viewpoint. This type of imagery was crucial in understanding the extent of damage sustained by numerous structures.
The acquisition of diverse data from locations affected by widespread earthquakes is critical. It facilitates the derivation of significant patterns corresponding to the destructive nature of the occurrences. Examining and interpreting these patterns are of the highest concern for post-earthquake research, as they enhance response strategies and offer valuable insights for subsequent disaster management. For example, adapting the plugin for Istanbul, an earthquake-prone area in Türkiye, is essential to enhance earthquake preparedness. The tool’s advanced georeferenced visualizations enable emergency teams to efficiently plan and prioritize responses based on anticipated damage locations. Collaborative efforts with local stakeholders, including government agencies and educational institutions, would ensure the tool’s integration into disaster preparedness and urban planning processes. This integration enhances immediate response capabilities and fosters a community resilience and preparedness culture.
With its diverse capabilities, the SiteEye Disaster Plugin is an indispensable component of these visual inspection and analysis procedures. Some of the gathered data was made available to the public to promote collaboration and advance earthquake research. The shared dataset is an asset for researchers across the globe, facilitating a more comprehensive examination and comprehension of the consequences of the earthquake. In brief, the collective endeavors encompassing data collection, management, and analysis have substantially contributed to earthquake investigation of earthquake impacts. In addition to strengthening our comprehension of earthquake occurrences, these discoveries establish a fundamental basis for greater wisdom and efficacy in our approaches toward forthcoming earthquakes.
5 Conclusions and future works
February 6, 2023, earthquakes in Türkiye, magnitudes of 7.7 and 7.6, have underscored the critical importance of rapid and efficient disaster response and management, especially in earthquake-prone regions. The study presented here provides a comprehensive examination of the utilization of digital technologies in earthquake reconnaissance and disaster management. Integrating the SiteEye Disaster Plugin has proven to be a pivotal advancement in disaster assessment. The plugin has shown remarkable capabilities in organizing, visualizing, and managing large-scale datasets. Its features, such as offline data collection, georeferenced-based layering technology, and an integrated damage classification system, have significantly enhanced the efficiency and accuracy of earthquake impact assessments. The use of photogrammetry technology for creating detailed 3D models and incorporating Google Street View for comparative analyses further exemplifies the plugin’s contribution to understanding and managing the aftermath of seismic events. Furthermore, these data can also be utilized as educational material for training future researchers and students in earthquake engineering.
The study highlights the importance of collaborative and interdisciplinary efforts in disaster management. The involvement of national and international teams was significant in the extensive data collection and analysis process. Sharing a portion of this data as an open dataset is a testament to the commitment to collaborative research in understanding and mitigating the impacts of earthquakes. It is important to note that only a portion of the data is shared publicly due to the preferences of individual contributors, who retain the choice of whether to make their data available for open access.
In conclusion, the response to the February 2023 earthquakes in Türkiye, facilitated by the SiteEye Disaster Plugin, represents a significant leap forward in digital disaster management. The insights gained from this experience are invaluable for enhancing preparedness and response strategies for future seismic events, thereby contributing to the resilience and safety of vulnerable communities worldwide. As a future work, the integration of machine learning could help analyze and classify earthquake data, building upon the SiteEye Disaster Plugin’s capabilities. Specifically, machine learning algorithms can be trained to automatically classify images of earthquake damage, such as structural and geotechnical damage. Beyond the classification, these algorithms can also determine the severity of damage. Moreover, the algorithms can effectively compare pre- and post-earthquake images to detect damage, which is crucial for quickly identifying heavily affected areas and streamlining damage assessment. Considering these capabilities, AI-driven techniques will be developed to enhance damage assessment, perform intricate geospatial analyses, and refine photogrammetry models for more accurate 3D representations of affected areas.
Data availability
A considerable effort was initiated to reveal some of the gathered data to the public to enhance the breadth of earthquake research and promote cooperative analysis. Following this endeavor, consent was obtained from the data owners. The dataset, comprising relevant geospatial information, videos, and images, has been available to scientists and practitioners interested in earthquake investigations. In order to obtain access to this publicly available dataset, users should complete the registration process on the SiteEye platform via www.siteeye.co freely.
References
AFAD (2023) 06 Şubat 2023 Pazarcık (Kahramanmaraş) Mw 7.7 ve Elbistan (Kahramanmaraş) Mw 7.6 Depremlerine İlişkin Ön Değerlendirme Raporu
Aktas YD, So E (2022) Editorial: disaster reconnaissance missions: is a hybrid approach the way forward? Front Built Enviro 8:1–3. https://doi.org/10.3389/fbuil.2022.954571
Aktaş YD, So E, Johnson C, Dönmez K, Özden AT, Vatteri AP, O’Kane A, Kalkan A, Andonov A, Verrucci E, Çabuk E, Opabola E, Malcıoğlu FS, Markov HP, Giardina G, Madabhushi G, Triantafyllou I, Byun J-E, Jones JN, Novelli V (2023) The Türkiye earthquake sequence of February 2023—A longitudinal study report by EEFIT. pp 355. https://www.istructe.org/resources/report/eefit-mission-report-turkey-february-2023/
Aktas YD, Ioannou I, Malcioglu FS, Kontoe M, Parammal Vatteri A, Baiguera M, Black J, Kosker A, Dermanis P, Esabalioglou M, Cabuk E, Donmez K, Ercolino M, Asinari M, Verrucci E, Putrino V, Durmaz B, Kazantzidou-Firtinidou D, Cotton D, D’Ayala D (2022a) Hybrid reconnaissance mission to the 30 October 2020 Aegean sea earthquake and Tsunami (Izmir, Turkey and Samos, Greece): description of data collection methods and damage. Front Built Environ 8:1–24. https://doi.org/10.3389/fbuil.2022.840192
Aktas YD, Ioannou I, Malcioglu FS, Vatteri AP, Kontoe M, Donmez K, Black J, Kazantzidou-Firtinidou D, Dermanis P, Diri-Akyildiz F (2022b) Traditional structures in Turkey and Greece in 30 October 2020 Aegean sea earthquake: field observations and empirical fragility assessment. Front Built Environ 8(May):1–17. https://doi.org/10.3389/fbuil.2022.840159
Avcil, F. (2023) Investigation of Precast Reinforced Concrete Structures during the 6 February 2023 Türkiye Earthquakes. Sustainability 15:14846. https://doi.org/10.3390/su152014846
Avcil F, Işık E, İzol R, Büyüksaraç A, Arkan E, Arslan MH, Aksoylu C, Eyisüren O, Harirchian E (2023) Effects of the February 6, 2023, Kahramanmaraş earthquake on structures in Kahramanmaraş city. In: Natural Hazards (Issue 0123456789). https://doi.org/10.1007/s11069-023-06314-1
Behrouzi A, Pantoja M (2018) Photo tagging tool for rapid and detailed post-earthquake structural damage identification. In 11th National Conference on Earthquake Engineering 2018, NCEE 2018: Integrating Science, Engineering, and Policy, 4, pp 2372–2380
Binici B, Yakut A, Kadas K, Demirel O, Akpinar U, Canbolat A, Yurtseven F, Oztaskin O, Aktas S, Canbay E (2023) Performance of RC buildings after Kahramanmaraş earthquakes: lessons toward performance based design. Earthq Eng Eng Vib 22(4):883–894. https://doi.org/10.1007/s11803-023-2206-8
Boyoğlu CS, Chike I, Caspari G, Balz T (2023) Assessing the impact of the 2023 Kahramanmaras earthquake on cultural heritage sites using high-resolution SAR Images. Heritage 6(10):6669–6690. https://doi.org/10.3390/heritage6100349
Cetin KO, Ilgac M (2023) Reconnaissance Report on February 6, 2023 Kahramanmaraş-Pazarcık (Mw=7.7) and Elbistan (Mw=7.6) Earthquakes, pp 1–484. https://doi.org/10.13140/RG.2.2.15569.61283/1
Choi J, Park JA, Dyke SJ, Yeum CM, Liu X, Lenjani A, Bilionis I (2022) Similarity learning to enable building searches in post-event image data. Computer-Aided Civil Infrastruct Eng 37(2):261–275. https://doi.org/10.1111/mice.12698
Contreras D, Wilkinson S, James P (2021) Earthquake reconnaissance data sources, a literature review. Earth (switzerland) 2(4):1006–1037. https://doi.org/10.3390/earth2040060
Evangelista MK, Aquino DH, Ramos JA (2022) Utilizing google street view for rapid seismic vulnerability assessment: case study in the city of Manila, Philippines. IOP Con Ser: Earth Environ Sci. https://doi.org/10.1088/1755-1315/1091/1/012037
Furukawa Y, Ponce J (2010) Accurate, dense, and robust multiview stereopsis. IEEE Trans Pattern Anal Mach Intell 32(8):1362–1376. https://doi.org/10.1109/TPAMI.2009.161
Giardina G, Macchiarulo V, Foroughnia F, Jones JN, Whitworth MRZ, Voelker B, Milillo P, Penney C, Adams K, Kijewski-Correa T (2023) Combining remote sensing techniques and field surveys for post-earthquake reconnaissance missions. Bull Earthq Eng. https://doi.org/10.1007/s10518-023-01716-9
Işık E, Avcil F, Arkan E, Büyüksaraç A, İzol R, Topalan M (2023) Structural damage evaluation of mosques and minarets in Adıyaman due to the 06 February 2023 Kahramanmaraş earthquakes. Eng Fail Anal. https://doi.org/10.1016/j.engfailanal.2023.107345
Kijewski-Correa T, Alhawamdeh B, Arteta C, Djima W, Do T, Mejia S, Gartner M, Gunay S, Hassan W, Javadinasab Hormozabad S, Marinković M, Martin A, Merino-Peña Y, Pájaro C, Romão X, Burlotos C, Mosalam K, Robertson I, Rodgers J, Taflanidis A (2021) Preliminary virtual reconnaissance report (PVRR). StEER: M7.2 Nippes, Haiti Preliminary Virtual Reconnaissance Report (PVRR). https://doi.org/10.17603/h7vg-5691
Kijewski-Correa T, Roueche DB, Mosalam KM, Prevatt DO, Robertson I (2021b) StEER: a community-centered approach to assessing the performance of the built environment after natural hazard events. Front Built Environ 7:1–27. https://doi.org/10.3389/fbuil.2021.636197
Kong Q, Allen RM, Allen S, Bair T, Meja A, Patel S, Strauss J, Thompson S (2023) Crowdsourcing felt reports using the MyShake smartphone app. Seismol Res Lett 94(5):2326–2336. https://doi.org/10.1785/0220230027
Lin SL, King A, Horspool N, Sadashiva V, Paulik R, Williams S (2019) Development and application of the real-time individual asset attribute collection tool. Front Built Environ 5:1–14. https://doi.org/10.3389/fbuil.2019.00015
Mertol HC, Tunç G, Akış T, Kantekin Y, Aydın IC (2023) Investigation of RC buildings after 6 February 2023, Kahramanmaraş, Türkiye Earthquakes. Buildings. https://doi.org/10.3390/buildings13071789
Onat O, Deniz F, Özmen A, Özdemir E, Sayın E (2023) Performance evaluation and damage assessment of historical Yusuf Ziya Pasha Mosque after February 6, 2023 Kahramanmaras earthquakes. Structures. https://doi.org/10.1016/j.istruc.2023.105415
Ozkula G, Dowell RK, Baser T, Lin JL, Numanoglu OA, Ilhan O, Olgun CG, Huang CW, Uludag TD (2023) Field reconnaissance and observations from the February 6, 2023, Turkey earthquake sequence. In Natural Hazards, Vol. 119, Issue 1. Springer, Netherlands. https://doi.org/10.1007/s11069-023-06143-2
Rathje EM, Franke K (2016) Remote sensing for geotechnical earthquake reconnaissance. Soil Dyn Earthq Eng 91:304–316. https://doi.org/10.1016/j.soildyn.2016.09.016
Roeslin S, Ma QTM, García HJ (2018) Damage assessment on buildings following the 19th September 2017 Puebla. Mexico Earthq Front Built Environ 4:1–18. https://doi.org/10.3389/fbuil.2018.00072
Rossetto T, D’Ayala D, Gori F, Persio R, Han J, Novelli V, Wilkinson SM, Alexander D, Hill M, Stephens S, Kontoe S, Elia G, Verrucci E, Vicini A, Shelley W, Foulser-Piggott R (2014) The value of multiple earthquake missions: the EEFIT L’Aquila earthquake experience. Bull Earthq Eng 12(1):277–305. https://doi.org/10.1007/s10518-014-9588-y
Schonberger JL, Frahm JM (2016) Structure-from-motion revisited. In Proceedings of the IEEE Computer Society Conference on Computer Vision and Pattern Recognition, 2016-Decem, pp 4104–4113. https://doi.org/10.1109/CVPR.2016.445
Schroeder GN, Steinmetz C, Pereira CE, Espindola DB (2016) Digital twin data modeling with AutomationML and a communication methodology for data exchange. IFAC-PapersOnLine 49(30):12–17. https://doi.org/10.1016/j.ifacol.2016.11.115
Stone H, Putrino V, D’Ayala D (2018) Earthquake damage data collection using omnidirectional imagery. Front Built Environ 4:1–14. https://doi.org/10.3389/fbuil.2018.00051
TMMOB (2023) Tmmob 6 Şubat Depremleri̇ 8.Ay Değerlendi̇rme Raporu. https://www.tmmob.org.tr/icerik/tmmob-6-subat-depremleri-8-ay-degerlendirme-raporu-yayimlandi. Accessed 7 April 2024
TRT Haber (2023) 6 Şubat depremlerinde 53 bin 537 canımızı yitirdik. https://www.trthaber.com/haber/gundem/6-subat-depremlerinde-53-bin-537-canimizi-yitirdik-833953.html. Accessed 7 April 2024
Türkiye Ministry of Environment Urbanization and Climate Change (2024) Damage identification. https://hasartespit.csb.gov.tr/
USGS (2023) The 2023 Kahramanmara¸s, Turkey, Earthquake sequence. https://earthquake.usgs.gov/storymap/index-turkey2023.html
Vuran E, Serhatoğlu C, Timurağaoğlu MÖ, Smyrou E (2024) Damage observations of RC buildings from 2023 Kahramanmaraş earthquake sequence and discussion on the seismic code regulations. Bull Earthq Eng. https://doi.org/10.1007/s10518-023-01843-3
Wald DJ, Quitoriano V, Worden B, Hopper M, Dewey JW (2011) USGS “Did You Feel It?” internet-based macroseismic intensity maps. Ann Geophys 54(6):688–707. https://doi.org/10.4401/ag-5354
Wang T, Chen J, Zhou Y, Wang X, Lin X, Wang X, Shang Q (2023) Preliminary investigation of building damage in Hatay under February 6, 2023 Turkey earthquakes. Earthq Eng Eng Vib 22(4):853–866. https://doi.org/10.1007/s11803-023-2201-0
Whitworth MRZ, Giardina G, Penney C, Di Sarno L, Adams K, Kijewski-Correa T, Black J, Foroughnia F, Macchiarulo V, Milillo P, Ojaghi M, Orfeo A, Pugliese F, Dönmez K, Aktas YD, Macabuag J (2022) Lessons for remote post-earthquake reconnaissance from the 14 August 2021 Haiti earthquake. Front Built Environ 8:1–16. https://doi.org/10.3389/fbuil.2022.873212
Zwegliński T (2020) The use of drones in disaster aerial needs reconnaissance and damage assessment-Three-dimensional modeling and orthophoto map study. Sustainability (Switzerland) 12(15):1–20. https://doi.org/10.3390/su12156080
Acknowledgements
We extend our sincere thanks to Furkan Aydoğan, Ediz Karaali, Yunus Eren Kaya, Görkem Kılıç, Muzaffer Ata Özbilen, and Serhat Erinmez for their exceptional support. Their expertise and commitment were crucial in advancing our project, and we are deeply grateful for their contributions. Their efforts have significantly enhanced the quality and success of our work.
Funding
Open access funding provided by the Scientific and Technological Research Council of Türkiye (TÜBİTAK). The authors declare that no funds, grants, or other support were received during the preparation of this manuscript. The aforementioned plugin was developed voluntarily.
Author information
Authors and Affiliations
Corresponding author
Ethics declarations
Conflict of interests
The authors have not disclosed any competing interests.
Additional information
Publisher's Note
Springer Nature remains neutral with regard to jurisdictional claims in published maps and institutional affiliations.
Rights and permissions
Open Access This article is licensed under a Creative Commons Attribution 4.0 International License, which permits use, sharing, adaptation, distribution and reproduction in any medium or format, as long as you give appropriate credit to the original author(s) and the source, provide a link to the Creative Commons licence, and indicate if changes were made. The images or other third party material in this article are included in the article's Creative Commons licence, unless indicated otherwise in a credit line to the material. If material is not included in the article's Creative Commons licence and your intended use is not permitted by statutory regulation or exceeds the permitted use, you will need to obtain permission directly from the copyright holder. To view a copy of this licence, visit http://creativecommons.org/licenses/by/4.0/.
About this article
Cite this article
Ersoz, A.B., Pekcan, O., Altun, M. et al. Utilizing digital technologies for rapid damage assessment and reconnaissance: the February 6, 2023 Kahramanmaraş-Türkiye earthquakes (Mw 7.7 and Mw 7.6). Bull Earthquake Eng (2024). https://doi.org/10.1007/s10518-024-01925-w
Received:
Accepted:
Published:
DOI: https://doi.org/10.1007/s10518-024-01925-w


