
Abstract
The discovery of non-coding RNAs (ncRNAs) has expanded our comprehension of RNAs’ inherent nature and capabilities. The intricate three-dimensional structures assumed by RNAs dictate their specific functions and molecular interactions. However, the limited number of mapped structures, partly due to experimental constraints of methods such as nuclear magnetic resonance (NMR), highlights the importance of in silico prediction solutions. This is particularly crucial in potential applications in therapeutic drug discovery. In this context, machine learning (ML) methods have emerged as prominent candidates, having previously demonstrated prowess in solving complex challenges across various domains. This review focuses on analyzing the development of ML-based solutions for RNA structure prediction, specifically oriented toward recent advancements in the deep learning (DL) domain. A systematic analysis of 33 works reveals insights into the representation of RNA structures, secondary structure motifs, and tertiary interactions. The review highlights current trends in ML methods used for RNA structure prediction, demonstrates the growing research involvement in this field, and summarizes the most valuable findings.
1 Introduction
Ribonucleic acid (RNA) is a polymer molecule essential for converting genetic information from deoxyribonucleic acid (DNA) into proteins. For a while, this was thought of as the sole role of RNA. However, studies have unraveled other significant functions. One of the first such RNAs discovered by Stark et al. (1978) was RNAse P, a ribozyme that cleaves a precursor sequence of RNA in tRNA molecules. This was followed by Yang et al. (1981), who described small nuclear RNAs (snRNAs), other non-coding RNA that exists in a nucleus and is responsible for splicing. Over the years, the number of functional non-coding RNAs (ncRNAs) discovered has expanded vastly (Wilusz et al. 2009; Wang and Chang 2011; Ulitsky and Bartel 2013; Fu 2014; Kopp and Mendell 2018).
Non-coding RNA has been found to control protein synthesis, regulate transcription and translation, modify and stabilize RNA, and regulate gene expressions at different levels (Doudna and Cech 2002; Meister and Tuschl 2004; Garst et al. 2011; Serganov and Nudler 2013; Mortimer et al. 2014). These diverse functions of ncRNAs take part in many complex biological processes vital for human health, such as immune cell, neural, or muscle development (Sun and Kraus 2015; Mehta and Baltimore 2016; Andersen and Lim 2017; Constantin 2018).
However, RNA functions are not determined solely by information in the nucleotide chain but, similarly to proteins, by the three-dimensional shape into which the given sequence folds (Graf and Kretz 2020). This shape allows RNA to interact with DNA, proteins, lipids (Mańka et al. 2021; Czerniak and Saenz 2021), and other molecules. Therefore, it is essential to know and understand the tertiary structure of RNA as a foundation for the design of potential targeted drugs based on RNA (Childs-Disney et al. 2022). Although numerous ncRNA sequences are available and their numbers increase rapidly (Stephens et al. 2015), their structures are still poorly determined. Along with the underestimation of the role of RNA, this is one of the reasons why, for a long time, the central part of research on predicting biological structures has been focused not on RNA but on the problem of protein structure prediction.
Accurately predicting RNA tertiary structures provides valuable insight into their biological functions. By solving RNA 3D structures, researchers can identify areas crucial for catalysis, regulation, and protein interaction. These functional sites frequently include highly precise arrangements of nucleotides inside the folded structure. Unveiling RNA’s intrinsic ability to generate specialized three-dimensional shapes and selective interactions with other biomolecules allows researchers to use it for therapeutic drug discovery. By knowing the RNA structure, researchers can alter RNA activity in a targeted manner. It enables the rational design of compounds that target functional RNA structures, marking a paradigm shift from traditional protein-centric drug discovery. This significantly widens the possibilities for fighting a wide range of diseases, from neurodegenerative disorders to various types of cancers (Sun and Kraus 2015; Schmitt and Chang 2016).
Some experimental methods to obtain RNA’s atomic coordinates include X-ray crystallography or nuclear magnetic resonance (NMR). These methods, though quite reliable even for long sequences with multiple possible conformations, have several constraints. These include the long time required to gather data, the costs of running the apparatus, or the need for specialized equipment and personnel to perform the experiments (Kotar et al. 2020). Knowing these limitations, numerous works have turned to in silico methods of predicting RNA’s structures. The leading paradigm for early solutions was to identify a structure with minimum free energy (MFE), as it was the most likely state in which a molecule would exist, similar to proteins (Anfinsen 1973). Following this approach, various algorithms have been proposed and tested to solve both secondary and tertiary structure prediction problems. These approaches are based on thermodynamic simulations evaluated by dynamic programming approaches (Mathews and Zuker 2004; Eddy 2004; Havgaard et al. 2005), statistical mechanics (Ding and Lawrence 2003; Mathews 2004; Ding et al. 2005), or genetic algorithms (Shapiro and Navetta 1994; Chen et al. 2000; Taneda 2012), among others.
Although they achieved satisfactory results, especially for secondary structure prediction, these methods have failed to achieve significant improvements in the accuracy and speed of predicting the RNA structure. As an alternative, with development in both optimization methods and computational possibilities, machine learning (ML) based methods started being utilized for various parts of the prediction pipeline. At first, these methods have not received much attention due to comparatively low prediction scores. This was partially due to the lack of higher volumes of data available for the training part required by ML algorithms. However, the amount of available data has progressively grown over the years. In recent years, ML-based methods have surpassed the capabilities of classical algorithms and are now the main active area of research on RNA structure prediction. Taking this into account, the main contribution of this review is to describe and compare developments in the ML-based RNA structure prediction field, with a particular focus on deep learning (DL) based methods. The specific machine learning approaches used, including classical ML methods, recurrent neural networks, and reinforcement learning, have been gathered and described, showing a clear shift toward utilizing different types of neural network architectures in recent years.
In this context, it is worth mentioning that both modern protein and RNA structure predictions share deep learning techniques, utilizing models like CNNs and transformers for capturing spatial dependencies and sequence-structure relationships. Both fields benefit from pre-training on large datasets and leveraging evolutionary information for feature extraction. This similarity can be seen in solutions like DeepFold (Pearce et al. 2022a) and DeepFoldRNA (Pearce et al. 2022b), which use common methodologies for both problems. However, RNA structure prediction is uniquely challenging due to the dynamic nature of RNA chains, their varied structures, and the limited high-resolution structural data compared to proteins. While protein secondary structures consist of alpha-helices and beta-sheets, RNA secondary structures comprise various structural elements such as hairpins, bulges, internal loops, pseudoknots, and multi-branch loops. This plethora of RNA structural motifs means that, in practice, there may be an insufficient number of suitable templates for efficient conformational sampling due to the limited size of the available resolved RNA structures.
Several recent studies provide insight into the growing landscape of RNA structure prediction methods and their potential for drug discovery. In particular, Sato and Hamada (2023) gives a compelling overview of the challenge and its relevance in drug development but lacks a thorough analysis of specific approaches. Further, Zhang et al. (2022) provides a detailed description of the problem, encompassing biological and chemical considerations, but does not discuss particular algorithms or results. Then, Zhao et al. (2021) presents machine learning algorithms for RNA structure prediction in an organized manner but does not cover recent deep learning solutions. In contrast, Yu et al. (2022) provides a thorough analysis of deep learning solutions, but it lacks a qualitative comparison of the works. Finally, Wang et al. (2023b) provides a broad perspective of RNA-related approaches though solely addressing 3D structure prediction.
The purpose of this review is to contribute to the area by presenting a systematic approach as well as knowledge updates on machine and deep learning methods. It concentrates on algorithmic features and provides a comprehensive examination of selected methods and architectures. Furthermore, a full comparison of the addressed subproblems, methodology, and achieved results is provided. This comprehensive approach will provide researchers with significant insights into the possibilities of machine learning and deep learning in RNA structure prediction.
This review organizes the analyzed works based on the specific structure prediction problem they tackle, whether secondary or tertiary. By exploring the research presented, this review aims to compare the architectures and results of the methodologies used and identify potential research gaps. The subsequent sections of this paper are organized as follows. Section 2 introduces the details of the RNA structure and its representations, including a discussion on the secondary structure and the pairing of the bases, as well as the tertiary structure. Section 3 introduces the underlying methods and algorithms utilized for RNA structure prediction. Section 4 presents an overview of the studies together with their availability. Section 5 provides a detailed discussion of the advantages and disadvantages of solutions for the prediction of secondary and tertiary structures. The paper is then concluded in Sect. 6, summarizing key findings and potential research gaps.
2 RNA structure and representations
This section is intended to familiarize the reader with the structure of RNA and its common representations. In particular, the secondary and tertiary structures are described separately to underlie their specific natures. The goal of explaining these differences is to highlight the vastly differing nature of the prediction problem to be solved, and thus demonstrate the need to separate the methods used in analyses.
2.1 Secondary structure and base pairing
RNAs are molecules created from a chain, arranged in the 5′ to 3′ direction, of four nucleotides distinguished by their nitrogenous bases—guanine (G), uracil (U), adenine (A), and cytosine (C). Similar to DNA, the secondary structure of RNA is defined by canonical base pairing. These include the Watson–Crick pairs (A-U and G-C) and the wobble base pair (G-U). These pairs are established via hydrogen bonds and form a structure in which subsections of paired nucleotides form a helix, while unpaired bases can form various secondary motifs, distinguishing RNA’s from DNA’s structures. The secondary structure of RNA can be represented as a 2D figure of connected base pairs, as shown in Fig. 1.

An example of the RNA secondary structure based on 6OPE tRNA molecule. Different structural motifs are colored for visual distinction (in blue—stems, in yellow—multiloops, in orange—hairpin loops, and in gray—dangling ends). Structure and visualization obtained from bpRNA (Danaee et al. 2018). (Color figure online)
However, it has been observed that the RNA structure, unlike that of DNA, can consist of a wider variety of base pairs (Zhao et al. 2018). Three groups of special base pairs can be distinguished, the most commonly occurring being non-canonical base pairs. Up to 40% of all base pairs in an RNA molecule can consist of base pairs other than Watson–Crick pairs or the wobble pair (Leontis and Westhof 2001). Another type of atypical base pairs are triples—clusters of three RNA nucleobases that interact edge to edge by hydrogen bonding, mostly creating base pairs from the central base (Almakarem et al. 2012). Additionally, G-quadruplexes are increasingly important—structures that consist of four Hoogsteen-bound guanines as planar assemblies (Lorenz et al. 2013).
These various interactions between nucleotides describe the secondary structure of the RNA strand. Due to the resulting shape of the 2D view of the RNA molecule, various reoccurring motifs have been identified (Hendrix et al. 2005), namely:
-
Single-stranded regions—sequences of unpaired nucleotides;
-
Helices—RNA is composed in large part of Watson–Crick pairs creating A-form double helices, though other helical forms have been observed;
-
Hairpin loops—by the SCOR database classification, hairpin loops must close with a Watson–Crick pairing and have a length between 2 and 14 nucleotides;
-
Internal/bulge loops—separate helical RNA into two segments with residues not paired canonically in at least one strand of the stem;
-
Junction loops/multiloops—formed at the intersection of at least three double helices separated by single-strand sequences;
-
Pseudoknots—structures formed when a single-stranded region of RNA in the loop creates a base pair with complementary nucleotides elsewhere in the RNA (Brierley et al. 2007).
Performing in silico calculations to predict these characteristics of the secondary structure requires appropriate data representations for both traditional and machine learning-based methods. Let n denote the length of an RNA molecule. The simplest form is to compose a set of base pairs indices (i, j) where \(0 \le i< j < \le n\). However, one of the most popular representations is the so-called “dot-bracket” notation introduced by the ViennaRNA package (Lorenz et al. 2011). It is a plain text format using ‘.’ to represent unpaired bases and matched parentheses for canonical base pairs. The format was later extended to cover pseudoknots by introducing square, curly, and angle brackets. A minimalistic representation like this often speeds up computations. A more graphical method to represent the data is to create a contact table (CT table). It is an \(n \times n\) square matrix, where each cell represents an interaction between nucleotides at given indices. For certain algorithms, the RNA structure may also be represented as a graph, where nucleotides are treated as nodes, and edges display base pairing. A visualization of the aforementioned representations is shown in Fig. 2.

An example of the RNA secondary structure representations based on 6OPE tRNA molecule. The dot-bracket notation (left) displays connections between nucleotides using dots that represent unpaired bases, and matching pairs of opening and closing brackets that represent a connection between given nucleotides in the chain. A contact table (right) is a matrix where x-axis and y-axis represent indices of nucleotides in the sequence. The connection between a given pair of bases is marked by putting a “true” value at a cell indicated by their indices intersection (yellow color on the figure). (Color figure online)
2.2 Tertiary structure
Due to secondary interactions, the RNA molecules fold onto themselves and create three-dimensional conformations. Therefore, the tertiary structure refers to defining the spatial coordinates of atoms in the RNA molecule and the spatial relationships between them (tertiary interaction), as represented in Fig. 3.

An example of the RNA tertiary structure based on 6OPE tRNA molecule. The curved line represents the sugar-phosphate backbone, while nucleobases are portrayed by their nitrogenous rings. Visualization obtained from PDB (Berman and Henrick 2003)
The tertiary conformation of an RNA molecule is stabilized by networks of various interactions, and numerous factors play a role in molecule folding, especially osmolytes and ligands, including metal ions and proteins. However, the most critical factors for the final shape of an RNA molecule are stacking interactions. The bases of aromatic nucleic acids are planar, allowing them to stack at contact distance (\(\sim\) 3.4 Å), maximizing van der Waals interactions. Base stacking interactions are more important than hydrogen bonds for the structural stability of nucleic acids in aqueous solution (Yakovchuk et al. 2006).
Analysis of the tertiary structure of RNA has shown that certain shapes of molecules appear to be reoccurring. These shapes, or motifs, are independent of the context in which they occur (Moore 1999), and studies have shown that they often define specific functions of the molecule (Ferhadian et al. 2018; Ross and Ulitsky 2022; Xu et al. 2022). Some motifs are widely recognized, including U-turns, tetraloops, or ribose zippers.
An essential feature of the RNA structure is that it is dynamic. The shape acquired by a specific chain of nucleotides is, in theory, the most stable (or thermodynamically favored) structure, also known as the minimum free energy (MFE) structure. However, the so-called folding landscapes are rugged and exhibit multiple local energy minima (Shcherbakova et al. 2008). Because of this, an RNA molecule can fold into different conformations depending on the environment.
In silico representation of the structure of RNA molecules often originates from a PDB file format, stored in Protein Data Bank (PDB) (Berman and Henrick 2003), one of the most extensive databases for large biological molecules. This extensible plain text format stores information about atomic orthogonal coordinates and polymer division, among others. Based on the choice of the prediction method, further representations are obtained, including graph representations (Townshend et al. 2021), distance and angle maps (Pearce et al. 2022b), or modeling the molecule as a 3D box (Li et al. 2018).
3 Methods and algorithms
This section introduces the underlying methods and algorithms that govern RNA structure prediction. It is divided into five parts—an overview of classical algorithms utilized for RNA structure prediction (Sect. 3.1), an overview of the machine and deep learning methods utilized in analyzed solutions (Sects. 3.2 and 3.3), a description of interpretability of the methods (Sect. 3.4) and a computational complexity description of RNA structure prediction problem and its solutions (Sect. 3.5).
3.1 Classical methods of predicting RNA structure
Classical methods have adopted a few paradigms that led the structure prediction of RNA. One way of searching for RNA structures is to utilize dynamic programming methods, as did Zuker in one of the most popular solutions in the field—Mfold (Zuker 2003). Dynamic programming can solve complex problems by breaking them down into simpler subproblems, solving each of them once, and storing the solutions to avoid redundant computations. This method requires a certain optimization goal, and in the case of RNA structure prediction, one of the most popular goals is to find a structure with minimal free energy in a molecule. The solutions based on dynamic programming generally calculate the free energies of certain substructures, store the results, and repeat the process for increasing the size of the substructures. The results are stored in a \(n \times n\) matrix, where n is the number of nucleotides in a structure, and the minimum free energy structure is determined by analyzing the minimum energy pairings in the matrix.
Another classical approach applied to RNA secondary structure prediction is the Greedy Randomized Adaptive Search Procedure (GRASP), which involves iteratively constructing and refining potential structures. The procedure starts with constructing basic structures using a greedy heuristic to select energetically favorable base pairings, followed by randomization to ensure diversity. Local search algorithms are then used to refine these structures, iteratively making minor alterations to further minimize free energy. Several iterations of this mix of local optimization and greedy and randomized construction produce a range of possible structures. The projected RNA secondary structure is chosen among the best structures, usually the ones with the lowest free energy. This strategy increases the possibility of finding the most stable RNA structure by balancing effective optimization and in-depth solution space search. One of the research works using this algorithm is the work of Fatmi et al. (2017).
In the same article, another class of methods for RNA structure prediction, namely genetic algorithms (GA), are introduced. These approaches predict RNA secondary structure by modeling evolution: creating an initial population of structures, assessing their fitness based on free energy, and iteratively applying selection, crossover, and mutation to build new generations. This approach balances exploring many structures and exploiting the best solutions, eventually settling on the structure with the lowest free energy. GAs help optimize RNA folding predictions because of their capacity to handle a large search space and avoid local minima. These methods are still used in recent solutions, as displayed by Shahidul Islam and Rafiqul Islam (2022).
3.2 Machine learning algorithms predicting RNA structure
A multitude of different machine and deep learning approaches have been proposed for solving RNA structures. This section will briefly introduce the architectures used in the works we cover in this paper.
From classical machine learning methods, a passive-aggressive online learning algorithm (PA) was the earliest used approach. As an online learning algorithm, it operates incrementally, processing one training example at a time. The update rule for the PA algorithm involves adjusting the weight vector \(\textbf{w}\) based on the example \((x_t, y_t)\) at a specific training step t. If the example is predicted correctly, the model remains passive with no change. However, upon a poorly predicted example, the algorithm updates its weight vector aggressively to correct the mistake. The prediction itself happens by multiplying the weight vector by the input \(x_t\) vector, while the loss functions used are mostly hinge loss (for classification) or squared loss (for regression). This method has been introduced in Crammer et al. (2006).
Two other classical approaches were used by Yonemoto et al. (2015). First, stochastic context-free grammar (SCFG) is an extension of context-free grammar that adds probabilities to the production rules. It is formally defined as \(G = (V, \alpha , S, R, P_p)\), where:
-
V—non-terminal alphabet, in other words, symbols that generate the next set of symbols;
-
\(\alpha\)—terminal alphabet, in case of RNA that could be its bases (A, C, G, T);
-
S—a sequence start symbol;
-
R—a set of rewrite rules called production rules. It specifies how certain symbols from the non-terminal alphabet can produce the next set of symbols;
-
\(P_p\)—set of probabilities associated with each production rule.
Thus defined algorithm allows for a generative process of building the RNA structure representation. The second classical approach used in this work is the conditional random field (CRF), which enhances the solution by being a discriminative model. It is an undirected probabilistic graphical model representing the conditional probability of a specific sequence of labels Y, given a sequence of observations X. This allows them to capture contextual dependencies among the labels, making them particularly effective for tasks like part-of-speech tagging, named entity recognition, and image segmentation. A detailed introduction for CRFs has been created in Sutton and McCallum (2010).
The last classical solution was introduced by Su et al. (2019), and utilized Positive-Unlabeled (PU) Learning algorithm with a logistic regressor. PU Learning algorithm is a type of semi-supervised learning where a machine learning model is trained using a dataset that contains only positive and unlabeled examples, without explicit negative examples. The algorithm typically follows a two-step process, where it first identifies a reliable subset of negative examples from the mixed set U using the information from the positive set P. Then, it iteratively constructs predictive models using these positive and “negative” examples, ultimately selecting the best-performing model from these iterations. This solution was first introduced for building text classifiers in Liu et al. (2003).
3.3 Deep learning architectures unraveling the RNA data
Long-Short Term Memory (LSTM) architecture was the most commonly used deep learning technique for RNA structure prediction. Its original use came from the natural language processing field and was introduced by Hochreiter and Schmidhuber (Hochreiter and Schmidhuber 1997) as a remedy for forgetting long-term information along with vanishing and exploding gradient problems in gradient back-propagation through time. This architecture consists of a cell state that acts like a memory, holding important information from past inputs, and specialized gates that control information flow. The “Forget Gate” decides which information to forget from the cell state, while the “Input Gate” is responsible for adding new information to the cell. Additionally, the “Output Gate” decides what information should be given out at the current time-step. This combination allows the LSTM architecture to not only understand the input, but also to remember long-term relationships between the inputs. A version of these networks, called Bi-LSTM, is also capable of iterating through the input sequence from the end to the beginning.
Another frequently used deep-learning component in the RNA structure prediction problem is the Convolutional Neural Network (CNN). Widely popularized by its use in LeCun et al. (1989), CNNs, at their core, utilize convolution layers that act as filters to scan the image, identifying patterns and features like edges, lines, and shapes. This happens by sliding the convolution window across the image, looking for specific patterns at each location. Additionally, pooling layers downsample the data, reducing its size and complexity while preserving important features. By stacking these convolutional and pooling layers, the network can learn increasingly complicated patterns. These components are widely used for RNA prediction in two popular architectures—a ResNet (He et al. 2016), which groups the convolutional blocks into residual blocks that add their input to the output, and a U-Net (Ronneberger et al. 2015) that first downsamples and then upsamples back the data with additional “skip connections” at each depth.
The transformer architecture, introduced in Vaswani et al. (2017), is characterized by its reliance on attention blocks, allowing the model to focus on specific parts of an input sequence relevant to the current part being processed. An attention block consists of three sets of vectors derived from the input sequence—queries that represent the model’s current focus, keys that represent different parts of the input sequence, and values that carry the actual information from each part of the input sequence. The attention block assigns a score to each possible relationship between a query and a key. This score indicates how significant a specific portion of the input (represented by the value) is to the current focus (represented by the query). Transformers use these attention blocks as an encoder-decoder architecture. The encoder uses the input sequence to generate a contextual representation for each word. In this case, attention allows the encoder to understand how each word in the sequence relates to the others, capturing long-range dependencies. The decoder generates the target sequence based on the encoder’s output. Attention in the decoder allows it to focus on relevant parts of the encoded context while generating each word in the target sequence. Building on top of the transformer architecture, large language models (LLMs) emerged. These models utilize the same ideas, but are defined by very complex structures with billions of parameters, and are trained on massive collections of text data. During this training, LLMs acquire sophisticated statistical models of the data that capture subtle connections between the learned tokens.
Learning on graphs is another interesting deep learning approach. Graph Neural Networks (GNN) provide a powerful approach to deep learning challenges, in which data is organized as nodes (entities) connected by edges (relationships). Using a message-passing paradigm, GNNs take advantage of graphs’ inbuilt connection. Each layer’s nodes collect information from their near neighbors along the edges. This information may include node characteristics as well as messages exchanged between connected nodes. Aggregation can include summing, averaging, or more advanced neural network layers. Based on the aggregated data, each node updates its internal representation to include not just its own qualities but also the contextual effect of its neighbors. There exist a few paradigms on how to train those networks, like Graph Convolutional Networks (GCNs) (Kipf and Welling 2017), Graph Attention Networks (GATs) (Veličković et al. 2018), or Message Passing Neural Networks (MPNNs) (Gilmer et al. 2017), which is more of a general framework.
While it is more of a paradigm than a network design, Deep Reinforcement Learning (DRL) combines the capability of deep neural networks with reinforcement learning, allowing agents to handle complicated decision-making tasks in high-dimensional state spaces. Unlike traditional reinforcement learning, which uses handcrafted features, DRL uses deep neural networks to directly transfer raw sensory inputs (for example, picture pixels from a camera) to value or policy functions. These networks can be taught using approaches like deep Q-learning (Mnih et al. 2015) or policy gradient (Sutton et al. 1999), where the agent receives scalar rewards for its actions and attempts to maximize expected future rewards. DRL’s power stems from its capacity to discover detailed correlations within the environment via function approximation with deep neural networks.
3.4 Interpretability
While powerful, deep learning methods lack interpretability. They often function as so-called black boxes, making it difficult to understand how they arrive at their predictions (Saeed and Omlin 2023). This lack of explanation hinders the ability to validate predictions, improve model design, and gain valuable biological insights, which are often more important than just the predictions (Zhou and Troyanskaya 2015).
Methods based on different architectures may be partially interpreted through various approaches. Deeper layers of convolutional neural networks capture higher-level visual constructs and naturally retain spatial information. Visually interpreting a network can be achieved by creating a Class Activation Map (CAM) to get the features from the last convolution layer and measure their activity when predicting the output probabilities. LSTMs and other recurrent neural networks (RNNs) were particularly known for their lack of interpretability. A significant step forward was the invention of the attention mechanism (Vaswani et al. 2017), which assigns values corresponding to the importance of the different parts of the time series according to the model. While such approaches explain basic DL architectures, advanced DL models pose several challenges due to their complexity and the complicated connection structure (Choo and Liu 2018).
Although there are generic strategies for explaining model outputs, such as LIME (Ribeiro et al. 2016) and SHAP (Lundberg and Lee 2017), RNA structure prediction could benefit from an approach comparable to in silico mutagenesis. This entails selecting a specific data point X and systematically changing each feature (e.g., modifying individual nucleotides) while maintaining all others fixed and monitoring how the network’s output changes. This is simple to grasp but computationally expensive because the model must be rerun after each mutation. It is critical to understand that these explanation approaches are not causal models which seek to uncover cause-and-effect relationships. While interpreting a model can highlight critical aspects and provide hypotheses, actual causal knowledge requires experimental validation.
3.5 Computational challenges
The accurate prediction of RNA structure is a severe computational challenge. Classical structure prediction approaches that use dynamic programming algorithms, such as the Nussinov algorithm (Nussinov and Jacobson 1980) or Zucker’s algorithm (Zuker 1989) have a time complexity of \(O(n^3)\), where n is the RNA sequence length. This cubic complexity results from evaluating all possible base pairings inside the sequence using dynamic programming techniques. Then, Frid and Gusfield (2010) employed the Four-Russians Speedup approach, which reduced the complexity to \(O\big (\frac{n^3}{\log n}\big )\). However, the problem becomes considerably more prominent when the system must also predict pseudoknots. In particular, Rivas and Eddy (1999) developed such a solution with the worst time complexity of \(O(n^6)\).
While dynamic programming has a well-defined complexity, other techniques, such as the Greedy Randomized Adaptive Search Procedure (GRASP), typically include iterative procedures with evaluations at each step. The computational complexity of Genetic Algorithms (GAs) is more complicated than that of other algorithms since it is determined by many factors, including population size (p), number of generations (g), and fitness function assessment (f(x)), which together give \(O(p \cdot g \cdot f(x))\) complexity. The last part of the equation represents the complexity of evaluating the “fitness” of a single individual (solution) within the population. The fitness function’s complexity can vary depending on the specific problem. In RNA structure prediction, the fitness function typically assesses how well a predicted structure folds using parameters such as base-pairing probabilities and minimum free energy. This function may be more or less computationally expensive at the cost of overall accuracy, so determining the total complexity is impossible.
Deep learning models for RNA structure prediction offer high accuracy but come with their own computational costs. The complexity of the model is determined by its architecture (number of layers and neurons), training method (epochs and batch size), optimization algorithm, and the activation functions used. This complexity may exceed classic methods like dynamic programming due to the required training. However, researchers continually develop strategies for more efficient network topologies, hardware advancements, and optimized training algorithms to overcome this difficulty. Furthermore, after a model has been trained, the computational cost for inference is significantly decreased, as is the time complexity, thanks to high parallelism and the usage of GPUs. Deriving a standard “big O” notation formula is not really feasible for deep learning algorithms, as their end of execution for training depends on the algorithm’s convergence rather than the raw number of data. Modern deep learning architectures’ complexity is commonly evaluated by the total number of parameters of the network or the number of mathematical operations involved. A more in-depth investigation of deep learning models complexity has been presented in Hu et al. (2021).
4 Overview of the studies
This section gives an overview of the works found for this SLR. The description has been divided into four sections—an aggregated analysis of the studies (Sect. 4.1), works on secondary structure prediction (Sect. 4.2), works on tertiary structure prediction and scoring (Sect. 4.3), and methods availability (Sect. 4.4).
4.1 Aggregated analysis
The primary search, which encompassed papers published before 30.09.2023, resulted in 52 works found using the Web of Science and 243 works found via Google Scholar. The subsequent filtering steps were divided into three steps. The initial selection yielded 74 works by removing duplicated entries and evaluating them based on metadata exclusion criteria. The intermediate selection focused on removing secondary studies and evaluating substantive exclusion criteria by reading titles, keywords, and abstracts of the works, which resulted in 44 papers. The final selection consisted of reading and evaluating the studies using the substantive exclusion criteria, which provided the final list of 33 works analyzed in this review. The full description of eligibility criteria and search strategy is available as supplementary material (Online Resource 1). The supplement enlists trusted publishing sources, outlines the search string criteria, describes the works selection procedure and data extraction strategy, and presents the exclusion criteria. The selection pipeline is presented in Fig. 4.
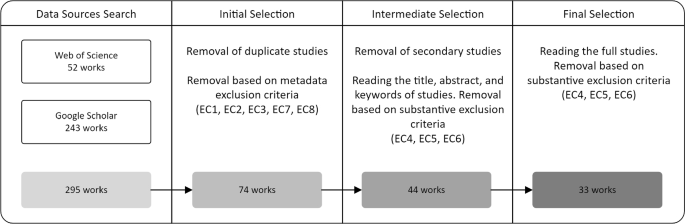
The paper selection pipeline displaying the process of searching and filtering works relevant for this review. Each step of the pipeline shows the used filtering procedures, the relevant exclusion criteria, and the number of resulting works in gray boxes (see Supplementary material for a full description of eligibility criteria and search strategy)
Various approaches and methodologies have been used to utilize machine learning for the prediction of RNA structures, including convolutional neural networks, recurrent neural networks, and graph-based algorithms. As seen in Fig. 5, the machine learning methods used have completely shifted from classical ones (such as conditional random fields (CRF) and passive-aggressive online learning) towards various deep learning-based methodologies, with recurrent neural networks (RNN) and convolutional neural networks (CNN) dominating the field in recent years.
Figure 6 displays the cumulative sums of articles published over the years, split by the problem being solved—secondary or tertiary structure prediction and scoring. Aside from the significant overall increase in the number of works published, methods trying to predict the actual 3D structure started being developed. This has become possible due to higher volumes of data available, as well as due to the increase in computing power and the developments in the field of machine learning itself.
Analyzed works often share the datasets used for training and validation. Throughout the literature, five datasets were identified as being commonly used. The most reoccurring dataset, bpRNA (Danaee et al. 2018), contains descriptions of loops, stems, and pseudoknots, along with the positions, sequence, and flanking base pairs of every structural feature. It contains over 100,000 single-molecules with their secondary structures, and at the time, it was approximately 20 times bigger than already existing datasets. The second most commonly used dataset, RNAStralign (Tan et al. 2017), contains over 37,000 structures divided into homologous families based on the classifications in the source databases. RNAStralign is a structure database and a multiple sequence alignment database, allowing broader analysis of the dependencies within structures. Other datasets include ArchiveII (Sloma and Mathews 2016), commonly used for benchmarking due to covering multiple RNA families, RNAStrand (Andronescu et al. 2008), which adds a user-friendly webserver for searching and analyzing structures, and Rfam (Griffiths-Jones et al. 2005) that provides a comprehensive resource for understanding and classifying ncRNAs based on their sequence, structure, and function. The availability of these datasets and the underlying data volume allowed for using deep learning methods for secondary structure prediction. Additional information, such as multiple sequence alignment, allows for a more profound and unified understanding of relations within the structures. However, the datasets come with certain limitations, the biggest one being the RNA family coverage. While datasets like bpRNA and ArchiveII contain ten different families, most structures in all the datasets are from ribosomal RNAs (rRNAs) and transfer RNAs (tRNAs). This limits the potential of machine learning algorithms to discover the RNA structure space. Moreover, the datasets may contain redundant structures, which, when unfiltered, may yield false results on trained methods.

A cumulative sum graph illustrating the number of papers used for RNA structure prediction grouped by the specific machine learning methods, showing the development over time. The y-axis denotes the total number of publications accumulated, while the x-axis denotes the year. The total number exceeds the number of papers found, as some solutions may use several machine learning methods

A cumulative sum graph illustrating the number of papers used for RNA structure prediction grouped by the problem tackled, showing the development over time. The y-axis denotes the total number of publications accumulated, while the x-axis denotes the year
4.2 Secondary structure prediction
The quest for accurate prediction of the secondary structure is still dominating the field, since the literature search provided a total of 28 works (out of 33 analyzed works) focused on utilizing machine learning for this problem. The research found has been summarized in Table 1; however, the reader should be aware that the findings of these articles cannot be directly compared due to variations in their test datasets and methodologies.
The paper by Zakov et al. (2011) was one of the initial studies that was found to achieve promising results by using ML methods. It proposed using a modified version of Collins (2002) discriminative structured-prediction learning framework based on Hidden Markov Models (HMM), which was primarily used for natural language processing (NLP). The modification was implemented by coupling a passive-aggressive online learning algorithm proposed by Crammer et al. (2006), whose function was an appropriate weight update for cost-sensitive learning with structured outputs. The main reason for using these algorithms was their ability to adapt well to large feature sets, as this was the main obstacle to RNA structure prediction at the time. The models created by Zakov’s team induced up to 205 thousand features (70 thousand after ridding of zero-valued parameters after training). An important point to mention is that the secondary structure prediction problem defined by the team was omitting pseudoknots and non-canonical base pairs in the task. The dataset used by Zakov’s team came from the work of Andronescu et al. (2010) and contained 3245 distinct structures of lengths between 10 and 700 nucleotides, which in turn was based on RNA STRAND dataset (Andronescu et al. 2008). On the development set, the best-obtained results were sensitivity at 83. 8%, precision (referred to as PPV) at 83.0%, and F1-score equal to 83.2%, which at the time of publication were state-of-the-art results.
A more recent example of the use of classical machine learning methods can be found in Su et al. (2019). It introduced a Positive-Unlabelled (PU) data-driven framework called ENTRNA. The team considers not only the sequence itself but also expands the input features by free energy, sequence, and structural motifs, and a new feature called Sequence Segment Entropy (SSE), which measures the diversity of RNA sequences. PU learning requires two datasets: a positive labeled set P and a mixed, unlabeled set U. The learning process generally involves two steps. First, an algorithm is trained to identify negative examples in the set U based on knowing positive examples from the set P. Having a true set P and self-labeled negative examples from the set U, the second step is to build complete predictive models iteratively and choose the best-performing one. In their work, Su’s team generated the unlabeled set U by computationally creating synthetic RNAs. Positive data was prepared as three separate datasets for algorithm training, cross-validation, and blind testing. For each secondary structure, 100 sequences were generated by three different RNA inverse folding algorithms—RNAinverse (Hofacker et al. 1994), incaRNAtion (Reinharz et al. 2013), and antaRNA (Kleinkauf et al. 2015). Two separate experiments were conducted, one on pseudoknot-free structures and the other on pseudoknotted RNAs. The underlying classifier of ENTRNA is a logistic regressor that predicts the foldability of molecules using 11 features (different for the two experiments). The researchers report that the sensitivity of their solution is equal to 80.6% for the first experiment and 71.0% for the second experiment (on test datasets).
Deep learning methods for predicting the secondary structure of RNA have seen the highest increase in popularity in recent years, partially due to previously limited knowledge, hardware, and lack of data. Wang et al. (2019a) introduced DMfold, which outperformed previous state-of-the-art machine learning-based algorithms. The core of the solution, called the Prediction Unit (PU), is a sequence-to-sequence model based on a bidirectional LSTM network used as the encoder with fully connected layers used as the decoder. As a second step of the solution, the authors have introduced the so-called Correction Unit (CU), which reduces the errors produced by the PU. The final sequence is a dot-bracket style notation of the secondary RNA structure. The data used for training and testing comes from the public database of Mathews lab, ArchiveII (Sloma and Mathews 2016), comprising 2975 known RNA sequences and structure pairs, and the problem definition included pseudoknots. The prediction results of the test set were divided by RNA families, in terms of F1-score, the method achieved 93.7% for tRNAs, 92.7% for 5sRNAs, 70.6% for tmRNAs, and 61.9% for RNaseP, which at the time of publication exceeded the results of previous methods.
In the same year, Zhang et al. (2019) proposed a solution called CDPfold based on a convolutional neural network (CNN) paired with Dynamic Programming (DP). The network consists of three convolution layers, each utilizing sixteen 3 \(\times\) 3 convolution kernels. The output layer is then mapped to three labels of the dot-bracket representation using two fully connected layers. The data comes from the public database of Mathews lab, NNDB (Turner and Mathews 2009), and is first represented as n \(\times\) n matrix, where n is the length of the RNA sequence. The matrix values are set according to the number of hydrogen bonds between bases, that is, 2 for paired A and U, 3 for paired G and C, x \((0< x < 2)\) for the wobble pair, and 0 otherwise. Due to the size of the convolutions and RNA sequences, the matrix is split into windows of length d, that is, matrices of size d \(\times\) n. Additionally, the resulting dot-bracket sequence is then corrected using a probability sum algorithm. The prediction results of the test set were divided by RNA families, and in terms of F1-score, the method achieved 90.5% for tRNAs, 91.1% for 5sRNAs, and 82.3% for srpRNAs, which makes the method slightly worse performing than that of Wang’s team.
In their paper, Fu et al. (2022) proposed UFold—a method utilizing a different CNN architecture to solve secondary structure prediction problems. Due to the variable length of the RNA sequences, the team has decided to use a U-Net architecture, which is a fully convolutional neural network (Ronneberger et al. 2015). The most important feature of this architecture is the ability to produce an output matrix of the same size as the input matrix without setting a fixed input length. Fu and the team used this fact to input the model with 17 channels of size \(n \times n\), where 16 channels come for a Kronecker product of \(n \times 4\) representation of the sequence (each base in a separate row), with the 17th channel added to overcome the sparsity as the base pairing possibilities used in CDPfold. The output is a one-channel n \(\times\) n matrix containing probabilities of pairing between each pair of bases and is scored against the ground truth of the paired bases. The algorithm was trained and tested on a few datasets, including RNAStralign (Tan et al. 2017), ArchiveII (Sloma and Mathews 2016), and bpRNA-1 m (Danaee et al. 2018), among others. The model achieved, in terms of F1-score, between 65.4% on bpRNA-1 m to 91% on the ArchiveII test set. It is worth noting that both results, which may seem lower than previously described works, are measured on more extensive and complicated datasets, reaching results higher than previous state-of-the-art methods, such as MXfold2 or SPOT-RNA.
Among the models based on convolutional neural networks, the highest reported scores were achieved by Booy et al. (2022). The team utilized a ResNet architecture (He et al. 2016) that consists of N residual blocks containing convolution layers, batch normalization, and an activation function (leaky ReLU in the case of Booy’s model). Additionally, within each residual block, the input size of the matrix does not change its shape, which allows for so-called “skip connections”—a concatenation of the input to the convolution blocks to their output. The secondary structure target was therefore formulated as a binary \(L \times L\) matrix, where L is the length of an RNA sequence, and each output cell of the matrix represents binary information on whether two bases are paired. The input to the network is represented as an \(L \times L \times 8\) tensor, where the additional dimension is a one-hot representation of eight potential relations between bases. Six channels show possible combinations of bases (A, U), (U, A), (U, G), (G, U), (G, C), (C, G). One channel indicates the same nucleotide in a sequence, or in other words, is a diagonal line for every index \(i = j\), and one channel represents pairs of bases that cannot form a bond due to their short distance, non-valid base combination, or other constraints. Due to the visual nature of this representation, an overview of Booy’s team solution is shown in Fig. 7.

A general illustration of the solution created by Booy et al. (2022). An input sequence is converted into a defined representation that a CNN-based prediction model can process. The output target matrix displays a contact map that is post-processed for obtaining the final secondary structure. (Own work based on Booy et al. (2022))
Different standard datasets were used to train and evaluate the architecture. The first model was trained on 80% of the RNAStralign dataset (Tan et al. 2017), with a randomly chosen secondary structure when more than one was available for a given RNA chain. The other 20% of the data was split into validation and test sets with stratification over RNA families. This enabled a fair comparison of the results achieved with Chen et al. (2020). The second dataset utilized in this work was AchiveII (Sloma and Mathews 2016), which was additionally used for the first trained model for evaluation. Other datasets used in this work included bpRNA (Danaee et al. 2018) and bpRNA-new (Sato et al. 2021), which was used for family-wise cross-validation. The best results on these datasets are shown in detail in Table 2.
As seen, most recent works have shifted their focus towards using convolutional neural networks. One of the exceptions is the work of Castro et al. (2020) that utilized graph neural networks in combination with variational autoencoders. The main problem to solve in this approach was to find an embedding given an initial set of graphs that satisfies the given properties: faithfulness—graphs near each other (in terms of graph edit distance) should be close to each other in the embedding space; smoothness—the embedding should be smooth in terms of a real-valued meta-property \(M = \{m_1, m_2,\)...\(, m_n\}\), where \(m_i \in \mathbb {R} ^n\); invertibility—new graphs should be possible to be generated from interpolated points in the embedded space. To satisfy these conditions, the team proposed a framework based on geometric scattering obtained from a set of Diracs that are further processed by a graph autoencoder. To train the network for this approach, four RNA secondary structure datasets were generated via ViennaRNA’s RNAsubopt program (Lorenz et al. 2011), and the evaluation was based on Gibbs free energy. The testing was then carried out on four specific sequences that were identified to have specific structures, namely SEQ3 (an artificial RNA sequence of 32 nucleotides designed to be bistable); SEQ4 (similarly to SEQ3, also an artificial RNA sequence of 32 nucleotides that is bistable); HIVTAR (an ensemble generated from the transactivation response element (TAR) RNA of HIV consisting of 61 nucleotides); TWBOWN (a designed bistable sequence of 72 nucleotides that was later described as a “faulty riboswitch” with three or more dominant states). Some features of the embeddings and structures generated by the model were tested, such as energy prediction, energy smoothness, and reconstruction error. For the secondary structure prediction problem, the reconstruction score can be utilized to measure the model performance. The score is provided as a mean squared error (MSE) of the adjacency matrices generated and is shown in Table 3.
Another architecture that has gained traction in recent years, a large language model (LLM), was tested by Wang et al. (2023a). The team had to gather, construct, align, and refine a massive dataset for the pre-training. The data was collected from diverse sources such as RNAcentral (Consortium 2020), NCBI (Sayers et al. 2020), and Genome Warehouse (Chen et al. 2021), which resulted in approximately 1 billion RNA sequences. These sequences were aligned to a standardized DNA alphabet, analyzed and filtered using statistical analyses, and clustered using the mmseqs2 algorithm (Steinegger and Söding 2017). Their model, called Uni-RNA, incorporates advanced deep learning techniques such as rotary embedding, flash attention, and fused layernorm to optimize performance. Pre-training utilized a masked nucleic acid modeling framework, enabling Uni-RNA to capture robust representations of RNA’s biological structures. The training of Uni-RNA required significant computational resources, including 128 A100 GPUs. The model was scaled to various sizes to address different downstream tasks, to which the models were subsequently fine-tuned. Wang’s solution was evaluated on tasks such as splice site identification, non-coding RNA classification, and secondary structure prediction. In their tests, the model achieved 82.1% in terms of F1-score, 89.4% in terms of precision, and 80.1% in terms of recall, which yielded state-of-the-art results compared to other methods. The authors also mentioned using the model to predict contact maps and RNAs’ tertiary structures. However, no detailed comparison to other methods was performed.
4.3 Tertiary structure prediction and scoring
As a result of secondary interactions, the RNA molecules fold onto themselves, creating three-dimensional conformations. Therefore, the tertiary structure refers to defining spatial coordinates of atoms in the RNA molecule and spatial relationships between them (tertiary interaction). In silico prediction and scoring of these structures is still an ongoing challenge, as the problem complexity is far surpassing the secondary structure prediction, bound together with much smaller volumes of data (crystallographically solved structures). The literature search provided a total of 5 works (out of 33 analyzed) focused on using machine learning for this problem (Table 5).
Li et al. (2018) proposed a complex neural network-based solution called RNA3DCNN to evaluate the RNA structure using 3D convolutions. The VGG-like network (Simonyan and Zisserman 2014) inputs a 32 \(\times\) 32 \(\times\) 32 tensor, where each value is a dimensional representation of the distance of 1Å. The network follows with convolutional and maxpooling layers, ending with one fully connected layer to output a single value, which is described as “unfitness score”. To allow for comparison with other methods, the datasets used for testing purposes come from different sources. Test dataset I was introduced in the RASP paper (Capriotti et al. 2011), with 85 non-redundant RNAs and 500 structural decoys for each sample. Test dataset II came from the KB paper (Bernauer et al. 2011), which was produced using the normal-mode perturbation approach for 15 RNAs and position-restrained dynamics and REMD simulations for 5 RNAs. Depending on the method, between 490 and 3500 decoys were generated for each RNA structure. Test dataset III comes from RNA-Puzzles rounds I–III consisting of 18 target RNAs. The training dataset was constructed using only non-redundant RNA structures obtained from the NDB website. The team used Enrichment Score (ES) as the main metric for evaluation (Bernauer et al. 2011; Wang et al. 2015). The results achieved vary depending on the dataset, where, in some cases, the model outperformed previously known methods, as shown in Table 4.
Wang et al. (2019b) proposed a scoring function based on multi-layer neural networks. Two networks (called NET1 and NET2) were trained on differently defined input tensors. However, their architectures are similar in that they both contain an input layer (of sizes 291 and 5524, respectively), one hidden layer (of sizes 30 and 10, respectively), and a single node for their outputs. The team built train/validation/test datasets using the NDB website, obtaining non-redundant structures of 462 RNAs with lengths varying between 8 and more than 200 nucleotides that excluded complexes with other molecules and RNAs with non-standard nucleotides. Each RNA was paired with 300 decoys generated using molecular dynamics simulations, and the data was split by the real sequences into 322/70/70 RNAs, respectively. The loss function used for training was the mean squared error measured between an RMSD sample difference from the native structure and the score given by the network. The results showed that the trained networks were able to correctly predict 39 and 49 of the 70 structures closest to the native structure for NET1 and NET2, respectively. In contrast, the Ribonucleic Acids Statistical Potential (RASP) based on all-atom knowledge (Capriotti et al. 2011) correctly predicted 26 of 70 structures.
Townshend et al. (2021) introduced a scoring method called Atomic Rotationally Equivariant Scorer (ARES) that achieved excellent results in scoring RNA structures in proximity to native ones. The solution does not incorporate any RNA-specific information in its predictions. Instead, the team uses only 3D coordinates and the chemical element type of each atom in the structure. The underlying machine learning components of the solution can be defined as a graph neural network, utilizing graph convolution layers, rotational and translational equivariance, and other dense layers. The specific design of the layers is built on recent techniques, in particular, the tensor field networks (Thomas et al. 2018) and the PAUL method (Eismann et al. 2021). The solution first aims at identifying local structural motifs by computing several features for each atom based on the geometry of surrounding atoms and features computed by previous layers. The remaining layers then aggregate generated information across all atoms, which allows for predicting the accuracy of the whole structural model. Figure 8 presents an overview of the solutions.

A general illustration of the solution created by Townshend et al. (2021). A structural model of a given RNA is first converted into a graph on which the ARES solution learns features by repeated information sharing between neighboring atoms’ positions and element types. The features are then averaged across all atoms and fed into an artificial neural network (ANN). The final output is the predicted RMSD from a native structure. (Own work based on Townshend et al. (2021))
ARES was trained using only 18 RNA structures solved before 2007, ranging between 17 and 47 nucleotides in chain length, with a median of 26 (Das and Baker 2007). For each RNA, 1000 structural models were generated using the Rosetta FARFAR2 sampling method (Watkins et al. 2020) without using the original structure. The solution’s parameters were then optimized to match the RMSD of each generated model to the corresponding structure. For testing purposes, the team used a benchmark consisting of all RNAs that were included in the RNA-Puzzles structure prediction challenge, with experimentally determined structures published between 2010 and 2017 (Miao et al. 2020) with at least 1500 structural models generated for each RNA. One of the challenges for ARES is that these structures comprise a much larger number of nucleotides than the training set structures—between 112 and 230 nucleotides, with a median of 152.5. The results of the model were compared with three other state-of-the-art scoring functions, namely Rosetta (ver. 2020) (Watkins et al. 2020), Ribonucleic Acids Statistical Potential (RASP) (Capriotti et al. 2011), and 3dRNAscore (Wang et al. 2015). For each RNA in the described benchmark set, the team determined the rank of the best-scoring near-native structural model. This can be thought of as searching through a list ranked by scoring solutions to find a nearly native structure (RMSD \(< 2\)Å). Across the dataset, the mean rank of the best-scoring near-native model is 3.6 for ARES, compared to 73.0, 26.4, and 127.7 for Rosetta, RASP, and 3dRNAscore, respectively. Additionally, the team has chosen four RNAs from the recent rounds of RNA-Puzzles (whose structures are now in the Protein Data Bank with IDs 6OL3, 6PMO, 6POM, and 6UFM), generated sets of candidates with FARFAR2 and submitted the best structures as solutions to the puzzle. The comparison of this method with the best previous submissions is shown in Table 6.
Yet another approach was proposed by Deng et al. (2022) with a graph convolutional network solution for tertiary structure scoring. This solution first represents the RNA structure as a graph, although, due to varying lengths of RNA chains, the whole structure is split into so-called “local environments”. Each local environment is defined by a central nucleotide at the position i along the chain and its neighboring nucleotides (nucleotides within the threshold of 14Å). For an RNA chain of length \(N_s\), this creates \(N_s\) environments represented by \(N_s\) graphs. Each atom in such a graph was represented as a one-hot vector of length \(N_t\), where \(N_t\) is the total number of atom types (54, based on the AMBER99SB force field). Graph edges were created by connecting the fourteen nearest atoms in space and contained five features, namely one for the distance between atoms, three for direction features, and a binary value of 0 or 1, depending on the presence of chemical bonds between atoms. The data used by the team was built based on the non-redundant set of RNA 3D Hub (Leontis and Zirbel 2012), from which complexes of RNA with other molecules were removed. Additionally, RNA chains shorter than eight nucleotides were also removed, and the remaining 610 RNAs were split into training, validation, and testing datasets with the use of the infernal program (Nawrocki and Eddy 2013) to ensure that there is no overlap in RFAM families between the testing and training datasets. The network architecture consisted of five serially connected graph convolution layers with adopted residual modules and skip connections to solve the vanishing gradient problem (Li et al. 2019, 2021). The output of those five layers went to a \(1 \times 1\) kernel convolution layer, followed by a MaxPooling layer, and then produced a single score using a fully connected network. The final score is a scalar, indicating the quality of the input graph. During training, this scalar measured the difference between the input structure and the experimental structure in terms of RMSD. Therefore, the inference output can be viewed as a predicted RMSD score between the input structure and the unknown to the network’s native structure. The architecture of the solution has been shown in Fig. 9.

A general illustration of the solution created by Deng et al. (2022). A part of a structural model (local neighborhood) of given RNA is first converted into a graph and fed through multiple graph convolution layers (GCL). A schema for the inner working of a graph convolution layer used is presented on the right. The final fully connected network predicts an RMSD of an input structure to the native one. (Own work based on Deng et al. (2022))
The first test included evaluating the quality of the structures in the test dataset, which included 92 native RNA structures associated with 200 decoys for each. The team used both the Top-1 and Top-5 criteria to reflect whether the experimental RNA was ranked first or among the best five, respectively. The results were compared with four other popular solutions (shown in Table 7)—namely RASP (Capriotti et al. 2011), Rosetta (Watkins et al. 2020), 3dRNAscore (Wang et al. 2015), and rsRNASP (Tan et al. 2022). It is worth acknowledging that the RNAGCN model achieved the highest average score for enrichment score (ES) and Pearson correlation coefficient (PCC) for near-native structure (<4Å)—scores that indicate the strength of correlations between ground truth and prediction.
Pearce et al. (2022b) proposed in 2022 a de novo method called DeepFoldRNA that uses geometric potentials from deep learning. The body of the network architecture is built with 48 multiple sequence alignment (MSA) Transformer blocks utilizing self-attention layers. The output embedding is then processed by four Sequence Transformer blocks, after which the whole process is repeated for four cycles. The last step is predicting the distance and orientation restraints from the final pair representation, and the backbone angles prediction from a linear projection of the sequence representation. To obtain the final RNA model, those restraints are converted into a negative-log likelihood potential to guide L-BFGS simulations. The solution concept has been visualized in Fig. 10.
The model was trained using 2986 RNA chains gathered from the PDB, which were sure to be non-redundant to the 122 test RNAs. For each chain, an MSA representation is generated using rMSA (Zhang et al. 2023), and fed to the network along with the paired sequence. From these structures, some labeled features were extracted, including the native C4′, N1/N9, and P distance maps, the inter-residue \(\Omega\) and \(\lambda\) orientations, and the backbone \(\eta\) and \(\theta\) pseudo-torsion angles. The trained model was tested on two datasets—one consisting of 105 non-redundant RNAs from 32 Rfam families, and the second containing 17 targets from RNA-Puzzles. On the first benchmark, the method generated models with an average RMSD of 2.68Å and a TM-score of 0.757. In the second benchmark, DeepFoldRNA has produced models of higher quality than the best models submitted by the community for 15 of 17 cases.

A general illustration of the solution created by Pearce et al. (2022b). For the input RNA sequence, a multiple sequence alignment (MSA) is generated via rMSA (Zhang et al. 2023) and fed into an MSA transformer together with a secondary structure predicted by PETfold (Seemann et al. 2008). The outputs of MSA blocks are then fed into a sequence transformer that predicts the distance and orientation maps together with torsion angles. Using L-BFGS optimization on the negative log-likelihood potentials, the method predicts the final RNA model. (Own work based on Pearce et al. (2022b))
4.4 Availability
Most described works can be accessed via model checkpoints shared with the community or via appropriate webservers. Additionally, most works either use publicly accessible datasets or share their data. A handful of works (Lu et al. 2019; Zhang et al. 2019; Willmott et al. 2020; Calonaci et al. 2020; Castro et al. 2020; Deng et al. 2022; Fei et al. 2022) made only their code public, which makes it theoretically possible to train own models on available data. Few works do not share or mention their models and codebases (Wu et al. 2018; Wang et al. 2019b; Quan et al. 2020; Wang et al. 2020, 2023a). One research provides information on accessing its codebase and models; however, the provided hyperlinks no longer work (Zakov et al. 2011). In another work (Yonemoto et al. 2015), the authors do not publicly share their solution; yet, they mention that the software can be accessed on request.
5 Results and discussion
This section summarizes the results, advantages and disadvantages, and methods used in the reviewed works. In Sect. 5.1, we provide an aggregated summary of the results found. In Sect. 5.2, we discuss the advantages and disadvantages of methods used, alongside comparing certain works.
5.1 Results overview
The works analyzed in this review show some trends and conventions used in research using machine learning-based algorithms for RNA structure predictions. The works on secondary structure prediction display a clear shift towards deep learning algorithms over time. The works of Zakov et al. (2011), Yonemoto et al. (2015), and Su et al. (2019) are the only ones to use classical machine learning approaches. The newer works converge on using one of two deep learning paradigms, either convolutional neural networks or recurrent neural networks, yielding state-of-the-art results. Some recent works, such as Zhao et al. (2023) or Qiu (2023), utilize both paradigms to enhance the results further. As for the prediction and scoring of tertiary structures, in addition to using CNNs and MLP, approaches based on graph neural networks bring promising results. However, the newest work uses the transformer architecture with input consisting of the MSA and the RNA secondary structure.
Almost all secondary works focus on canonical and Watson–Crick base pairs as their prediction goal. Most works also include pseudoknot pairings, which makes the prediction problem more complex, thus initially scoring worse than the pseudoknot-free solutions. Only a few works (Zhao et al. 2023; Booy et al. 2022; Mao et al. 2022; Singh et al. 2019, 2021, 2022) consider multiplets. In the tertiary structure section, only the work of Pearce et al. (2022b) is focused on predicting the actual RNA structure. Other works concentrate on creating a DL-based scoring function. However, pairing such a function with thousands of RNAs generated using other methods (like Rosetta’s FARFAR2 sampling in the case of Townshend et al. (2021)) can also tackle the prediction problem.
Regarding the metrics used in secondary structure prediction research, as it is a classification problem, the articles evaluate implemented solutions using standard classification metrics such as accuracy or F1-score. Some works also report Matthew’s correlation coefficient (MCC), which measures the quality of binary classification rather than the overall performance, thus providing a better overview of all possible binary classification results. Due to the varying nature of the prediction goals and metrics used, it is impossible to directly compare the results between solutions. However, the results obtained in the analyzed articles show improved prediction over the years. Depending on the datasets used to test the models, deep learning methods have achieved between 0.62 and 0.97 in terms of F1-score for the secondary structure prediction. The commonly used metric in the tertiary structure prediction and scoring problem is the root-mean-square deviation (RMSD), which reflects the average distance between the atoms. In the case of structure prediction, it is used to calculate the error of the predicted atomic positions relative to the true structure. In the scoring problem, it can be used as the model’s prediction of the difference between the provided structure and the theoretical true structure.
It is also worth noting that most works use common datasets to train and evaluate the results. Some of those datasets come from teams that have first aggregated them for use in their research (such as Tan et al. (2017)). Others are created to provide a standard benchmark for the algorithms (such as Andronescu et al. (2008) or RNA-Puzzles).
5.2 Discussion
Machine learning has become prominent in RNA structure prediction. The multitude of approaches and architectures used in the works yield various outcomes, even while utilizing the same core mechanisms. This section compares and evaluates those approaches through the lens of the results, complexity, and implementation details.
Classical machine learning methods generally have a computational advantage over deep learning architectures. One of the first works using machine learning as a solution for secondary structure prediction was Zakov’s team approach (Zakov et al. 2011). It opened pathways for new research in this domain by demonstrating the feasibility of using machine learning. At the time of the publication, pseudoknots and non-canonical base pairs were still beyond reach. While the high number of features used might have caused the curse of dimensionality, the experimental results yielded state-of-the-art results. The much later approach proposed in Su’s work (Su et al. 2019) may have a great computational advantage over previous works as well as deep learning methods by operating on only 11 input features and using a lightweight logistic regressor at its core. However, the solution may suffer in its training performance and results because of the need for synthetic RNA data.
Deep learning-based solutions for the secondary structure prediction most commonly used LSTM architectures working on the nucleotide chains, CNN architectures taking specifically crafted matrices of nuclei dependencies, or a combination of both of these architectures. However, there is no clear winner in the case of the underlying DL mechanisms, as the results varied greatly. For example, Wang’s team DMfold (Wang et al. 2019a), which uses a standard bi-directional LSTM architecture coupled with their own correction unit for predictions, achieves higher scores than another LSTM-based work by Lu’s team, published in the same year (Lu et al. 2019). There may be a variety of reasons for the differences in results of these works, like the datasets used, own modules, etc. However, the main difference between them lies in the output of the LSTM modules. While Wang’s solution is a sequence-to-sequence model outputting the secondary structure in dot-bracket notation, Lu’s method predicts pairing probabilities between nucleotides that are further optimized by the energy filter.
In recent years, however, CNNs have gained traction. Most works use either fully CNN-based architectures or CNNs coupled with LSTMs, but the use of fully LSTM-based architectures has almost vanished. This may be caused by two factors—lower computational cost of architectures like ResNet or U-Net, and by achieving generally better results, perhaps through the greater potential for spatial features extraction. One such work was presented by Booy’s team (Booy et al. 2022), which tackled all prediction goals (canonical and Watson–Crick pairs, pseudoknots, and multiplets) while achieving state-of-the-art results. This method uses a standard ResNet architecture that takes as its input a specifically crafted matrix containing potential possible pairings between nucleotides. Similarly, other best-performing convolutional methods (Fu et al. (2022), Chen and Chan (2023)) also include the possible pairings between the bases, either as a simple indication in the input matrices by putting a specific value at the possible pairing position, or by appending the input with pairing probability matrix. This information alone greatly enhances the prediction possibilities of the networks.
Against the convention of using CNNs and LSTMs, some works explored other deep learning techniques. In particular, Castro et al. (2020) explored deep graph embeddings in RNA structures. This work, however, does not solely focus on predicting the correct secondary structures but displays a potential for a generative process manipulated by desired properties in a low-dimensional space. By embedding the graphs representing RNA secondary structures in the Euclidean space, the team can predict the folding landscape of given RNA molecules. Tackling a similar problem, the work of Mao and Xiao (2021) aims to learn the fastest RNA folding path by using deep reinforcement learning. The network begins with an open RNA strand and aims to fold it into its native structure. Through a combination of value and policy neural networks, along with Monte Carlo tree search, the algorithm selects base pairs step by step. By learning from reward signals generated by the comparison between predicted and native structures, the solution adjusts its strategy episode by episode. The sequence of selected base pairs at each step represents the predicted folding path. Chen et al. (2020), Wang et al. (2020), Fei et al. (2022) incorporated the transformer architecture in their solutions. The transformer networks are fed the sequence as one-hot-encoded vectors, weighted and positionally encoded vectors, or embedded inputs. The transformer architecture acts as an information encoder, which is later decoded into a pairing matrix by CNN networks (like U-Net). The internal attention mechanism of transformer networks is a promising solution for encoding the importance of nuclei interactions. These methods achieve good results, however, simpler architectures display higher state-of-the-art performance. Coupling this with the high computational power required for training transformer networks answers why only a few works explore them further.
On the topic of transformer networks, it is worth mentioning the work of Wang et al. (2023a), which introduces a large language model for secondary structure prediction, along with other capabilities. LLMs use transformer blocks as part of their overall architecture, making them computationally expensive. This, however, is justified by the flexibility and versatility of these models. Utilizing this pre-train model paradigm of LLMs seems to embed RNA information that is further applicable to many downstream tasks, as the solution achieved state-of-the-art results in most of them. In the end, the trained model does not outperform other solutions for the secondary structure prediction published in the same year. However, it displays a deep and general understanding of RNA properties, even for more niche types like ncRNAs.
For the tertiary structure, only one work tried to tackle the structure prediction itself. The solution proposed by Pearce et al. (2022b) uses the transformer architecture in two configurations—an MSA Transformer consisting of 48 blocks and a Sequence Transformer consisting of 4 blocks. The architecture is similar to the initial AlphaFold solution (Jumper et al. 2021), which implies a computationally heavy model. That, in turn, increases the potential inference time, limits the possibility of reproducing and validating the solution, and expands the overall use costs. However, this computational power required yielded high prediction results, beat other established models for most tested cases, and outperformed classical methods based on Monte Carlo sampling. Recent works on the tertiary structure scoring use mainly Geometric Deep Learning, displaying its potential in the field as exemplified by Townshend et al. (2021). By smart incorporation of spacial properties like rotational and translational equivariance, the model achieves superb results without incorporating any domain-specific knowledge. Moreover, this was achieved by the model being trained only using 18 RNA structures, displaying the strength of graph neural networks.
6 Conclusions
Over the years, machine and deep learning have proven their ability to partially solve the RNA structure prediction problem. Not unlike in other fields, this shift has yielded state-of-the-art results compared to classical solutions. The architectures used vary mainly between sequential methods like LSTM networks and convolution-based solutions utilizing CNNs that have an advantage in both the results achieved and the computational resources necessary for training and inference.
A great limitation for predicting secondary structures with machine learning methods is the overfitting of the training data. This is especially true for complex methods based on deep learning with numerous parameters to be learned and adjusted. Although there are a variety of techniques to mitigate this issue, the RNA structure prediction is prone to overfitting by inappropriate diversification of testing data by RNA families. For example, Sato et al. (2021) showed that E2Efold (Chen et al. 2020) achieved a much lower F1-score for unseen families (\(F=0.0361\)). This showcases the overfitting problem even in published papers and highlights the importance of unified and standardized datasets to solve the RNA structure prediction problem.
One of the significant limitations of using machine-learning-based methods, especially in the prediction of tertiary structures, is the volume of available data. There is an insufficiency of structures mapped and uploaded to PDB that limits the possible knowledge to be obtained by a model, thus leading to sub-optimal solutions. This makes the methods prone to overfitting, resulting in learning the training RNA dataset instead of extracting and generalizing the knowledge (Das 2023). Despite huge progress in the area, the achieved results are not yet ideal for realistic use, as showcased by the RNA-Puzzles. More importantly, however, most of the works focused on creating a scoring function that can be used for structure modeling by evaluating a large number of generated structures. In this problem, deep learning yields mixed results compared to established classical methods, depending on the nature of the RNA families tested. Additionally, the need to generate large quantities of structures affects the potential performance of this kind of method.
A major challenge in predicting RNA structures comes directly from the extensive use of deep learning methods. These methods are generally regarded as “black-box models” that disallow interpretation or explanation of the achieved results. Although methods based on deep learning can achieve state-of-the-art results, with growing complexity, it becomes increasingly difficult to distinguish whether the models gather actual knowledge and follow some discovered folding mechanisms or just memorize the general idea of the structures available in the training dataset. The knowledge extraction problem itself can be partially alleviated by increasing the volume of data and diversifying the represented RNA families. However, even with recent advances in explainable AI (Saeed and Omlin 2023), extracting this knowledge from such models to expand our understanding of RNA structure remains unfeasible.
However, the future seems promising as the number of experimentally solved RNA structures is constantly increasing. This growth, coupled with the continuous development of ML/DL methods, indicates that it is only a matter of time before a breakthrough of AlphaFold’s magnitude will occur in solving 3D RNA structures.
An appealing idea for prospective research involves reviewing practical applications rather than methodological advancements. Such a review should incorporate various case studies, emphasizing practical insights and demonstrating the better performance and increased effectiveness of some methods for RNA structure prediction.
Data availability
No datasets were generated or analysed during the current study.
References
Akiyama M, Sakakibara Y, Sato K (2022) Direct inference of base-pairing probabilities with neural networks improves prediction of RNA secondary structures with pseudoknots. Genes 13:2155. https://doi.org/10.3390/genes13112155
Almakarem ASA, Petrov AI, Stombaugh J et al (2012) Comprehensive survey and geometric classification of base triples in RNA structures. Nucleic Acids Res 40:1407–1423. https://doi.org/10.1093/nar/gkr810
Andersen RE (2017) Forging our understanding of lncRNAs in the brain. Cell Tissue Res 371:55–71. https://doi.org/10.1007/S00441-017-2711-Z
Andronescu M, Bereg V, Hoos HH et al (2008) RNA STRAND: the RNA secondary structure and statistical analysis database. BMC Bioinform 9:1–10. https://doi.org/10.1186/1471-2105-9-340
Andronescu M, Condon A, Hoos HH et al (2010) Computational approaches for RNA energy parameter estimation. RNA 16:2304–2318. https://doi.org/10.1261/rna.1950510
Anfinsen CB (1973) Principles that govern the folding of protein chains. Science 181:223–230. https://doi.org/10.1126/science.181.4096.223
Berman HM, Henrick HNK (2003) Announcing the worldwide Protein Data Bank. www.wwpdb.org. Accessed 27 Dec 2022
Bernauer J, Huang X, Sim AY et al (2011) Fully differentiable coarse-grained and all-atom knowledge-based potentials for RNA structure evaluation. RNA 17(6):1066–1075. https://doi.org/10.1261/rna.2543711
Booy MS, Ilin A, Orponen P (2022) RNA secondary structure prediction with convolutional neural networks. BMC Bioinform 23:58. https://doi.org/10.1186/s12859-021-04540-7
Brierley I, Pennell S (2007) Viral RNA pseudoknots: versatile motifs in gene expression and replication. Nat Rev Microbiol 5:598–610. https://doi.org/10.1038/nrmicro1704
Calonaci N, Jones A, Cuturello F et al (2020) Machine learning a model for RNA structure prediction. NAR Genomics Bioinform 2:Iqaa090. https://doi.org/10.1093/nargab/lqaa090
Capriotti E, Norambuena T, Marti-Renom MA et al (2011) All-atom knowledge-based potential for RNA structure prediction and assessment. Bioinformatics 27(8):1086–1093. https://doi.org/10.1093/bioinformatics/btr093
Castro E, Benz A, Tong A, et al (2020) Uncovering the folding landscape of RNA secondary structure using deep graph embeddings. In: 2020 IEEE international conference on big data (Big Data). Institute of Electrical and Electronics Engineers Inc., pp 4519–4528. https://doi.org/10.1109/bigdata50022.2020.9378305
Chen CC, Chan YM (2023) REDfold: accurate RNA secondary structure prediction using residual encoder-decoder network. BMC Bioinform 24:122. https://doi.org/10.1186/s12859-023-05238-8
Chen JH, Le SY, Maizel JV (2000) Prediction of common secondary structures of RNAs: a genetic algorithm approach. Nucleic Acids Res 28:991–999. https://doi.org/10.1093/nar/28.4.991
Chen X, Li Y, Umarov R et al (2020) RNA secondary structure prediction by learning unrolled algorithms. arXiv:2002.05810
Chen M, Ma Y, Wu S et al (2021) Genome warehouse: a public repository housing genome-scale data. Genomics Proteomics Bioinform 19(4):584–589. https://doi.org/10.1016/j.gpb.2021.04.001
Childs-Disney JL, Yang X, Gibaut QM et al (2022) Targeting RNA structures with small molecules. Nat Rev Drug Discov 21:736–762. https://doi.org/10.1038/s41573-022-00521-4
Choo J, Liu S (2018) Visual analytics for explainable deep learning. IEEE Comput Graphics Appl 38(4):84–92. https://doi.org/10.1109/mcg.2018.042731661
Collins M (2002) Discriminative training methods for hidden markov models: theory and experiments with perceptron algorithms. In: Proceedings of the 2002 conference on empirical methods in natural language processing (EMNLP 2002). Association for Computational Linguistics, pp 1–8. https://doi.org/10.3115/1118693.1118694
Consortium R (2020) RNAcentral 2021: secondary structure integration, improved sequence search and new member databases. Nucleic Acids Res 49(D1):D212–D220. https://doi.org/10.1093/nar/gkaa921
Constantin L (2018) Circular RNAs and neuronal development. Adv Exp Med Biol 1087:205–213. https://doi.org/10.1007/978-981-13-1426-1_16/cover
Crammer K, Dekel O, Keshet J et al (2006) Online passive-aggressive algorithms. J Mach Learn Res 7(19):551–585
Czerniak T, Saenz JP (2021) Lipid membranes modulate the activity of RNA through sequence-dependent interactions. Proc Natl Acad Sci. https://doi.org/10.1073/pnas.2119235119
Danaee P, Rouches M, Wiley M et al (2018) bpRNA: large-scale automated annotation and analysis of RNA secondary structure. Nucleic Acids Res 46(11):5381–5394. https://doi.org/10.1093/nar/gky285
Das R (2023) Assessment of three-dimensional RNA structure prediction in CASP15. Proteins. https://doi.org/10.1101/2023.04.25.538330
Das R, Baker D (2007) Automated de novo prediction of native-like RNA tertiary structures. Proc Natl Acad Sci USA 104:14664–14669. https://doi.org/10.1073/pnas.0703836104
Das R, Karanicolas J (2010) Atomic accuracy in predicting and designing noncanonical RNA structure. Nat Methods 7:291–294. https://doi.org/10.1038/nmeth.1433
Deng C, Tang Y, Zhang J et al (2022) RNAGCN: RNA tertiary structure assessment with a graph convolutional network. Chin Phys B. https://doi.org/10.1088/1674-1056/ac8ce3
Ding Y, Lawrence CE (2003) A statistical sampling algorithm for RNA secondary structure prediction. Nucleic Acids Res 31:7280–7301. https://doi.org/10.1093/nar/gkg938
Ding Y, Chi YC, Lawrence CE (2005) RNA secondary structure prediction by centroids in a Boltzmann weighted ensemble. RNA 11:1157–1166. https://doi.org/10.1261/rna.2500605
Doudna JA (2002) The chemical repertoire of natural ribozymes. Nature 418:222–228. https://doi.org/10.1038/418222a
Eddy SR (2004) How do RNA folding algorithms work? Nat Biotechnol 22:1457–1458. https://doi.org/10.1038/nbt1104-1457
Eismann S, Townshend RJ, Thomas N et al (2021) Hierarchical, rotation-equivariant neural networks to select structural models of protein complexes. Proteins 89:493–501. https://doi.org/10.1002/prot.26033
Fatmi AE, Chentoufi A, Bekri MA, et al (2017) A heuristic algorithm for RNA secondary structure based on genetic algorithm. In: 2017 Intelligent systems and computer vision (ISCV), pp 1–7. https://doi.org/10.1109/isacv.2017.8054964
Fei Y, Zhang H, Wang Y et al (2022) LTPConstraint: a transfer learning based end-to-end method for RNA secondary structure prediction. BMC Bioinform 23:354. https://doi.org/10.1186/s12859-022-04847-z
Ferhadian D, Contrant M, Printz-Schweigert A et al (2018) Structural and functional motifs in influenza virus RNAs. Front Microbiol 9:559. https://doi.org/10.3389/fmicb.2018.00559/bibtex
Frid Y, Gusfield D (2010) A simple, practical and complete O-time Algorithm for RNA folding using the Four-Russians Speedup. Algorithms Mol Biol 5(1):13. https://doi.org/10.1186/1748-7188-5-13
Fu XD (2014) Non-coding RNA: a new frontier in regulatory biology. Natl Sci Rev 1:190–204. https://doi.org/10.1093/nsr/nwu008
Fu L, Cao Y, Wu J et al (2022) UFold: fast and accurate RNA secondary structure prediction with deep learning. Nucleic Acids Res 50:E14. https://doi.org/10.1093/nar/gkab1074
Garst AD, Edwards AL, Batey RT (2011) Riboswitches: structures and mechanisms. Cold Spring Harb Perspect Biol 3:1–13. https://doi.org/10.1101/CSHPERSPECT.A003533
Gilmer J, Schoenholz SS, Riley PF et al (2017) Neural message passing for quantum chemistry. arXiv:1704.01212
Graf J, Kretz M (2020) From structure to function: route to understanding lncRNA mechanism. BioEssays 42:2000027. https://doi.org/10.1002/BIES.202000027
Griffiths-Jones S, Moxon S, Marshall M et al (2005) Rfam: annotating non-coding RNAs in complete genomes. Nucleic Acids Res 33:D121–D124. https://doi.org/10.1093/NAR/GKI081
Grigorashvili EI, Chervontseva ZS, Gelfand MS (2022) Predicting RNA secondary structure by a neural network: what features may be learned? PeerJ 10:e14335. https://doi.org/10.7717/peerj.14335
Havgaard JH, Lyngsø RB, Gorodkin J (2005) The foldalign web server for pairwise structural RNA alignment and mutual motif search. Nucleic Acids Res 33:W650. https://doi.org/10.1093/NAR/GKI473
He K, Zhang X, Ren S et al (2016) Deep residual learning for image recognition. In: 2016 IEEE conference on computer vision and pattern recognition (CVPR), pp 770–778. https://doi.org/10.1109/CVPR.2016.90
Hendrix DK, Brenner SE, Holbrook SR (2005) RNA structural motifs: building blocks of a modular biomolecule. Q Rev Biophys 38:221–243. https://doi.org/10.1017/S0033583506004215
Hochreiter S, Schmidhuber J (1997) Long short-term memory. Neural Comput 9:1735–80. https://doi.org/10.1162/neco.1997.9.8.1735
Hofacker IL, Fontana W, Stadler PF et al (1994) Fast folding and comparison of RNA secondary structures. Monatshefte für Chemie Chem Monthly 125:167–188. https://doi.org/10.1007/BF00818163/METRICS
Hu X, Chu L, Pei J et al (2021) Model complexity of deep learning: a survey. Knowl Inf Syst 63(10):2585–2619. https://doi.org/10.1007/s10115-021-01605-0
Jumper J, Evans R, Pritzel A et al (2021) Highly accurate protein structure prediction with AlphaFold. Nature 596:583–589. https://doi.org/10.1038/s41586-021-03819-2
Kipf TN, Welling M (2017) Semi-supervised classification with graph convolutional networks. arXiv:1609.02907
Kleinkauf R, Mann M, Backofen R (2015) antaRNA: ant colony-based RNA sequence design. Bioinformatics 31:3114–3121. https://doi.org/10.1093/BIOINFORMATICS/BTV319
Kopp F, Mendell JT (2018) Functional classification and experimental dissection of long noncoding RNAs. Cell 172:393–407. https://doi.org/10.1016/J.CELL.2018.01.011
Kotar A, Foley HN, Baughman KM et al (2020) Advanced approaches for elucidating structures of large RNAs using NMR spectroscopy and complementary methods. Methods 183:93–107. https://doi.org/10.1016/J.YMETH.2020.01.009
LeCun Y, Boser BE, Denker JS et al (1989) Handwritten digit recognition with a back-propagation network. In: Neural information processing systems. https://doi.org/10.5555/109230.109279, https://api.semanticscholar.org/CorpusID:2542741
Leontis NB, Westhof E (2001) Geometric nomenclature and classification of RNA base pairs. RNA 7:499–512. https://doi.org/10.1017/S1355838201002515
Leontis NB, Zirbel CL (2012) Nonredundant 3D structure datasets for RNA knowledge extraction and benchmarking, Springer, Berlin, pp 281–298. https://doi.org/10.1007/978-3-642-25740-7_13
Li J, Zhu W, Wang J et al (2018) RNA3DCNN: local and global quality assessments of RNA 3D structures using 3D deep convolutional neural networks. PLoS Comput Biol 14:e1006514. https://doi.org/10.1371/journal.pcbi.1006514
Li G, Muller M, Thabet A et al (2019) DeepGCNs: can GCNs go as deep as CNNs? In: Proceedings of the IEEE/CVF international conference on computer vision (ICCV)
Li G, Müller M, Ghanem B et al (2021) Training graph neural networks with 1000 layers. In: Meila M, Zhang T (eds) Proceedings of the 38th international conference on machine learning, proceedings of machine learning research, vol 139. PMLR, pp 6437–6449
Liu B, Dai Y, Li X et al (2003) Building text classifiers using positive and unlabeled examples. In: Third IEEE international conference on data mining, pp 179–186. https://doi.org/10.1109/ICDM.2003.1250918
Lorenz R, Bernhart SH, zu Siederdissen CH (2011) ViennaRNA Package 2.0. Algorithms Mol Biol 6:1–14. https://doi.org/10.1186/1748-7188-6-26/TABLES/2
Lorenz R, Bernhart SH, Qin J et al (2013) 2D meets 4G: G-quadruplexes in RNA secondary structure prediction. IEEE/ACM Trans Comput Biol Bioinform 10:832–844. https://doi.org/10.1109/TCBB.2013.7
Lu W, Tang Y, Wu H et al (2019) Predicting RNA secondary structure via adaptive deep recurrent neural networks with energy-based filter. BMC Bioinform 20:1–10. https://doi.org/10.1186/s12859-019-3258-7
Lundberg SM, Lee SI (2017) A unified approach to interpreting model predictions. In: Guyon I, Luxburg UV, Bengio S et al (eds) Advances in neural information processing systems, vol 30. Curran Associates Inc., Glasgow, pp 4765–4774
Mańka R, Janas P, Sapoń K et al (2021) Role of RNA motifs in RNA interaction with membrane lipid rafts: implications for therapeutic applications of exosomal RNAs. Int J Mol Sci 22:9416. https://doi.org/10.3390/ijms22179416
Mao K, Xiao Y (2021) Learning the fastest RNA folding path based on reinforcement learning and monte carlo tree search. Molecules 26:4420. https://doi.org/10.3390/molecules26154420
Mao K, Wang J, Xiao Y (2022) Length-dependent deep learning model for RNA secondary structure prediction. Molecules 27:1030. https://doi.org/10.3390/molecules27031030
Mathews DH (2004) Using an RNA secondary structure partition function to determine confidence in base pairs predicted by free energy minimization. RNA 10:1178–1190. https://doi.org/10.1261/RNA.7650904
Mathews DH, Zuker M (2004) Predictive methods using RNA sequences. Bioinformatics 143–170
Mehta A (2016) MicroRNAs as regulatory elements in immune system logic. Nat Rev Immunol 16:279–294. https://doi.org/10.1038/nri.2016.40
Meister G (2004) Mechanisms of gene silencing by double-stranded RNA. Nature 431:343–349. https://doi.org/10.1038/nature02873
Miao Z, Adamiak RW, Antczak M et al (2020) RNA-Puzzles Round IV: 3D structure predictions of four ribozymes and two aptamers. RNA 26:982–995
Mnih V, Kavukcuoglu K, Silver D et al (2015) Human-level control through deep reinforcement learning. Nature 518(7540):529–533. https://doi.org/10.1038/nature14236
Moore PB (1999) Structural motifs in RNA. Annu Rev Biochem 68:287–300. https://doi.org/10.1146/annurev.biochem.68.1.287
Mortimer SA, Kidwell MA, Doudna JA (2014) Insights into RNA structure and function from genome-wide studies. Nat Rev Genet 15:469–479
Nawrocki EP, Eddy SR (2013) Infernal 1.1: 100-fold faster RNA homology searches. Bioinformatics 29:2933–2935. https://doi.org/10.1093/bioinformatics/btt509
Nussinov R, Jacobson AB (1980) Fast algorithm for predicting the secondary structure of single-stranded RNA. Proc Natl Acad Sci 77(11):6309–6313. https://doi.org/10.1073/pnas.77.11.6309
Pearce R, Li Y, Omenn GS et al (2022a) Fast and accurate Ab Initio Protein structure prediction using deep learning potentials. PLoS Comput Biol 18(9):1–22. https://doi.org/10.1371/journal.pcbi.1010539
Pearce R, Omenn GS, Zhang Y (2022b) De novo RNA tertiary structure prediction at atomic resolution using geometric potentials from deep learning. bioRxiv. https://doi.org/10.1101/2022.05.15.491755
Qiu X (2023) Sequence similarity governs generalizability of de novo deep learning models for RNA secondary structure prediction. PLoS Comput Biol 19:e1011047. https://doi.org/10.1371/journal.pcbi.1011047
Quan L, Cai L, Chen Y et al (2020) Developing parallel ant colonies filtered by deep learned constrains for predicting RNA secondary structure with pseudo-knots. Neurocomputing 384:104–114. https://doi.org/10.1016/j.neucom.2019.12.041
Reinharz V, Ponty Y, Waldispühl J (2013) A weighted sampling algorithm for the design of RNA sequences with targeted secondary structure and nucleotide distribution. Bioinformatics 29:i308–i315. https://doi.org/10.1093/bioinformatics/btt217
Ribeiro MT, Singh S, Guestrin C (2016) “Why should I trust you?”: explaining the predictions of any classifier. In: Proceedings of the 22nd ACM SIGKDD international conference on knowledge discovery and data mining, San Francisco, CA, USA, August 13–17, 2016, pp 1135–1144
Rivas E, Eddy SR (1999) A dynamic programming algorithm for RNA structure prediction including pseudoknots11 Edited by I Tinoco. J Mol Biol 285(5):2053–2068. https://doi.org/10.1006/jmbi.1998.2436
Ronneberger O, Fischer P, Brox T (2015) U-Net: convolutional networks for biomedical image segmentation. Springer, New York, pp 234–241. https://doi.org/10.1007/978-3-319-24574-4_28
Ross CJ, Ulitsky I (2022) Discovering functional motifs in long noncoding RNAs. Wiley Interdiscip Rev 13:e1708. https://doi.org/10.1002/wrna.1708
Saeed W, Omlin C (2023) Explainable AI (XAI): a systematic meta-survey of current challenges and future opportunities. Knowl-Based Syst 263:110273. https://doi.org/10.1016/j.knosys.2023.110273
Sato K, Hamada M (2023) Recent trends in RNA informatics: a review of machine learning and deep learning for RNA secondary structure prediction and RNA drug discovery. Brief Bioinform 24(4):bbad186. https://doi.org/10.1093/bib/bbad186
Sato K, Akiyama M, Sakakibara Y (2021) RNA secondary structure prediction using deep learning with thermodynamic integration. Nat Commun 12:941. https://doi.org/10.1038/s41467-021-21194-4
Sayers EW, Beck J, Bolton EE et al (2020) Database resources of the National Center for Biotechnology Information. Nucleic Acids Res 49(D1):D10–D17. https://doi.org/10.1093/nar/gkaa892
Schmitt AM, Chang HY (2016) Long noncoding RNAs in cancer pathways. Cancer Cell 29:452–463. https://doi.org/10.1016/j.ccell.2016.03.010
Seemann SE, Gorodkin J, Backofen R (2008) Unifying evolutionary and thermodynamic information for RNA folding of multiple alignments. Nucleic Acids Res 36(20):6355–6362. https://doi.org/10.1093/nar/gkn544
Serganov A, Nudler E (2013) A decade of riboswitches. Cell 152:17–24. https://doi.org/10.1016/j.cell.2012.12.024
Shahidul Islam M, Rafiqul Islam M (2022) A hybrid framework based on genetic algorithm and simulated annealing for RNA structure prediction with pseudoknots. J King Saud Univ-Comput Inf Sci 34(3):912–922. https://doi.org/10.1016/j.jksuci.2020.03.005
Shapiro BA, Navetta J (1994) A massively parallel genetic algorithm for RNA secondary structure prediction. J Supercomput 8:195–207. https://doi.org/10.1007/bf01204728
Shcherbakova I, Mitra S, Laederach A et al (2008) Energy barriers, pathways, and dynamics during folding of large, multidomain RNAs. Curr Opin Chem Biol 12:655–666. https://doi.org/10.1016/j.cbpa.2008.09.017
Simonyan K, Zisserman A (2014) Very deep convolutional networks for large-scale image recognition. In: 3rd international conference on learning representations, ICLR 2015—conference track proceedings. arXiv:1409.1556
Singh J, Hanson J, Paliwal K et al (2019) RNA secondary structure prediction using an ensemble of two-dimensional deep neural networks and transfer learning. Nat Commun 10:5407. https://doi.org/10.1038/s41467-019-13395-9
Singh J, Paliwal K, Zhang T et al (2021) Improved RNA secondary structure and tertiary base-pairing prediction using evolutionary profile, mutational coupling and two-dimensional transfer learning. Bioinformatics 37:2589–2600. https://doi.org/10.1093/bioinformatics/btab165
Singh J, Paliwal K, Litfin T et al (2022) Predicting RNA distance-based contact maps by integrated deep learning on physics-inferred secondary structure and evolutionary-derived mutational coupling. Bioinformatics 38:3900–3910. https://doi.org/10.1093/bioinformatics/btac421
Sloma MF, Mathews DH (2016) Exact calculation of loop formation probability identifies folding motifs in RNA secondary structures. RNA 22:1808–1818. https://doi.org/10.1261/rna.053694.115
Stark B, Kolet R, Bowman E et al (1978) Biochemistry Ribonuclease P: An enzyme with an essential RNA component (endoribonuclease/precursor tRNA substrates/RNA subunit). Proc Natl Acad Sci USA 75:3717–3721
Steinegger M, Söding J (2017) MMseqs2 enables sensitive protein sequence searching for the analysis of massive data sets. Nat Biotechnol 35(11):1026–1028. https://doi.org/10.1038/nbt.3988
Stephens ZD, Lee SY, Faghri F et al (2015) Big Data: astronomical or genomical? PLoS Biol 13:e1002195. https://doi.org/10.1371/journal.pbio.1002195
Su C, Weir JD, Zhang F et al (2019) ENTRNA: a framework to predict RNA foldability. BMC Bioinform 20:1–11. https://doi.org/10.1186/s12859-019-2948-5
Sun M, Kraus WL (2015) From discovery to function: the expanding roles of long NonCoding RNAs in physiology and disease. Endocr Rev 36:25–64. https://doi.org/10.1210/er.2014-1034
Sutton C, McCallum A (2010) An introduction to conditional random fields. arXiv:1011.4088
Sutton RS, McAllester D, Singh S et al (1999) Policy gradient methods for reinforcement learning with function approximation. In: Proceedings of the 12th international conference on neural information processing systems. MIT Press, Cambridge, MA, USA, NIPS’99, pp 1057–1063
Tan Z, Fu Y, Sharma G et al (2017) TurboFold II: RNA structural alignment and secondary structure prediction informed by multiple homologs. Nucleic Acids Res 45:11570–11581. https://doi.org/10.1093/nar/gkx815
Tan YL, Wang X, Shi YZ et al (2022) rsRNASP: a residue-separation-based statistical potential for RNA 3D structure evaluation. Biophys J 121:142–156. https://doi.org/10.1016/j.bpj.2021.11.016
Taneda A (2012) Multi-objective genetic algorithm for pseudoknotted RNA sequence design. Front Genet 3:36. https://doi.org/10.3389/fgene.2012.00036/bibtex
Thomas N, Smidt T, Kearnes S et al (2018) Tensor field networks: Rotation- and translation-equivariant neural networks for 3D point clouds. arXiv:1802.08219
Townshend RJL, Eismann S, Watkins AM et al (2021) Geometric deep learning of RNA structure. Science 373:1047–1051. https://doi.org/10.1126/science.abe5650
Turner DH, Mathews DH (2009) NNDB: the nearest neighbor parameter database for predicting stability of nucleic acid secondary structure. Nucleic Acids Res 38:D280–D282. https://doi.org/10.1093/nar/gkp892
Ulitsky I, Bartel DP (2013) lincRNAs: genomics, evolution, and mechanisms. Cell 154:26. https://doi.org/10.1016/j.cell.2013.06.020
Vaswani A, Shazeer N, Parmar N et al (2017) Attention is all you need. arXiv:1706.03762
Veličković P, Cucurull G, Casanova A et al (2018) Graph attention networks. arXiv:1710.10903
Wang KC, Chang HY (2011) Molecular mechanisms of long noncoding RNAs. Mol Cell 43:904–914. https://doi.org/10.1016/j.molcel.2011.08.018
Wang J, Zhao Y, Zhu C et al (2015) 3dRNAscore: a distance and torsion angle dependent evaluation function of 3D RNA structures. Nucleic Acids Res 43:e63–e63. https://doi.org/10.1093/nar/gkv141
Wang L, Liu Y, Zhong X et al (2019a) DMFold: a novel method to predict RNA secondary structure with pseudoknots based on deep learning and improved base pair maximization principle. Front Genet 10:143. https://doi.org/10.3389/fgene.2019.00143
Wang YZ, Li J, Zhang S et al (2019b) An RNA scoring function for tertiary structure prediction based on multi-layer neural networks. Mol Biol 53:118–126. https://doi.org/10.1134/S0026893319010175
Wang Y, Liu Y, Wang S et al (2020) ATTfold: RNA secondary structure prediction with pseudoknots based on attention mechanism. Front Genet 11:612086. https://doi.org/10.3389/fgene.2020.612086
Wang X, Gu R, Chen Z et al (2023a) UNI-RNA: universal pre-trained models revolutionze RNA Res. https://doi.org/10.1101/2023.07.11.548588
Wang X, Yu S, Lou E et al (2023b) RNA 3D structure prediction: progress and perspective. Molecules 28(14):5532. https://doi.org/10.3390/molecules28145532
Watkins AM, Rangan R, Das R (2020) FARFAR2: improved de novo Rosetta prediction of complex global RNA folds. Structure 28:963-976.e6. https://doi.org/10.1016/j.str.2020.05.011
Willmott D, Murrugarra D, Ye Q (2020) Improving RNA secondary structure prediction via state inference with deep recurrent neural networks. Comput Math Biophys 8:36–50. https://doi.org/10.1515/cmb-2020-0002
Wilusz JE, Sunwoo H, Spector DL (2009) Long noncoding RNAs: functional surprises from the RNA world. Genes Dev 23:1494. https://doi.org/10.1101/gad.1800909
Wu H, Tang Y, Lu W et al (2018) RNA secondary structure prediction based on long short-term memory model. In: Intelligent computing theories and application, vol 10954 LNCS. Springer, New York, pp 595–599. https://doi.org/10.1007/978-3-319-95930-6_59
Xu J, Liu Y, Li H et al (2022) Transcriptional and functional motifs defining renal function revealed by single-nucleus RNA sequencing. Proc Natl Acad Sci USA 119:e2203179119. https://doi.org/10.1073/pnas.2203179119/-/dcsupplemental
Yakovchuk P, Protozanova E, Frank-Kamenetskii MD (2006) Base-stacking and base-pairing contributions into thermal stability of the DNA double helix. Nucleic Acids Res 34:564–574. https://doi.org/10.1093/nar/gkj454
Yang VW, Lerner MR, Steitz JA et al (1981) A small nuclear ribonucleoprotein is required for splicing of adenoviral early RNA sequences. Proc Natl Acad Sci USA 78:1371. https://doi.org/10.1073/pnas.78.3.1371
Yonemoto H, Asai K, Hamada M (2015) A semi-supervised learning approach for RNA secondary structure prediction. Comput Biol Chem 57:72–79. https://doi.org/10.1016/j.compbiolchem.2015.02.002
Yu H, Qi Y, Ding Y (2022) Deep learning in RNA structure studies. Front Mol Biosci 9:869601. https://doi.org/10.3389/fmolb.2022.869601
Zakov S, Goldberg Y, Elhadad M et al (2011) Rich parameterization improves RNA structure prediction. J Comput Biol 18:1525–1542. https://doi.org/10.1089/cmb.2011.0184
Zhang H, Zhang C, Li Z et al (2019) A new method of RNA secondary structure prediction based on convolutional neural network and dynamic programming. Front Genet 10:467. https://doi.org/10.3389/fgene.2019.00467
Zhang J, Fei Y, Sun L et al (2022) Advances and opportunities in RNA structure experimental determination and computational modeling. Nat Methods 19(10):1193–1207. https://doi.org/10.1038/s41592-022-01623-y
Zhang C, Zhang Y, Pyle AM (2023) rMSA: a sequence search and alignment algorithm to improve RNA structure modeling. J Mol Biol 435:167904. https://doi.org/10.1016/j.jmb.2022.167904
Zhao Y, Wang J, Zeng C et al (2018) Evaluation of RNA secondary structure prediction for both base-pairing and topology. Biophys Rep 4:123–132. https://doi.org/10.1007/S41048-018-0058-Y
Zhao Q, Zhao Z, Fan X et al (2021) Review of machine learning methods for RNA secondary structure prediction. PLoS Comput Biol. https://doi.org/10.1371/journal.pcbi.1009291
Zhao Q, Mao Q, Zhao Z et al (2023) RNA independent fragment partition method based on deep learning for RNA secondary structure prediction. Sci Rep 13:2861. https://doi.org/10.1038/s41598-023-30124-x
Zhou J, Troyanskaya OG (2015) Predicting effects of noncoding variants with deep learning-based sequence model. Nat Methods 12(10):931–934. https://doi.org/10.1038/nmeth.3547
Zuker M (1989) Computer prediction of RNA structure. In: RNA Processing Part A: general methods, methods in enzymology, vol 180. Academic Press, New York, pp 262–288. https://doi.org/10.1016/0076-6879(89)80106-5
Zuker M (2003) Mfold web server for nucleic acid folding and hybridization prediction. Nucleic Acids Res 31(13):3406–3415. https://doi.org/10.1093/nar/gkg595
Acknowledgements
M. Budnik acknowledges support from the Polish Ministry of Science and Higher Education, Project no. DWD/6/0059/2022. M. Kadziński was supported by the Polish Ministry of Science and Higher Education, Grant no. 0311/SBAD/0742.
Author information
Authors and Affiliations
Contributions
MB prepared the study protocol, performed the research, discussed the results, prepared tables and figures, and wrote the manuscript; JW and ŁG discussed the study protocol and the results, and oversaw the article creation process; MK discussed the results and helped with manuscript writing; NS participated in the study design, coordinated the study, discussed results, and helped with manuscript writing. All authors read and approved the final manuscript.
Corresponding author
Ethics declarations
Competing interests
The authors declare no competing interests.
Additional information
Publisher's Note
Springer Nature remains neutral with regard to jurisdictional claims in published maps and institutional affiliations.
Supplementary Information
Below is the link to the electronic supplementary material.
Rights and permissions
Open Access This article is licensed under a Creative Commons Attribution 4.0 International License, which permits use, sharing, adaptation, distribution and reproduction in any medium or format, as long as you give appropriate credit to the original author(s) and the source, provide a link to the Creative Commons licence, and indicate if changes were made. The images or other third party material in this article are included in the article's Creative Commons licence, unless indicated otherwise in a credit line to the material. If material is not included in the article's Creative Commons licence and your intended use is not permitted by statutory regulation or exceeds the permitted use, you will need to obtain permission directly from the copyright holder. To view a copy of this licence, visit http://creativecommons.org/licenses/by/4.0/.
About this article

Cite this article
Budnik, M., Wawrzyniak, J., Grala, Ł. et al. Deep dive into RNA: a systematic literature review on RNA structure prediction using machine learning methods. Artif Intell Rev 57, 254 (2024). https://doi.org/10.1007/s10462-024-10910-3
Accepted:
Published:
DOI: https://doi.org/10.1007/s10462-024-10910-3