
Abstract
Camera-trapping-based social network analysis (SNA) is a valuable tool to characterize communities and identify species with an outstanding role in pathogen maintenance. This study provides new insights into the contentious debate on the effect of biodiversity on disease risk by combining SNA with the assessment of host diversity indicators and pathogen richness in Spain. The apparent species richness detected by camera traps at each study site ranged from 10 to 33 species (mean ± standard error (SE): 20.73 ± 1.94) and their apparent diversity rates (i.e., Shannon index) ranged from 0.57 to 2.55 (mean ± SE: 1.97 ± 0.16). At the community level, vertebrate host diversity had a marginal dilution effect on the disease risk and was negatively correlated to pathogen richness. The exposure to multiple pathogens, as a proxy of disease risk, was negatively associated with apparent host diversity. The disease risk was driven by the interaction of apparent biodiversity with the presence of livestock and with the centrality of the indicator species (i.e., the wild boar). The maximum risk of co-exposure to pathogens was reached when the lowest apparent biodiversity rates coincided with the highest wild boar centrality in the host community or with the presence of livestock, respectively. The highest confluence of pathogens occurred at lower apparent diversity indexes, higher wild boar relative abundances and predominance of agricultural lands. Our results suggest that the diversity-disease relationship is not linear and depends on the environment and host community characteristics, thereby opening avenues for designing new prevention strategies.
Resumen
El análisis de redes sociales (ARS) basado en el uso de cámaras trampa es una herramienta valiosa para caracterizar comunidades de hospedadores e identificar especies con un papel destacado en el mantenimiento de patógenos. Este estudio aporta nuevas perspectivas al polémico debate sobre el efecto de la biodiversidad en el riesgo de enfermedad al combinar el ARS con la evaluación de indicadores de diversidad de hospedadores y riqueza de patógenos en España. La riqueza aparente de especies detectada mediante cámaras trampa en cada lugar de estudio osciló entre 10 y 33 especies (media ± error estándar (SE): 20.73 ± 1.94) y sus índices de diversidad aparente (es decir, el índice de Shannon) oscilaron entre 0.57 y 2.55 (media ± SE: 1.97 ± 0.16). A nivel de comunidad, la diversidad de hospedadores vertebrados tuvo un efecto marginal de dilución sobre el riesgo de enfermedad y se correlacionó negativamente con la riqueza de patógenos. La exposición a múltiples patógenos, como indicador del riesgo de enfermedad, se asoció negativamente con la diversidad aparente de hospedadores. El riesgo de enfermedad estuvo determinado por la interacción de la biodiversidad aparente con la presencia de ganado y con la centralidad de la especie indicadora (es decir, el jabalí). El riesgo máximo de coexposición a patógenos se alcanzó cuando los índices más bajos de biodiversidad aparente coincidieron con la mayor centralidad del jabalí en la comunidad de hospedadores o con la presencia de ganado, respectivamente. La mayor confluencia de patógenos se produjo con índices de diversidad aparente más bajos, mayores abundancias relativas de jabalíes y predominio de ambientes agrícolas. Nuestros resultados sugieren que la relación diversidad-enfermedad no es lineal y depende del entorno y de las características de la comunidad de hospedadores, lo que abre vías para diseñar nuevas estrategias de prevención.
Graphical abstract

Introduction
Pathogens have highly variable host ranges, from pathogens restricted to a single species (i.e. single-host pathogens) to those that can infect a wide variety of host species (i.e. multi-host pathogens). A central goal in disease ecology is the understanding of the complex dynamics and epidemiology of multi-host pathogens since 80% of pathogens of domestic animals and 60% of human pathogens are multi-host. However, despite their ubiquity and relevance for global health, these pathogens have been neglected concerning single-host pathogens (Woolhouse et al. 2001).
The characterization of complex multi-host multi-pathogen systems, frequently involving wild species, livestock and/or humans, is essential to better understand the dynamics of infections under changing environmental conditions (Silk et al. 2017; Behdenna et al. 2019; Barroso et al. 2023a). In complex ecological communities, the pathogen transmission capacity of a species depends on its abundance, intra- and inter-species encounter rates, susceptibility, infectiousness or infection duration, among others (Murray et al. 2011; Barasona et al. 2014b; Mackenstedt et al. 2015; Huang et al. 2016; Santos et al. 2022). However, changes in the community composition can affect species-specific transmission capacities, leading to either a “dilution” or an “amplification” effect (Van Buskirk and Ostfeld 1995; Norman et al. 1999; Laurenson et al. 2003). For example, when diversity declines the more competent species (i.e. species in which a given pathogen can replicate and spread to a new susceptible species, and usually highly connected to the rest of the community),usually remain present in the host community, showing a higher ecological resilience, while less efficient species for pathogen transmission decline or disappear (Ostfeld and Keesing 2012; Gervasi et al. 2017).
The “dilution effect” hypothesis postulates that species-richer communities show a lower risk of pathogen emergence and reduced transmission (Keesing and Ostfeld 2015). This protective effect of biodiversity has been reported in many studies on infectious diseases of wildlife, livestock, humans, and plants (Dizney and Ruedas 2009; Young et al. 2014; Civitello et al. 2015; Halliday et al. 2020). According to this hypothesis, more diverse communities would be more likely to harbor fewer competent hosts while less diverse ones may have a higher abundance of specific hosts (Gervasi et al. 2015). The presence and abundance of certain species could drive the risk of infection with certain pathogens (Keesing and Ostfeld 2021). In general, competent hosts are widespread and abundant species (broad geographic ranges) with fast life histories, i.e., early maturity, short gestation period and large litter size (Han et al. 2015; Keesing and Ostfeld 2015). These hosts are more prone to be encountered by pathogens in nature and are usually less resistant or more tolerant to infection (Martin et al. 2006). In addition, competent host species are often resilient to disturbance and environmental stressors that cause biodiversity declines (Cronin et al. 2010; Johnson et al. 2012). Thus, resilient species may persist as biodiversity is lost from host communities, being able to harbor and transmit pathogens at high rates. As an example, Schmidt and Ostfeld (2001) evidenced that the prevalence of Borrelia burgdorferi, in field-collected Ixodes ticks was extremely lower than expected when ticks fed predominantly on highly competent reservoirs such as a white-footed mice (Peromyscus leucopus) and eastern chipmunks (Tamias striatus). Alternatively, if long-lived species constitute a more steady environment for parasite survival, host longevity and parasite species richness may be positively associated, as had been demonstrated for ungulates (Cooper et al. 2012). Another related idea, the “diversity begets diversity” hypothesis, defends that biodiverse ecological communities also have a higher pathogen diversity, with infection prevalence and disease severity decreasing with increasing host diversity (Hechinger and Lafferty 2005; Wood and Lafferty 2013; Rottstock et al. 2014; Johnson et al. 2016). For example, Johnson et al. (2016) suggested that the diversity of amphibian parasites increased consistently with that of their hosts. However, a polarized debate about the generality of both hypotheses exists, although the biodiversity-disease relationship seems to depend on the specificity of the pathogen, its type of transmission, and habitat features, among others (Wood and Lafferty 2013; Strauss et al. 2015).
Social network analysis (SNA) is a valuable tool to characterize host communities in terms of their inter-specific interactions allowing for identifying individuals or key species for pathogen spread (Martínez-López et al. 2009; Triguero-Ocaña et al. 2020). Several network metrics could be employed to assess the epidemiological relevance of each node (individual or species) for the overall community. Among them, centrality measures of nodes are especially useful since these have been associated with higher pathogen richness and spread capability, being species with high centrality potentially considered as potential super-spreaders of pathogens (Gómez et al. 2013). In this regard, broker hosts are considered those which serve as a bridge to the other not directly connected species in the network (Lusseau and Newman 2004). Network characteristics including composition, interaction structure, and transmission routes may drive disease transmission and diversity-disease relationship (Su et al. 2022).
Biodiversity, pathogen maintenance and inter-species transmission may be also driven by biotic and abiotic factors including disturbance. Human impacts causing land-use modifications affect species richness and mammal health status with a subsequent impact on infectious disease risk (Young et al. 2013; Keesing and Ostfeld 2021). Agriculture, in particular livestock grazing, could modify ecological niches and pathogen transmission, exerting both positive and negative consequences for biodiversity (Broom et al. 2013; Barroso and Zanet 2024). The main impacts include the overexploitation of the vegetation and the alteration of water quality when the stocking densities are elevated, the potential transmission of shared pathogens, the alteration of wild communities and habitat structure, as well as the subsequent ecological cascading effects (Barroso and Gortázar 2024). Benefits of livestock presence for biodiversity comprise, among others, its role as ecosystem engineers (creating suitable habitats for certain wildlife species breeding and survival) and the increase in the availability of water bodies for wildlife which are built and/or maintained for livestock (Severson 1990; Thiere et al. 2009). Some examples of these advantages are the mutualistic relationships established by livestock and certain wild species such as cattle egrets (Bulbuculus ibis) or the positive effects of livestock-driven structural changes in the habitat for termites, arboreal geckos and insects in traditional pastoral systems in Africa (Riginos et al. 2012). The costs or benefits of livestock grazing depend on the type of breeding, management and stocking densities, grazing intensity, season, climate, and the community composition, and are thus species- and context-specific (Schieltz and Rubenstein 2016; Barroso and Gortázar 2024).
The wild boar (Sus scrofa) is a ubiquitous species with large home ranges which exhibits high tolerance to human disturbance. Therefore, this species overlaps its habitat with livestock and humans, acting as a link between natural areas and humanized settings (Macdonald and Laurenson 2006; Torres et al. 2020). Thus, wild boar may play a key role as a reservoir or carrier of several pathogens and antimicrobial resistances in the wildlife-human-livestock interface (Fredriksson-Ahomaa 2019; Torres et al. 2020), serving as a perfect model species to unveil the emergence, spread and persistence of pathogens in complex host communities.
In a context of global pathogen emergence, we hypothesized that the disease risk, using the wild boar as the indicator species, will generally be higher in areas with lower biodiversity. This relationship should be determined by other factors linked with connectivity (species centrality) between hosts and human-driven factors.
Methods
Population monitoring and estimation of mammal species richness and diversity indexes
Eleven study sites were selected because they were representative, i.e. were distributed throughout the main wildlife bioclimatic units, of mainland Spain in terms of habitats, climates and wildlife management systems (Fig. 1) (Barroso et al. 2023b; MAPA 2024). In 2021, a grid of approximately 20 unbaited camera traps (Browning Strike Force HD ProX, Browning Arms Company®, Morgan, Utah, USA) was initially deployed for 40 days in each study site. The grids were of variable size according to the surface of each study site ranging from 14 to 24 (mean: 18 cameras). Cameras were deployed facing north, 50 cm above ground, and with the sensor angled parallel to the slope of the ground. Cameras were set to be operative 24 h, to record a burst of eight consecutive pictures at each activation, with a one second delay between consecutive activations. The sensitivity of the infrared sensor was set to medium. Photographs of individuals taken more than ten minutes apart were considered independent captures (see Barroso et al. 2023b) for a detailed methodology).

Map of the 11 pilot monitoring sites with information on the presence of livestock and type of area. Green and red squares represent areas with and without livestock. Squares with dashed lines show protected areas
Images from cameras which were operative less than five days were discarded. Subsequently, survey effort was harmonized to 339 camera-days (range: 222–358 camera-days). Relative abundance, namely trapping rate, was calculated for each species including 24 wild mammal species, 6 domestic mammal species and 50 bird species (O’Brien 2011). It was calculated as the number of independent captures per camera and operative day.
Species richness and Shannon’s index (H) were calculated for the overall pool of species found (30 mammals and 50 bird species), and for wildlife species (24 mammal and 50 bird species). These metrics were computed through camera trap records (number of encounters of each species) by using ggvegan R package. Therefore, these values comprised the species detected by the cameras and not necessarily all those present, so these metrics were named as “apparent species richness” and “apparent diversity rate” (Oliver et al. 2023). Static social networks were constructed for mammals of each study site and the centrality node metrics (i.e., degree, weighted strength, closeness, betweenness; Martínez-López et al. 2009) were estimated, both using the igraph R package (Fig. 1; Csardi and Nepusz 2006). The weights assigned to nodes correspond to the number of spatial coincidences between nodes/species (i.e. the photo-capture of individuals by the same camera during a 24 h window, based on the environmental survival of the target pathogens) (Niedballa et al. 2019). These metrics obtained, defined in Supplementary Material 1, are the most relevant epidemiologically (Silk et al. 2017), allowing to identifying potential super-spreaders, individuals who mediate the spread of infection between the host community or exposure of individuals to infection. For each study site, the number of species with higher centrality metrics was calculated. For this purpose, the arithmetic mean of each species’ metrics was calculated considering all the study sites, and the total number of species with values above the mean was counted.
Health monitoring and disease risk assessment
According to previous studies, the Eurasian wild boar was selected as an indicator species of the health status of the host community, i.e., the species which serves best to detect the emergence or changes in the prevalence of multi-host pathogens (Halliday et al. 2007; Barroso et al. 2023b, 2024) (Fig. 2). From 2020 to 2021, a total of 468 sera from hunter-harvested wild boar from the 11 study sites were assayed for antibodies against six different pathogens (hepatitis E virus (HEV), Toxoplasma gondii, Mycobacterium tuberculosis complex -MTC-, Brucella sp, Aujezsky’s disease virus -ADV-, Porcine circovirus type 2 -PCV2-; data published in Barroso et al. 2023b) using commercial indirect enzymatic immunoassays following manufacturer’s instructions (see Supplementary Material 2 for methodological details). Co-exposure was defined as the simultaneous positive diagnosis (presence of antibodies) to pathogens in an individual (Barroso et al. 2023a). The number of pathogens implicated was used to arbitrarily categorize the severity of the co-exposure into mild (2 pathogens) and severe (≥ 3 pathogens).

Glossary of network node metrics and definition of the types of species considered in this study
For each study site, the disease risk was estimated following three approaches: the pathogen richness (antibody richness) in the indicator species, the average seroprevalence of pathogens (%), and the presence/severity of co-exposure to pathogens (Huang et al. 2016). The risk of viruses (HEV, PCV2, ADV), and multi-host/zoonotic (MTC, T. gondii, HEV and Brucella), water-borne (MTC, T. gondii, HEV), and swine pathogens (HEV, PCV2, and Brucella) were also computed (Dubey 2004; Meng and Lindsay 2009; Yugo and Meng 2013; Barasona et al. 2017, 2019).
Statistical analyses
The pathogen (antibody) richness, average seroprevalence of pathogens and prevalence of co-exposure to pathogens in wild boar was used as a proxy of the disease risk and health status of the entire host community since wild boar was established as an indicator species according to previous studies (Barroso et al. 2023b, 2024). Bivariate analyses were performed to assess the relationships between apparent species diversity, node/network metrics and disease risk at the sampling site level (n = 11) by using Spearman’s rank tests, and Kruskal Wallis sum rank tests for the continuous and categorical variables, respectively.
Two sets of generalized linear mixed models (binomial response) were fitted in the R library lme4 to assess the diversity-disease relationships and their potential determinants (Bates et al. 2019) (Supplementary Material 3). The presence of co-exposure to pathogens (yes/no) and co-exposure severity were selected as response variable as a proxy for disease risk. This variable allowed analyzing a larger sample (individual level). The study site was included as a random factor. The variance inflation factor (VIF) was calculated for all covariates to measure multicollinearity, and variables with a VIF < 3 were retained in the model. Among the indexes calculated, Shannon index was selected as an indicator of apparent species diversity for statistical analyses because it is broadly used in the literature, being almost universal for general ecological use, and since it is less affected by sample size and allows to capture biological information (Fedor and Zvaríková 2018). The predictors included in the models were the apparent biodiversity index (Shannon index), coverage of agricultural lands (%) (information acquired from Corine Land Cover dataset including arable land, permanent crops, prairies, and heterogeneous agricultural areas, obtained by a principal component analysis because of the higher collinearity found land cover variables), presence of livestock, and centrality and relative abundance of wild boar (indicator species). The wild boar centrality index selected was the weighted strength, being the measure less correlated with the other explanatory variables (VIF < 3) (Barrat et al. 2004). Model selection was based on corrected Akaike's Information Criterion (AICc). The Akaike weight (wi), i.e. the probability that a model is the best among those compared, was also estimated (Burnham and Anderson 2002). All models with an increase in lower than two AICc units (ΔAICc < 2) were considered suitable to explain the variability observed in the response variable. Once the best model was selected, normality and the absence of residual pattern in data variation were checked. All analyses were conducted using R software 4.0.2 (R Core Team 2019).
Results
Vertebrate species diversity
Species registered by camera traps at each study site are displayed in Supplementary Material 4. The overall apparent species richness of each study site (mean ± SE: 20.73 ± 1.94; range: 10–33) and their apparent diversity indexes (mean H index ± SE: 1.97 ± 0.16; range: 0.57–2.55) are shown in Table 1.
Diversity-disease relationships at study site level
-
1.
Antibody prevalence
Apparent wildlife species diversity (Shannon H) showed a seeming tendency to reduce the disease risk when expressed as the average seroprevalence of pathogens, but it was not statistically significant. As for the disease risk by groups of pathogens, a lower risk of viruses was correlated with a higher diversity of both overall species (R -0.67 p: 0.03) and of wildlife species (R -0.72 p: 0.02) (Fig. 3a). The risk of pathogens linked to swine presence was negatively correlated to apparent biodiversity indexes (R: -0.62 p: 0.05) (Fig. 3b).
Fig. 3 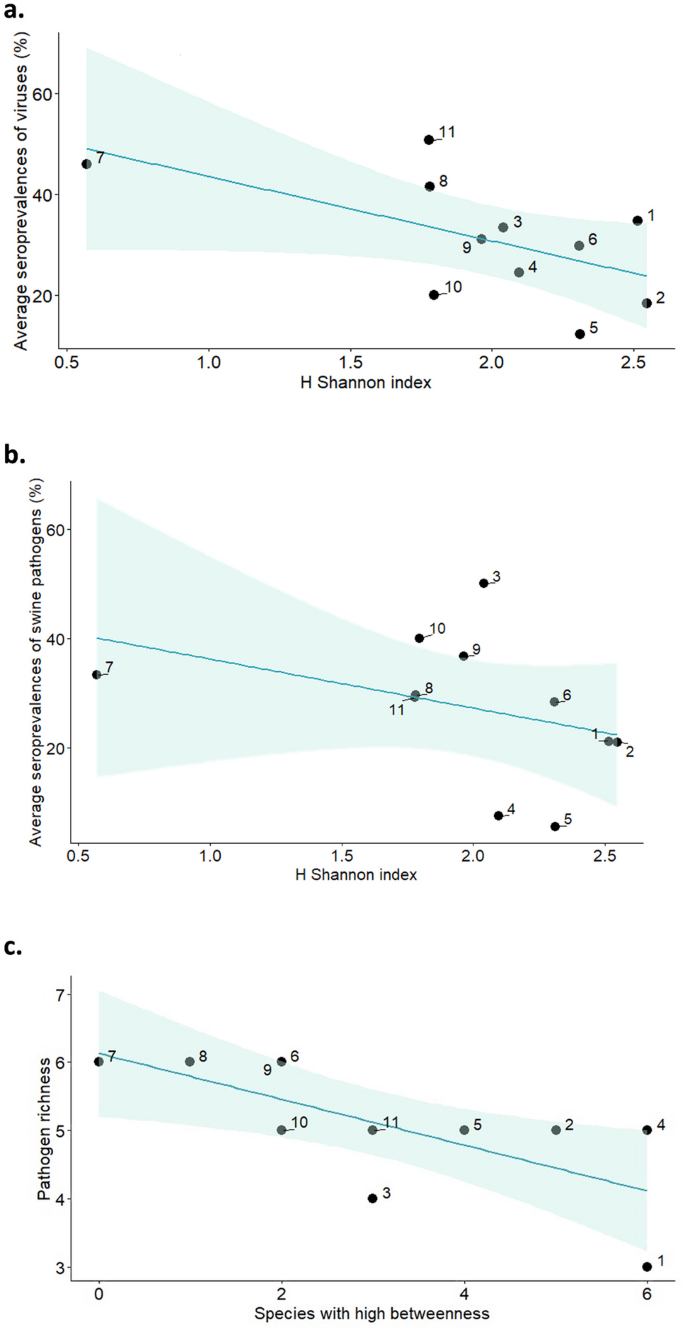
Biodiversity-disease risk relationships (wild boar as indicator species) from 11 study sites in Spain. Apparent biodiversity rates (Shannon diversity index H) in relation to a the average seroprevalence of antibodies against viruses (hepatitis E virus -HEV-, Aujeszky disease virus -ADV-, and porcine circovirus type 2 -PCV2-; %), b the average seroprevalence of swine pathogens (HEV, PCV2, and Brucella sp; %), and c number of species with higher betweenness (i.e., above the mean of each species considering all the study sites) in a host community in relation to its pathogen richness. Shaded bands represent 95% confidence intervals
-
2.
Coinfections
A negative correlationship between the disease risk and the apparent species diversity was demonstrated at the study site level when considering the co-exposure to pathogens as a proxy of the disease risk (Overall H: R: -0.85 p < 0.02; Wildlife H: R: -0.9 p < 0.02). The number of pathogens to which wild boar were co-exposed was negatively related to apparent biodiversity levels (KW: 21.13; p < 0.02).

Species centrality-disease relationships at study site level
Supplementary Material 5 displays centrality node metrics for overall nodes and wild boar. Pathogen richness (overall and multihost/zoonotic pathogens) in the host communities seemed to decline as the number of species with elevated betweenness increased (above average values of each species’ betweenness among study sites) (overall: R: -0.77 p < 0.01; multihost/zoonotic pathogens: R: -0.62 p: 0.04), i.e., a greater number of broker hosts was correlated to lower pathogen richness (Fig. 3c). However, the contrary occurred with species closeness (overall R: 0.70, p: 0.02): pathogen richness increased with species closeness.
Factors driving diversity-disease relationships at individual level
The relationship between apparent biodiversity and disease risk (risk of co-exposure to pathogens at the individual level) was driven by the interaction of apparent biodiversity with the presence of livestock, as well as with the centrality of the indicator species, since both models were considered as best models (ΔAICc ≤ 2). In this regard, the maximum disease risk was reached when the lowest apparent biodiversity rates co-occurred with the highest wild boar centrality in the host community or with the presence of livestock, respectively (Fig. 4a and Table 2). On the contrary, in the absence of livestock or at low wild boar connectivity the effect of apparent biodiversity was not significant (Fig. 4b).

Predicted probability of co-exposure to pathogens (Mycobacterium tuberculosis complex, Brucella sp, Toxoplasma gondii, hepatitis E virus, Aujeszky disease virus, and porcine circovirus type 2) in wild boar (n = 360) from 11 study sites in Spain in relation to a the interaction between apparent wildlife diversity (Shannon diversity index) and the centrality of wild boar in the host community (weighted strength of wild boar), and b the interaction between apparent wildlife diversity (Shannon diversity index) and the presence of livestock. Shaded bands represent 95% confidence intervals
For the severity of disease risk (number of pathogens to which individuals were co-exposed), the full model was selected since there were no differences ≤ 2 ΔAICc with the rest of the best models. The severity of disease risk was best explained by the additive effect of apparent host diversity, wild boar relative abundance, wild boar centrality, presence of livestock, and coverage of agricultural lands. The highest confluence of pathogens occurred at lower apparent diversity indexes (p: 0.05), and higher wild boar relative abundance (p: 0.11), and coverage of agricultural lands (p: 0.07, marginally significant) (Supplementary Material 6 and Table 3).
Discussion
Multi-host multi-pathogen systems are common in nature (Robles-Fernández et al. 2022; Barroso et al. 2023a). These systems are dynamic, making it challenging to study their epidemiology and ecology, as well as designing appropriate control strategies (Fountain‐Jones et al. 2018). In this context, it is essential to elucidate the effect of species richness and diversity on disease risk since biodiversity oscillations lead to changes in host community competence for pathogen maintenance (Barasona et al. 2019; Stewart Merrill and Johnson 2020). By combining the assessment of host community composition, apparent diversity, and species centrality with that of disease risk indicators, this study offers insight into the contentious diversity-disease relationship (Halsey 2018; Rohr et al. 2019).
Species centrality-disease relationships
Centrality measures of a network reflect the importance of each species to the host community in terms of the extension of its indirect links with other species (Martínez-López et al. 2009). The number of species which serve as key brokers between many others (highest betweenness) was negatively associated with pathogen richness. A large number of species that connect different species subgroups within the host community (see Supplementary Material 1) implies a higher number of indirect routes between pairs of species, i.e., the species were less directly linked, thus potentially reducing the probability of competent host encounters (Gómez et al. 2013). Similarly, pathogen richness was positively related to the number of species with elevated closeness, an indicator of how closely connected a species is to the others, and specifically to wild boar closeness as one relevant reservoir and super-spreader for several of the pathogens studied (Santos et al. 2015). Previous studies on social network analysis in epidemiology stated that node closeness mirrors the “time-until-arrival” of pathogens if infection occurs through the shortest path (Borgatti 1995; Corner et al. 2003). Thus, isolated species in the network are less likely to become infected and infect others whereas highly connected ones will be efficient at spreading pathogens through the network (Corner et al. 2003), and represent optimal indicators.
Drivers of the diversity-disease relationship
Our results at the study site level support a dilution effect of apparent biodiversity on disease risk in terms of both the probability of co-exposure to pathogens and the number of implicated pathogens (severity). However, the models (individual level) revealed that the diversity-disease relationship depends on several factors including indicator species centrality, livestock presence, relative abundance of hosts and abiotic factors, which was in accordance with previous studies on multi-host multi-pathogen assemblages (Wang et al. 2019).
A dilution gradient from more to less marked was observed depending on the presence of livestock and the centrality of the wild boar in the network representing the host community. A noticeable dilution effect of apparent biodiversity on pathogen risk occurred in communities with livestock, while this diversity-disease relationship was not as evident in the absence of livestock. Homogeneous (diversity-poor) communities containing livestock were the riskiest ones for exposure to multiple pathogens while, also under the presence of livestock, high rates of biodiversity gave rise to the lowest risk. Previous studies reported a positive relationship between livestock density and pathogen diversity (Arneberg 2002; Byrne et al. 2019). Free-ranging livestock under low-intensive silvopastoral systems is known to harbor higher biodiversity than other agricultural systems (Fox 2013; Broom et al. 2013). Thus, circumstances of high diversity and livestock presence could be also associated not only with lower livestock densities (and reduced pathogen richness) but also with a higher biodiversity implying the presence of many potentially incompetent hosts limiting the abundance of competent hosts, e.g., by competition for resources (Ostfeld and Keesing 2012; Huang et al. 2013; Wang et al. 2019).
In our study systems, the biodiversity-disease relationship also depends on wild boar centrality in the network. In communities in which the wild boar was highly connected to other species (i.e., frequently overlaps spatially with the other species of the community), the potential epidemiological consequences of the encounter of this superspreader with other competent hosts could be diluted by high diversity rates, thus decreasing the risk of exposure to pathogens (Ostfeld and Keesing 2012; Keesing and Ostfeld 2015). On the contrary, communities with highly central wild boar and low biodiversity represented the highest risk. However, when the wild boar was more isolated in the network, the disease risk remained stable (i.e., unaffected by biodiversity).
Regarding the severity of co-exposure, the animals were exposed to the maximum number of pathogens when they belonged to low apparent biodiverse communities, to communities with high wild boar abundance, and/or areas with high agricultural use. Once again, our results showed that biodiversity may reduce the probable number of circulating pathogens. Other factors, namely the abundance of indicator species such as wild boar or agricultural use also explained the number of pathogens to which the host community was exposed. Both factors have been associated with increased overlap among wild boar and other wild and domestic ungulates (Kukielka et al. 2013; Barasona et al. 2014a).
This study had several limitations. It comes from a pilot project on integrated wildlife monitoring, and thus, given the exploratory and descriptive nature of the study, the results are observational and do not follow specific hypotheses and/or experimental designs. More study sites and more pathogens (both multi-host and single-host) would provide more robust insights. Adding some vector-borne pathogens would be pertinent. To compensate for the low number of study sites (n = 11) we modelled some disease risk indicators at the individual level (n = 468). The uniform effort carried out in all sites may help to avoid bias in the results. Although more and more studies indicate its potential as a tool to measure vertebrate diversity and abundance, camera trapping should be combined with additional techniques focused on species whose detectability is lower but whose epidemiological importance is elevated, such as small mammals or birds (Steenweg et al. 2017). These additional techniques could include public available platforms on wildlife observations, sound detectors and/or artificial intelligence tools (Oliver et al. 2023; Pérez-González et al. 2024). These tools should be considered in future studies although the high number of bird species detected by camera traps in this study indicates its potential to provide a significant contribution also to bird diversity and distribution monitoring.
Conclusions and implications
Our results offer insights in the debate on the diversity-disease relationship by highlighting that it is not invariant but rather depends on certain characteristics of the host communities and the environment. This could give rise to better risk mitigation and prevention strategies.
Social network analysis is a useful tool to combine with integrated wildlife monitoring systems. This new approach would provide researchers and decision makers with a more detailed and comprehensive picture of the host community by identifying potentially key species for pathogen spread that in turn determine biodiversity-disease relationships. Host communities with a greater number of closely connected individuals presented a higher risk of disease, highlighting wild boar connectivity in particular as a determinant for the transmission of multiple pathogens in homogeneous (apparent low biodiverse) communities. Similarly, a larger number of indirect routes to connect pairs of species decreased the disease risk, probably together with all the other routes by undetected species.
A dilution effect was observed. At the individual level, the biodiversity-disease relationship depended on biotic and abiotic factors such as livestock presence and the centrality of wild boar in the networks. Since those sites with livestock presence characterized by high biodiversity rates were less risky for pathogens, promoting biodiversity becomes essential for disease control. This could impact on public health and the economy, since land use, management of wild populations and biodiverse agro-livestock systems play a crucial role in preventing pathogen emergence.
Data availability
The data that support the findings of this study are available in the Zenodo repository with the identifier https://doi.org/10.5281/zenodo.6861521.
References
Arneberg P (2002) Host population density and body mass as determinants of species richness in parasite communities: Comparative analyses of directly transmitted nematodes of mammals. Ecography 25(1):88–94. https://doi.org/10.1034/j.1600-0587.2002.250110.x
Barasona JA, Latham MC, Acevedo P et al (2014a) Spatiotemporal interactions between wild boar and cattle: implications for cross-species disease transmission. Vet Res 45:122. https://doi.org/10.1186/s13567-014-0122-7
Barasona JA, Mulero-Pázmány M, Acevedo P et al (2014b) Unmanned aircraft systems for studying spatial abundance of ungulates: relevance to spatial epidemiology. PLoS ONE 9:e115608. https://doi.org/10.1371/journal.pone.0115608
Barasona JA, Gortázar C, de la Fuente J, Vicente J (2019) Host richness increases tuberculosis disease risk in game-managed areas. Microorganisms 7:182. https://doi.org/10.3390/microorganisms7060182
Barasona JA, Vicente J, Díez-Delgado I et al (2017) Environmental presence of Mycobacterium tuberculosis complex in aggregation points at the wildlife/livestock interface. Transbound Emerg Dis 64:1148–1158. https://doi.org/10.1111/tbed.12480
Barrat A, Barthélemy M, Pastor-Satorras R, Vespignani A (2004) The architecture of complex weighted networks. Proc Natl Acad Sci 101:3747–3752. https://doi.org/10.1073/pnas.0400087101
Barroso P, Acevedo P, Risalde MA et al (2023a) Co-exposure to pathogens in wild ungulates from Doñana National Park, South Spain. Res Vet Sci 155:14–28. https://doi.org/10.1016/j.rvsc.2022.12.009
Barroso P, Relimpio D, Zearra JA et al (2023b) Using integrated wildlife monitoring to prevent future pandemics through one health approach. One Heal 16:100479. https://doi.org/10.1016/j.onehlt.2022.100479
Barroso P, Gortázar C (2024) The coexistence of wildlife and livestock. Anim Front 14:5–12. https://doi.org/10.1093/af/vfad064
Barroso P, López-Olvera JR, Kiluba wa Kiluba T, Gortázar C (2024) Overcoming the limitations of wildlife disease monitoring. Res Dir One Heal 2:e3. https://doi.org/10.1017/one.2023.16
Barroso P, Zanet S (2024) Biodiversity–livestock interface: a case study. Anim Front 14:53–60. https://doi.org/10.1093/af/vfad068
Bates D, Maechler M, Bolker B et al (2019) Linear mixed-effects models using Eigen and S4. J Stat Softw 67. https://cran.r-project.org/web/packages/lme4/lme4.pdf
Behdenna A, Lembo T, Calatayud O et al (2019) Transmission ecology of canine parvovirus in a multi-host, multi-pathogen system. Proc R Soc B Biol Sci. https://doi.org/10.1098/rspb.2018.2772
Borgatti SP (1995) Centrality and AIDS. Connections 112–115. http://www.analytictech.com/networks/centaids.htm
Broom DM, Galindo FA, Murgueitio E (2013) Sustainable, efficient livestock production with high biodiversity and good welfare for animals. Proc R Soc B Biol Sci 280:20132025. https://doi.org/10.1098/rspb.2013.2025
Burnham KP, Anderson DR (2002) Model selection and multimodel inference: a practical information-theoretic approach. Springer, New York
Byrne AW, Graham J, McConville J et al (2019) Liver fluke (Fasciola hepatica) co-infection with bovine tuberculosis in cattle: a prospective herd‐level assessment of herd bTB risk in dairy enterprises. Transbound Emerg Dis. https://doi.org/10.1111/tbed.13209
Civitello DJ, Cohen J, Fatima H et al (2015) Biodiversity inhibits parasites: broad evidence for the dilution effect. Proc Natl Acad Sci 112:8667–8671. https://doi.org/10.1073/pnas.1506279112
Cooper N, Kamilar JM, Nunn CL (2012) Host longevity and parasite species richness in mammals. PLoS ONE 7:e42190. https://doi.org/10.1371/journal.pone.0042190
Corner LAL, Pfeiffer DU, Morris RS (2003) Social-network analysis of mycobacterium bovis transmission among captive brushtail possums (Trichosurus vulpecula). Prev Vet Med 59:147–167. https://doi.org/10.1016/S0167-5877(03)00075-8
Cronin JP, Welsh ME, Dekkers MG et al (2010) Host physiological phenotype explains pathogen reservoir potential. Ecol Lett 13:1221–1232. https://doi.org/10.1111/j.1461-0248.2010.01513.x
Csardi G, Nepusz T (2006) The igraph software package for complex network research. InterJournal Complex Syst 1695:1–9
Dizney LJ, Ruedas LA (2009) Increased host species diversity and decreased prevalence of sin nombre virus. Emerg Infect Dis 15:1012–1018. https://doi.org/10.3201/eid1507.081083
Dubey JP (2004) Toxoplasmosis – a waterborne zoonosis. Vet Parasitol 126:57–72. https://doi.org/10.1016/j.vetpar.2004.09.005
Fedor P, Zvaríková M (2018) Biodiversity indices. In: Fath BD (ed) Encyclopedia of Ecology, 2nd edn. Elsevier, pp 337–347
Fountain-Jones NM, Pearse WD, Escobar LE et al (2018) Towards an eco‐phylogenetic framework for infectious disease ecology. Biol Rev 93:950–970. https://doi.org/10.1111/brv.12380
Fox JW (2013) The intermediate disturbance hypothesis should be abandoned. Trends Ecol Evol 28:86–92. https://doi.org/10.1016/j.tree.2012.08.014
Fredriksson-Ahomaa M (2019) Wild boar: a reservoir of foodborne zoonoses. Foodborne Pathog Dis 16:153–165. https://doi.org/10.1089/fpd.2018.2512
Gervasi SS, Civitello DJ, Kilvitis HJ, Martin LB (2015) The context of host competence: a role for plasticity in host–parasite dynamics. Trends Parasitol 31:419–425. https://doi.org/10.1016/j.pt.2015.05.002
Gervasi SS, Stephens PR, Hua J et al (2017) Linking ecology and epidemiology to understand predictors of multi-host responses to an emerging pathogen, the amphibian chytrid fungus. PLoS ONE 12:e0167882. https://doi.org/10.1371/journal.pone.0167882
Gómez JM, Nunn CL, Verdú M (2013) Centrality in primate–parasite networks reveals the potential for the transmission of emerging infectious diseases to humans. Proc Natl Acad Sci 110:7738–7741. https://doi.org/10.1073/pnas.1220716110
Halliday FW, Rohr JR, Laine A (2020) Biodiversity loss underlies the dilution effect of biodiversity. Ecol Lett 23:1611–1622. https://doi.org/10.1111/ele.13590
Halliday JE, Meredith AL, Knobel DL et al (2007) A framework for evaluating animals as sentinels for infectious disease surveillance. J R Soc Interface 4:973–984. https://doi.org/10.1098/rsif.2007.0237
Halsey S (2018) Defuse the dilution effect debate. Nat Ecol Evol 3:145–146. https://doi.org/10.1038/s41559-018-0764-3
Han BA, Schmidt JP, Bowden SE, Drake JM (2015) Rodent reservoirs of future zoonotic diseases. Proc Natl Acad Sci 112:7039–7044. https://doi.org/10.1073/pnas.1501598112
Hechinger RF, Lafferty KD (2005) Host diversity begets parasite diversity: bird final hosts and trematodes in snail intermediate hosts. Proc R Soc B Biol Sci 272:1059–1066. https://doi.org/10.1098/rspb.2005.3070
Huang ZYX, de Boer WF, van Langevelde F et al (2013) Dilution effect in bovine tuberculosis: risk factors for regional disease occurrence in Africa. Proc R Soc B Biol Sci 280:20130624–20130624. https://doi.org/10.1098/rspb.2013.0624
Huang ZYX, Van Langevelde F, Estrada-Peña A et al (2016) The diversity–disease relationship: evidence for and criticisms of the dilution effect. Parasitology 143:1075–1086. https://doi.org/10.1017/S0031182016000536
Johnson PTJ, Rohr JR, Hoverman JT et al (2012) Living fast and dying of infection: host life history drives interspecific variation in infection and disease risk. Ecol Lett 15:235–242. https://doi.org/10.1111/j.1461-0248.2011.01730.x
Johnson PTJ, Wood CL, Joseph MB et al (2016) Habitat heterogeneity drives the host-diversity‐begets‐parasite‐diversity relationship: evidence from experimental and field studies. Ecol Lett 19:752–761. https://doi.org/10.1111/ele.12609
Keesing F, Ostfeld RS (2015) Is biodiversity good for your health? Sci (80-) 349:235–236. https://doi.org/10.1126/science.aac7892
Keesing F, Ostfeld RS (2021) Dilution effects in disease ecology. Ecol Lett 24:2490–2505. https://doi.org/10.1111/ele.13875
Kukielka E, Barasona JA, Cowie CE et al (2013) Spatial and temporal interactions between livestock and wildlife in South Central Spain assessed by camera traps. Prev Vet Med 112:213–221. https://doi.org/10.1016/j.prevetmed.2013.08.008
Laurenson MK, Norman RA, Gilbert L et al (2003) Identifying disease reservoirs in complex systems: mountain hares as reservoirs of ticks and louping-ill virus, pathogens of red grouse. J Anim Ecol 72:177–185. https://doi.org/10.1046/j.1365-2656.2003.00688.x
Lusseau D, Newman MEJ (2004) Identifying the role that animals play in their social networks. Proc R Soc Lond Ser B Biol Sci. https://doi.org/10.1098/rsbl.2004.0225
Macdonald DW, Laurenson MK (2006) Infectious disease: inextricable linkages between human and ecosystem health. Biol Conserv 131:143–150. https://doi.org/10.1016/j.biocon.2006.05.007
Mackenstedt U, Jenkins D, Romig T (2015) The role of wildlife in the transmission of parasitic zoonoses in peri-urban and urban areas. Int J Parasitol Parasites Wildl 4:71–79. https://doi.org/10.1016/j.ijppaw.2015.01.006
MAPA (2024) Plan nacional de vigilancia sanitaria en fauna silvestre. https://www.mapa.gob.es/es/ganaderia/temas/sanidad-animal-higiene-ganadera/pvfs_tcm30-437517.pdf
Martin IILB, Hasselquist D, Wikelski M (2006) Investment in immune defense is linked to pace of life in house sparrows. Oecologia 147:565–575. https://doi.org/10.1007/s00442-005-0314-y
Martínez-López B, Perez AM, Sánchez-Vizcaíno JM (2009) Social network analysis. Review of general concepts and use in preventive veterinary medicine. Transbound Emerg Dis 56:109–120. https://doi.org/10.1111/j.1865-1682.2009.01073.x
Meng XJ, Lindsay DS (2009) Wild boars as sources for infectious diseases in livestock and humans. Philos Trans R Soc B Biol Sci 364:2697–2707. https://doi.org/10.1098/rstb.2009.0086
Murray KA, Retallick RWR, Puschendorf R et al (2011) Assessing spatial patterns of disease risk to biodiversity: implications for the management of the amphibian pathogen, Batrachochytrium dendrobatidis. J Appl Ecol 48:163–173. https://doi.org/10.1111/j.1365-2664.2010.01890.x
Niedballa J, Wilting A, Sollmann R et al (2019) Assessing analytical methods for detecting spatiotemporal interactions between species from camera trapping data. Remote Sens Ecol Conserv 5:272–285. https://doi.org/10.1002/rse2.107
Norman R, Bowers RG, Begon M, Hudson PJ (1999) Persistence of Tick-borne Virus in the Presence of multiple host species: tick reservoirs and parasite mediated competition. J Theor Biol 200:111–118. https://doi.org/10.1006/jtbi.1999.0982
O’Brien TG (2011) Abundance, density and relative abundance: a conceptual Framework. Camera traps in animal ecology. Springer Japan, Tokyo, pp 71–96
Oliver RY, Iannarilli F, Ahumada J et al (2023) Camera trapping expands the view into global biodiversity and its change. Philos Trans R Soc B Biol Sci. https://doi.org/10.1098/rstb.2022.0232
Ostfeld RS, Keesing F (2012) Effects of host diversity on infectious disease. Annu Rev Ecol Evol Syst 43:157–182. https://doi.org/10.1146/annurev-ecolsys-102710-145022
Pérez-González J, Rey-Gozalo G, Hidalgo-de-Trucios SJ (2024) Human presence is positively related to the number of bird calls and songs: assessment in a national park. Eur J Wildl Res 70:20. https://doi.org/10.1007/s10344-024-01772-9
R Core Team (2019) R: A language and environment for statistical computing. https://www.r-project.org/
Riginos C, Porensky LM, Veblen KE et al (2012) Lessons on the relationship between livestock husbandry and biodiversity from the Kenya Long-Term Exclosure experiment (KLEE). Pastor Res Policy Pract 2:10. https://doi.org/10.1186/2041-7136-2-10
Robles-Fernández ÁL, Santiago-Alarcon D, Lira-Noriega A (2022) Wildlife susceptibility to infectious diseases at global scales. Proc Natl Acad Sci. https://doi.org/10.1073/pnas.2122851119
Rohr JR, Civitello DJ, Halliday FW et al (2019) Towards common ground in the biodiversity–disease debate. Nat Ecol Evol 4:24–33. https://doi.org/10.1038/s41559-019-1060-6
Rottstock T, Joshi J, Kummer V, Fischer M (2014) Higher plant diversity promotes higher diversity of fungal pathogens, while it decreases pathogen infection per plant. Ecology 95:1907–1917. https://doi.org/10.1890/13-2317.1
Santos N, Almeida V, Gortázar C, Correia-Neves M (2015) Patterns of mycobacterium tuberculosis–complex excretion and characterization of super–shedders in naturally–infected wild boar and red deer. Vet Res. https://doi.org/10.1186/s13567-015-0270-4
Santos N, Colino EF, Arnal MC et al (2022) Complementary roles of wild boar and red deer to animal tuberculosis maintenance in multi-host communities. Epidemics 41:100633. https://doi.org/10.1016/j.epidem.2022.100633
Schieltz JM, Rubenstein DI (2016) Evidence based review: positive versus negative effects of livestock grazing on wildlife. What do we really know? Environ Res Lett 11:113003. https://doi.org/10.1088/1748-9326/11/11/113003
Schmidt K, Ostfeld R (2001) Biodiversity and the dilution effect in disease ecology. Ecology 82:609–619. https://doi.org/10.1890/0012-9658
Severson KE (1990) Can livestock be used as a tool to enhance wildlife habitat? 43rd Annual Meeting of the Society for Range Management. U.S. Department of Agriculture Forest Service. Rocky Mountain Forest and Range Experiment Station, Reno, NV, pp 1–123
Silk MJ, Croft DP, Delahay RJ et al (2017) Using Social network measures in wildlife disease ecology, epidemiology, and management. Bioscience 67:245–257. https://doi.org/10.1093/biosci/biw175
Steenweg R, Hebblewhite M, Kays R et al (2017) Scaling-up camera traps: monitoring the planet’s biodiversity with networks of remote sensors. Front Ecol Environ 15:26–34. https://doi.org/10.1002/fee.1448
Stewart Merrill TE, Johnson PTJ (2020) Towards a mechanistic understanding of competence: a missing link in diversity–disease research. Parasitology 147:1159–1170. https://doi.org/10.1017/S0031182020000943
Strauss AT, Civitello DJ, Cáceres CE, Hall SR (2015) Success, failure and ambiguity of the dilution effect among competitors. Ecol Lett 18:916–926. https://doi.org/10.1111/ele.12468
Su M, Jiang Z, Hui C (2022) How multiple interaction types affect disease spread and dilution in ecological networks. Front Ecol Evol. https://doi.org/10.3389/fevo.2022.862986
Thiere G, Milenkovski S, Lindgren P-E et al (2009) Wetland creation in agricultural landscapes: Biodiversity benefits on local and regional scales. Biol Conserv 142:964–973. https://doi.org/10.1016/j.biocon.2009.01.006
Torres RT, Fernandes J, Carvalho J et al (2020) Wild boar as a reservoir of antimicrobial resistance. Sci Total Environ 717:135001. https://doi.org/10.1016/j.scitotenv.2019.135001
Triguero-Ocaña R, Martínez-López B, Vicente J et al (2020) Dynamic network of interactions in the wildlife-livestock interface in mediterranean Spain: an epidemiological point of view. Pathogens 9:1–16. https://doi.org/10.3390/pathogens9020120
Van Buskirk J, Ostfeld RS (1995) Controlling lyme disease by modifying the density and species composition of tick hosts. Ecol Appl 5:1133–1140. https://doi.org/10.2307/2269360
Wang YXG, Matson KD, Prins HHT et al (2019) Phylogenetic structure of wildlife assemblages shapes patterns of infectious livestock diseases in Africa. Funct Ecol 33:1332–1341. https://doi.org/10.1111/1365-2435.13311
Wood CL, Lafferty KD (2013) Biodiversity and disease: a synthesis of ecological perspectives on Lyme disease transmission. Trends Ecol Evol 28:239–247. https://doi.org/10.1016/j.tree.2012.10.011
Woolhouse MEJ, Taylor LH, Haydon DT (2001) Population biology of multihost pathogens. Science (80-) 292:1109–1112. https://doi.org/10.1126/science.1059026
Young HS, Dirzo R, Helgen KM et al (2014) Declines in large wildlife increase landscape-level prevalence of rodent-borne disease in Africa. Proc Natl Acad Sci 111:7036–7041. https://doi.org/10.1073/pnas.1404958111
Young HS, Griffin RH, Wood CL, Nunn CL (2013) Does habitat disturbance increase infectious disease risk for primates? Ecol Lett 16:656–663. https://doi.org/10.1111/ele.12094
Yugo D, Meng X-J (2013) Hepatitis E virus: foodborne, waterborne and zoonotic transmission. Int J Environ Res Public Health 10:4507–4533. https://doi.org/10.3390/ijerph10104507
Acknowledgements
We are grateful to the managers and technicians of the study sites, along with the hunters and vets who helped us access the hunted wild boar for sampling. The authors are grateful to Barcelona Municipality, who supported field sampling through the contracts 13/051, 15/0174, 16/0243 and 16/0243-00-PR/01. We also thank for their collaboration: Y.F., A.G. and C.R. and JCCM staff in the province of Ciudad Real, J.A.M. in Doñana National Park, ARRECAL Huesca and M-C.A./D·F-L. in the province of Huesca, to M.M. in the area of Galicia, to F.G., J.M. and the park rangers of Redes Natural Park in Asturias, to B.C. in the area of Sierra de Gredos Regional Park, and finally to F.E. and C.M. in Murcia. We would also like to thank our colleagues from IREC for their help during fieldwork and data processing, as well as to all collaborating National and Regional Veterinary Services and Wildlife Services.
Funding
Open Access funding provided thanks to the CRUE-CSIC agreement with Springer Nature. This study benefitted from a contract to IREC-UCLM from Ministry of Agriculture, Fisheries and Food, Madrid, Spain and is supported by the European Union NextGeneration EU/PRTR [grant number PLEC2021-008113], the MCIN/AEI/10.13039/501100011033/FEDER, EU [grant numbers PID2022-141906OB-C21, PID2022-141906OB-C22], and EU Junta de Comunidades de Castilla-La Mancha [grant number SBPLY/23/180225/000008]. P.B. was supported by Juan de la Cierva 2021, NextGenerationEU, PRTR [grant number DC2022-049103-I].
Author information
Authors and Affiliations
Contributions
Conceptualization, P.B. and C.G.; Methodology, P.B.; Validation, P.B. and C.G.; Formal Analysis, P.B.; Investigation, P.B. and C.G., Resources, C.G.; Data Curation, P.B.; Writing-Original Draft Preparation, P.B.; Writing-Review and Editing, P.B. and C.G.; Visualization, P.B.; Supervision, C.G.; Project Administration, C.G.; Funding Acquisition, C.G. All authors have read and agreed to the published version of the manuscript.
Corresponding author
Ethics declarations
Ethical approval
The sampling was performed according to European (EC Directive 86/609/EEC) and Spanish laws (RD 223/1988; RD 1021/2005), current guidelines for the ethical use of animals in research, the Animal Experiment Committee of Castilla-La Mancha University and the Spanish Ethics Committee (PR-2015-03-08).
Human ethics and consent to participate
Not applicable.
Competing interests
CG is an editor of this journal and PB is an associated editor of this special issue.
Additional information
Publisher's Note
Springer Nature remains neutral with regard to jurisdictional claims in published maps and institutional affiliations.
Electronic supplementary material
Below is the link to the electronic supplementary material.
Rights and permissions
Open Access This article is licensed under a Creative Commons Attribution 4.0 International License, which permits use, sharing, adaptation, distribution and reproduction in any medium or format, as long as you give appropriate credit to the original author(s) and the source, provide a link to the Creative Commons licence, and indicate if changes were made. The images or other third party material in this article are included in the article's Creative Commons licence, unless indicated otherwise in a credit line to the material. If material is not included in the article's Creative Commons licence and your intended use is not permitted by statutory regulation or exceeds the permitted use, you will need to obtain permission directly from the copyright holder. To view a copy of this licence, visit http://creativecommons.org/licenses/by/4.0/.
About this article

Cite this article
Barroso, P., Gortázar, C. New insights into biodiversity-disease relationships: the importance of the host community network characterization. Eur J Wildl Res 70, 48 (2024). https://doi.org/10.1007/s10344-024-01799-y
Received:
Revised:
Accepted:
Published:
DOI: https://doi.org/10.1007/s10344-024-01799-y