
Abstract
In late 2019, a new Coronavirus disease (COVID-19) appeared in Wuhan, Hubei Province, China. The virus began to spread throughout many countries, affecting a large population. Polymerase chain reaction is currently being utilized to diagnose COVID-19 in suspected patients; however, its sensitivity is quite low. The researchers also developed automated approaches for reliably and timely identifying COVID-19 from X-ray images. However, traditional machine learning-based image classification algorithms necessitate manual image segmentation and feature extraction, which is a time-consuming task. Due to promising results and robust performance, Convolutional Neural Network (CNN)-based techniques are being used widely to classify COVID-19 from Chest X-rays (CXR). This study explores CNN-based COVID-19 classification methods. A series of experiments aimed at COVID-19 detection and classification validates the viability of our proposed framework. Initially, the dataset is preprocessed and then fed into two Residual Network (ResNet) architectures for deep feature extraction, such as ResNet18 and ResNet50, whereas support vector machines with its multiple kernels, including Quadratic, Linear, Gaussian and Cubic, are used to classify these features. The experimental results suggest that the proposed framework efficiently detects COVID-19 from CXR images. The proposed framework obtained the best accuracy of 97.3% using ResNet50.
1 Introduction
Coronaviruses have been responsible for two large-scale outbreaks in the last two decades: SARS and MERS. COVID-19, also known as SARS-CoV-2, is a novel human coronavirus that arose in Wuhan in Hubei Province, China, in late 2019 [1]. This virus has also been reported in almost all continents, including Europe, Australia, Asia, and America [2]. Until the 16th of February, 2022, 415 million confirmed cases had been reported worldwide, with a total of 5.84 million deaths [3]. A study shows the zoonotic origin of COVID-19, and the fast expansion suggests continuous person-to-person transmission [4]. COVID-19 is a respiratory disease characterized by symptoms ranging from a moderate infection in upper respiratory system to acute respiratory distress syndrome (ARDS) [5]. COVID-19 symptoms might differ from person to person, but some are typical. These symptoms typically emerge between 3 and 14 days. The Center for Disease Control and Prevention (CDC) [6] lists major COVID-19 symptoms: dry cough, trouble breathing, fever, muscle discomfort, sore throat, loss of smell and taste. Some of the less common symptoms are nausea, vomiting, and diarrhea. This virus has been shown to be airborne for up to 3 h, 4 h on copper surfaces, and nearly 72 h on plastic and stainless materials. However, identifying the actual nature of the virus remains an unresolved topic in the medical research world [7]. Due to surge in cases, the World Health Organization (WHO) declared COVID-19 a pandemic and public health emergency of worldwide significance [8, 9].
Early and precise diagnosis of acute COVID-19 is necessary to reduce healthcare capacity and overall death rate [10]. Since the emergence of infections, the world governments have put plenty of countermeasures to mitigate the devastation being caused. Researchers and health organizations all over the world are working feverishly to develop early disease detection and treatment approaches [11]. Scientists from all around the world have developed various COVID-19 vaccines. Many of these vaccines have already been approved and are being used for immunization in numerous countries worldwide. These vaccines include Pfizer-BioNTech, Moderna, Oxford-AstraZeneca, Sinovac and Sputnik V. Despite widespread vaccination campaigns, coronavirus infections have risen, owing primarily to new variants. However, in many countries, mass vaccine adaptation remains a problem of public health logistics (e.g., manufacturing, storing, and distributing the vaccine and mass immunization) and leadership. The problem is ascribed to various factors, including vaccination resistance among citizens and vaccine nationalism [12, 13]. Further study is required to address outstanding questions such as: would these vaccines be able to manage the pandemic? What is the efficacy of these vaccines against developing various COVID-19 variants? What are the adverse effects of contemporary vaccines, studied, developed, and tested at a fast pace on various population statistics? [7]
RT-PCR tests must validate the diagnosis of COVID-19 according to the recommendations by the Chinese government [14]. However, it has some limitations, such as long delays in obtaining the results and low sensitivity. The patients with high clinical suspicion of the virus test falsely negative on initial RT-PCR tests require multiple tests to validate the results [15]. Low test sensitivity may occur due to the following factors: suboptimal clinical sample procedures, fluctuations in viral load, and manufacturer test kit sensitivity. With communities experiencing an increase in patients, negative RT-PCR test is becoming very difficult to handle [16]. According to October 2020 recommendations by WHO, chest imaging evaluation is an effective method for detecting clinical signs of COVID-19 in patients because the infection is related to the pulmonary system [17]. The study presented by Ai et al. [14] compares the sensitivity of the Chest computed tomography (CT) and the RT-PCR tests. The Chest CT obtained a better sensitivity score than RT-PCR for detecting COVID-19 in suspected patients. Other imaging modalities include X-rays, MRIs, and needle biopsy of the lung. Compared to the CT Scans, Chest X-ray is the most commonly utilized to identify COVID-19 because CT imaging is expensive, and the high ionizing radiation levels may pose health hazards to pregnant women and children. Moreover, it takes longer to scan image and is scarcely available in low-income countries [18]. On the other hand, X-ray imaging is widely used in many medical and epidemiological applications due to its widespread availability [19, 20]. Due to ease of use by radiologists, lightweight operating speed and cheaper cost, the chest X-ray is a well-suited imaging modality for diagnosing pulmonary infections [21].
Over the past two years, various frameworks employing CNNs have been presented to detect COVID-19 from chest X-Ray images. CNN is a type of Deep Neural Networks (DNN) inspired by the biological working of the human brain and used to analyze visual imagery. CNNs are extremely efficient and require little or no preprocessing before classification. These architectures automatically extract deep features and perform classification, whereas typical Machine Learning (ML) algorithms require a manual segmentation and handcrafted feature extraction. This independence of CNNs from human interaction and prior information is a significant asset. Doctors can benefit from automated disease classification systems during the treatment procedure [22]. Several studies have been proposed to detect COVID-19 and other lung illnesses using Chest CT and X-rays; however, these techniques have limited classification accuracy and a large false-positive rate due to poor data quality and inefficient methods. Hence, there is a need for a robust approach that can distinguish between COVID-19 and normal images efficiently. As a result, we present a novel COVID-19 identification and classification approach based on well-known ResNet architectures for deep feature extraction and SVM for image classification. The contributions of the paper are as follows:
-
The input CXR images are initially preprocessed to enhance the essential features helpful for classification. We improved the contrast of dataset images and resized them to fit the CNNs’ input layer size.
-
The deep CNN features are extracted using final Fully Connected layers from Residual Network architectures such as ResNet18 and ResNet50.
-
The SVM classifier with four kernel functions such as Quadratic, Linear, Gaussian, and Cubic has been used to classify the deep CNN features.
-
The proposed method is compared to existing state-of-the-art COVID-19 classification and identification models to determine its robustness. The performance of the suggested method is evaluated using various measures such as recall, precision, f1-score, and accuracy. The proposed technique is also validated on a cross-dataset validation scenario.
2 Related work
Artificial intelligence and DL-based new methodologies have significantly impacted medical image analysis, particularly in disease detection. Since the emergence of COVID-19, researchers have been developing DL and ML based techniques for early diagnosis of COVID-19 using Chest CTs and X-rays. However, accurate diagnosis is still a challenge due to the lack of quality data and robust techniques. Xu et al. [23] provided an early prediction approach for identifying COVID-19 using ResNet18 that obtained 86.7% accuracy. Hemdan et al. [24] deployed a pre-trained CNN model, i.e., VGG16, to discriminate between COVID-19 and Normal images with 90% accuracy. Singh et al. [25] presented a novel multi-objective differential evolution-based CNN architecture for distinguishing COVID-19 from normal CT images. To detect COVID-19 from images, Loey et al. [26] used pre-trained CNNs such as GoogLeNet, AlexNet, and ResNet18 combined with Generative Adversarial Networks (GAN).
Hernandez et al. [27] suggested a COVID-19 detection and classification system using fine-tuned CNN architectures, including ResNet, VGG, and DenseNet, and reported an overall accuracy of 90%. COVID-Net, a 19-layered CNN architecture based on the principle of Residual Networks, was created by Wang et al. [20] to distinguish between normal images, bacterial infection images, and non-COVID-19 viral, and COVID-19 viral infection images. COVID-Net provided the model with the highest classification accuracy of 93.3%. In another study, Ismael et al. [28] developed an end-to-end CNN model composed of 21 layers to classify COVID-19. The novel CNN architecture achieved 91.5% classification accuracy. Despite creating a modified CNN, the system's overall accuracy was low. In another study, Narin et al. [29] proposed a ResNet50, Inception-ResNet V2 and Inception-V3 based approach to classify COVID-19. However, in order to generalize the approach to real-world scenarios, it must be trained and evaluated on datasets with more image samples.
Wang et al. [30] employed pre-trained CNN architectures to discriminate between COVID-19 and healthy images. The study reported 89.5% classification accuracy. Pathak et al. [31] employed various transfer learned residual networks architectures to classify COVID-19 infected images. They obtained the highest accuracy of 93% on publically available CT image datasets. However, the system is not robust in classifying high-intensity variations noisy images. Zhao et al. [32] applied transfer learned DenseNet architecture with 169 layers to identify the presence of COVID-19 from CT images. The system achieved 84.7% accuracy. However, the system is computationally exhausting.
The authors in Ibrahim et al. [18] fine-tuned AlexNet to identify and classify COVID-19 from images, but they did not equate the performance of their proposed system to current approaches. On the other hand, Bai et al. [33] suggest a COVID-19 detection approach employing Multi-layered perceptron with LSTM. However, the system is resource-intensive due to the combination of LSTM and multi-layered perceptron. Table 1 provides a summary of the existing COVID-19 identification methods, as well as their limitations.
3 Proposed methodology
In this paper, we propose a DL based technique to detect the presence of COVID-19 in CXR images. The detailed block diagram of the proposed method is shown in Fig. 1. Initially, the dataset images are preprocessed before being fed into two Residual Network models for deep CNN feature extraction, such as ResNet18 or ResNet50. The deep feature vectors are classified using SVM with different kernel functions: Linear, Gaussian, Cubic, and Quadratic.
-
(1)
Data preprocessing
Fig. 1 
Diagram illustrating the proposed framework
This section discusses the preprocessing techniques applied to dataset images before feeding them to CNNs for feature extraction. Initially, the contrast of CXR images in dataset is enhanced by mapping the intensity values of an input image to new values after saturating the top and bottom 1% of the pixel values. Figure 2 depicts a CXR image before and after contrast enhancement. Contrast enhancement is a technique that alters the pixel intensity of an image to use as many bins as possible. It distinguishes between dark and bright areas in an image and eliminates any ambiguity that might otherwise exist between different image regions [34]. The images are then resized to match the input layer size of CNNs.
-
(2)
Deep feature extraction using residual networks
Fig. 2 
Image before and after contrast enhancement
CNNs are widely used in various research fields due to their superior performance over traditional ML-based techniques. The architecture of CNN is biologically inspired by the human brain area called the visual cortex that contains cells sensitive to visual perception. The use of CNNs in ML derives from a 1962 study by Hubel and Weisel, who discovered that some individual neuron cells in the brain that activate only in the presence of specific edges and shapes [35]. Usually, the CNN architectures have numerous layers, as shown in Fig. 3 (convolution, pooling and fully connected) stacked on top of each other. These models learn more complicated features with an increase in architecture’s depth. The convolution layer extract features from an image by computing the dot product between the image and the kernel. The kernel slides through the image region to compute the features, bypassing particular pixels called stride. As first described by Marr, the filter detects various low-level features such as colors, edges, curves, boundaries, virtual lines and high-level features such as local surfaces, orientations, and discontinuities [36]. The convolved portion of the image is called a receptive field. The features extracted during this process serve as input to deep layers in the architecture. This layer is followed by an activation function that is responsible for converting the node's summed weighted input into the node's activation for that input. Due to ease in training and better performance, ReLU has become a default activation function for neural networks. It is responsible for reducing all negative values to zero [37].
Fig. 3 
General architecture of the CNN
One of the limitations of convolution layer’s feature map output is that it records the precise position details of the features in an input. Thus, very minor changes in the position of the feature in an image can result in a distinct feature map. This can occur when the input image is rotated, re-cropped, shifted, etc. Hence, downsampling is frequently used to create a reduced resolution version of an input signal that maintains structural parts of an image but lacks very fine or minor details that may be invaluable for the task. This downsampling process is performed using a Pooling layer that is usually placed after a Convolution layer. It decreases the spatial dimensions of an image following the convolution process. If we apply the Fully Connected Layer straight after the Convolution Layer, the system may become computationally expensive due to the high dimensionality of the image. As a result, pooling layers are utilized to scale the images and lower the dataset's spatial volume [38]. The output obtained from the convolution layers usually represents high-level features in the data. This output is generally flattened and connected to the output layer by adding a fully-connected layer to learn nonlinear combinations of these features. All neurons in a fully connected layer connect to all neurons in the previous layer. This layer combines all of the local features gathered by the preceding layers across the image to discover bigger patterns. The classifier then performs classification based on these features [39, 40].
Over the past few years, remarkable development has been made in Deep Learning. Following CNN architecture AlexNet, which won the ImageNet 2012 competition, each successive winning architecture employs more layers in a deep neural network to lower error rates. Deep Neural Networks are becoming more complex and deeper with time. It has been demonstrated that increasing the number of layers in these networks increases its performance and robustness for image-related tasks. Hence, the researchers increase the depth of the neural networks to extract important features from complex images. As a result, the initial layers may identify edges, and succeeding layers may detect complete objects at the end. However, this works for networks with fewer layers, but with network convergence, the accuracy of these models tends to be saturated. This decrease in the accuracy score is not due to overfitting but rather to a rise in error rate after increasing the depth of the network, as current solvers are unable to optimize the network efficiently. This runs counter to the popular belief that increasing layers in the network improves its performance. It may be noted that this problem does not appear due to network overfitting because, in such scenario, the dropout and regularization techniques can be used to solve this problem. But it is mostly present because of the well-known Vanishing/Exploding gradient problem. This problem causes the gradients of the loss function to approach zero or very large when more layers with specific activation functions are added to neural networks, thus making the network difficult to train and increasing train and test errors [41, 42].
In 2015, the researchers at Microsoft proposed Residual Network (ResNet). The introduction of ResNets aided in the training of very deep networks. ResNets use shortcut connections to skip one or more layers, as shown in Fig. 4. The layers fit a residual mapping rather than assuming each stack of layers immediately fits a desired underlying mapping. The original mapping is transformed into F(x) + x. Optimizing the residual mapping is simpler than optimizing the original unreferenced mapping. In the extreme, it would be easier to drive the residual to zero than to fit an identity mapping with a stack of nonlinear layers if the identity mapping was optimal [43]. The skip connections execute identity mapping, which reduces training loss and their outputs are added to the outputs of stacked layers; hence, it does not increase computational complexity. This benefits in training very deep networks by avoiding superfluous connections. There are no parameters in the identity mapping as it simply adds the output from the previous layer to the next layer [42]. In-depth evaluation shows that ResNet outperformed other CNNs by obtaining a lowest top 5% error rate at 3.57% for classification problem. Hence, it can be said that the ResNets have gained popularity for image identification and classification problems due to their ability to overcome exploding/vanishing gradient problems while adding layers to an already deep neural network [41].
Fig. 4 
Residual learning [42]
Because of Residual Networks’ superior performance in image classification, we used two ResNet architectures, ResNet18 and ResNet50, to extract deep features from CXR images. ResNet18 has 18 learnable layers, including 17 convolutional layers, a fully connected layer, and an additional softmax layer for classification. The kernel size for the convolutional layers is 3 × 3. The residual shortcut connections of ResNet18 skip two layers. The architecture of ResNet-18 is shown in Fig. 5. The ResNet50 architecture, on the other hand, contains 50 learnable layers, 48 of which are convolutional layers, a single average pooling and max-pooling layer. Unlike ResNet18, the ResNet50’s shortcut connections skip three layers rather than two. Figure 6 depicts the ResNet50 architecture. It may be noted that both ResNets have two sorts of shortcut connections. When the input and output dimensions are the same, the connections marked by straight arrows are adopted. When these dimensions expand, the other connections shown by the dotted lines are used. Figure 7 explains the detailed architecture specifications of ResNet18 and ResNet50 including details of learnable layers, their dimensions, strides and output sizes.
-
(3)
Classification
Fig. 5 
ResNet18 architecture [44]
Fig. 6 
ResNet50 architecture [45]
Fig. 7 
Residual network architecture specifications [46]
The deep feature vectors obtained from the Residual Networks are classified using SVM classifier with different kernel functions. SVM is a ML algorithm widely used in classification and regression tasks because of its stable performance. It belongs to the generalized linear classifier family that maximizes the margin between the hyperplane and the dataset to boost accuracy and avoid data overfitting. It searches for the dividing hyperplane that separates the two classes. This study employed SVM with four kernel functions, namely Linear, Cubic, Gaussian and Quadratic for classification. SVM techniques employ a set of mathematical functions known as kernels that take data as input and transform it into the desired form. The kernel functions return the scalar product of two points in highly appropriate feature space [47, 48].


4 Results and discussion
-
(1)
Dataset
The dataset used in this study is acquired from Kaggle. It consists of 15,161 CXR images distributed in four classes, i.e., COVID-19, Viral Pneumonia, Lung Opacity, and Normal. We only used Normal and COVID-19 CXR images in this study. The images in the database have a resolution of 299 × 299 pixels and are saved in the Portable Network Graphics (PNG) format [49]. The summary of the dataset is presented in Table 2. Figure 8 shows CXR samples from the dataset. We randomly divided the image dataset in the ratio of 70:30 for training and validation, respectively.
Table 2 Dataset summary Fig. 8 
Various COVID-19 and normal CXR scans
Quantification is the process of determining the relative frequency (or prevalence) of the classes of interest in a dataset. It is commonly used in data analytics and classification applications to identify whether a population segment belongs to a specific class. Some popular online quantification methods include NEMSIS, CAN, SCAN [50]. In this paper, we performed exploratory data analysis to understand the class distribution in the dataset using pie chart as shown in Fig. 9. It may be noted that we only used Normal and COVID-19 CXR images in this study. Healthy image samples compose 78% of the entire dataset. The chart shows class imbalance issues in the dataset. Our major goal is to identify COVID-19 samples to facilitate early diagnosis of the disease, hence leading to a quicker treatment. The chart clearly indicates that COVID-19 samples account for only 24% of the overall dataset, hence in such circumstances, Recall, F1-Score and Precision are more appropriate metrics than accuracy.
-
(2)
Evaluation parameters
Fig. 9 
Data distribution ratio
Model performance evaluation is crucial for developing automated systems. Given that the major goal of such a model is to predict unforeseen data accurately, thus, evaluating the training and validation test sets indicate the model's generalization capabilities. In this aspect, a confusion matrix is an important metric for aiding in evaluating a classification model. The confusion matrix is a simple cross-tabulation of actual and predicted class values for all observations in each category. Various classification measures, such as precision, recall, and f1-score based on the confusion matrix, are used as a benchmark for evaluating the proposed model’s capability. Classification accuracy is commonly used metric since it summarizes the model’s performance. The f1-score, on the other hand, integrates precision and recall into a single metric that incorporates both properties. Precision appears in Eq. (1), Recall in Eq. (2), Accuracy in Eq. (3) and F1-Score in Eq. (4).
$${\text{Precision}} = {\text{TP}}/\left( {{\text{TP}} + {\text{FP}}} \right)$$(1)$${\text{Recall}} = {\text{TP}}/\left( {{\text{TP}} + {\text{FN}}} \right)$$(2)$${\text{Accuracy}} = \left( {{\text{TP}} + {\text{TN}}} \right)/\left( {{\text{TP}} + {\text{TN}} + {\text{FP}} + {\text{FN}}} \right)$$(3)$${\text{F}}1 - {\text{Score}} = {\text{TP}}/{\text{TP}} + \frac{1}{2}\left( {{\text{FP}} + {\text{FN}}} \right)$$(4)where TP = True Positives, TN = True Negative, FP = False Positive, FN = False Negative.
-
(3)
Proposed method results
This section presents the results of the experiments carried out in this study. All the experiments are performed on a machine with Intel Core i5 processor and 8 GB RAM using Deep Learning and Machine Learning Toolboxes of Matlab R2021a. We used two CNN architectures (ResNet18 & ResNet50) to extract deep features supplied to SVM with different kernels (Linear, Cubic, Quadratic and Gaussian) for classification. Table 3 shows the obtained accuracy of feature vectors obtained via different kernel functions. The SVM kernel types are shown in the rows and the Residual Network models in the columns. The average accuracy scores are shown in the last row and column of the table. ResNet18 and SVM classifier with Quadratic kernel achieved the maximum accuracy of 96.4%. The Cubic and Quadratic kernel functions, on the other hand, achieved 97.3% on classifying feature vectors obtained from ResNet50. According to the table, ResNet50 model provided the highest average accuracy of 96.6%, while the ResNet18 model produced an average accuracy of 95.7%. When the results are reviewed in terms of the kernel functions, it is clear that the Cubic kernel function produced the best overall accuracy of 96.9%, whereas the Quadratic-kernel-based SVM classifier produced the second-best average accuracy score of 96.8%. Other kernel functions such as Linear and Gaussian achieved an accuracy of 94.2% and 96.7%, respectively. The proposed method is capable of detecting COVID-19 from CXR images within 3–5 s.
Table 3 Accuracy scores of residual networks and SVM classifiers on COVID-19 classification Figure 10 shows the confusion matrix of the highest performing kernel on the feature vector obtained from ResNet18. The confusion matrices are used to summarize the prediction outcomes of a classification problem. It demonstrates the ways the classification model becomes confused when making new predictions. The X-axis of the matrix indicates the target class, while the Y-axis represents the output class. SVM correctly classified 987 COVID-19 samples and 3014 normal samples according to the confusion matrix. However, it misclassified 43 COVID-19 samples and 98 normal samples. Thus, obtaining the classification accuracy of 96.6%.
Fig. 10 
Confusion matrix of ResNet18 and cubic SVM classifier
Figure 11 presents the confusion matrix of best-performing kernels (Cubic and Quadratic) on ResNet50’s feature vector. The Cubic kernel correctly identified 1015 COVID-19 samples and 3017 normal sample but misclassified 40 COVID-19 samples and 70 normal samples. Thus, obtaining classification accuracy of 97.34%, whereas Quadratic kernel accurately classified 1017 COVID-19 and 3015 normal samples and misdiagnosed 42 COVID-19 and 68 normal samples, achieving an accuracy of 97.34%.
Fig. 11 
Confusion matrix of ResNet50 and a Cubic SVM b Quadratic SVM
The performance of our proposed technique is also assessed using precision, recall, and f1-score, as shown in Fig. 12. The ResNet50-based classification model outperformed the ResNet18-based classification model in terms of overall performance due to more extraction of more complicated features given the depth of the network design.
-
(4)
Cross dataset validation
Fig. 12 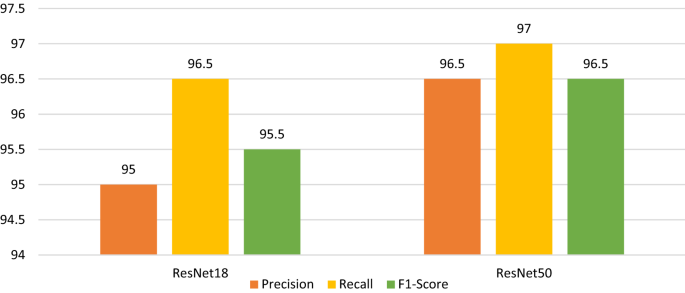
Precision, recall and F1-score values obtained for ResNet18 and ResNet50
The provided method’s robustness is evaluated using a cross-dataset validation scenario to demonstrate its applicability in real-world settings. The performance of the proposed technique is assessed using CXR images from the Kaggle dataset [51]. Our work accurately identified 72/77 COVID-19 samples and 77/77 Normal CXR samples during the cross-dataset validation process. As a result of the cross-database validation, we can infer that our method can be used in real-time to detect the presence of COVID-19 in CXR images.
-
(5)
Comparison with state-of-the-art techniques
Table 4 compares the performance of our proposed COVID-19 detection method with existing techniques in terms of accuracy. Xu et al. [23] deployed ResNet18 and achieved 90% accuracy. Hemdan et al. [24] fine-tuned VGG16 architecture to detect the presence of COVID-19 in CXR images and achieved 90% accuracy. However, in order to generalize better on real-world circumstances, the technique requires training on a larger dataset. The authors in Wang et al. [20] developed a 19 layered CNN architecture based on the idea of Residual Networks to discriminate between normal, bacterial infection, non-COVID-19 viral infection and COVID-19 viral infection. The system obtained the highest classification accuracy of 93.3%. However, the technique is not robust to images with intensity variations. In another study, Ismael et al. [28] developed an end-to-end CNN model containing 21 layers to classify COVID-19 that achieved 91.5% classification accuracy. The technique, however, obtained low overall accuracy. Hence, it must be thoroughly evaluated before being used for real-time COVID-19 detection. On the other hand, our proposed method achieved 96.4% accuracy using ResNet18 and 97.3% using ResNet50. The provided results demonstrate the suggested method’s efficiency and robustness when compared to existing methodologies.
Table 4 Result comparison with state-of-the-art techniques


5 Conclusion
This paper introduces a Residual Network-based automatic COVID-19 identification and classification system. The images in the dataset are first preprocessed before being fed into ResNet18 and ResNet50 to extract deep CNN features. The SVM classifier with different kernel functions is then used to classify the deep features vectors. Various assessment measures, such as Accuracy, Precision, F1-Score and Recall, are used to evaluate the suggested method's performance. With 96.4% accuracy and 97.3% accuracy, SVM classified the deep feature vector derived from ResNet18 and ResNet50, respectively. Moreover, we also evaluated the performance of our proposed method on a cross-dataset scenario. The proposed technique is robust and can detect COVID-19 in real-time. However, the dataset used in this study is imbalanced. Generally, a balanced data set with an equal class distribution produces a higher prediction accuracy. It may be noted that a balanced dataset makes it easier for the classification system to learn. However, the class imbalance was obvious because the images in the dataset were gathered from publically available datasets. Hence, additional COVID-19 CXR images will be collected in the future, and other CNN models will be explored for COVID-19 detection. Moreover, other lung illnesses will also be studied in the future, with the COVID-19 disease displaying different stages of mutation and imagistic patterns.
Data availability
All data generated or analyzed during this study are included in this published article.
References
Nayak SR, Nayak DR, Sinha U, Arora V, Pachori RB (2021) Application of deep learning techniques for detection of COVID-19 cases using chest X-ray images: a comprehensive study. Biomed Signal Process Control 64:102365
Ayoobi N et al (2021) Time series forecasting of new cases and new deaths rate for COVID-19 using deep learning methods. Results Phys 27:104495
Worldometer. (2021, 2022). CoronaVirus. Available: https://www.worldometers.info/coronavirus/
Ghinai I et al (2020) First known person-to-person transmission of severe acute respiratory syndrome coronavirus 2 (SARS-CoV-2) in the USA
Petrosillo N, Viceconte G, Ergonul O, Ippolito G, Petersen EJCM, and Infection (2020) COVID-19, SARS and MERS: are they closely related?
(2020) Symptoms of coronavirus. Available: https://www.cdc.gov/coronavirus/2019-ncov/symptoms-testing/symptoms.html
Badawi A, Elgazzar K (2021) Detecting coronavirus from chest X-rays using transfer learning. COVID 1(1):403–415
Xu T et al. (2020) Clinical features and dynamics of viral load in imported and non-imported patients with COVID-19
(2020) Available: https ://www.who.int/health-topics/coronavirus
Rousan LA, Elobeid E, Karrar M, Khader Y (2020) Chest x-ray findings and temporal lung changes in patients with COVID-19 pneumonia. BMC Pulm Med 20(1):1–9
Cascella M, Rajnik M, Cuomo A, Dulebohn SC, Di Napoli R (2020) Features, evaluation and treatment coronavirus (COVID-19). Statpearls [internet]
Alafif T, Tehame AM, Bajaba S, Barnawi A, Zia S (2021) Machine and deep learning towards COVID-19 diagnosis and treatment: survey, challenges, and future directions. Int J Environ Res Public Health 18(3):1117
Maguolo G, Nanni L (2021) A critic evaluation of methods for covid-19 automatic detection from x-ray images. Inf Fusion 76:1–7
Ai T et al. (2020) Correlation of chest CT and RT-PCR testing in coronavirus disease 2019 (COVID-19) in China: a report of 1014 cases. 200642
Hall LO, Paul R, Goldgof DB, Goldgof GM (2020) Finding covid-19 from chest x-rays using deep learning on a small dataset. arXiv preprint arXiv:2004.02060
Jin Y-H et al (2020) A rapid advice guideline for the diagnosis and treatment of 2019 novel coronavirus (2019-nCoV) infected pneumonia (standard version). Mil Med Res 7(1):4
Hussain E, Hasan M, Rahman MA, Lee I, Tamanna T, Parvez MZ (2021) CoroDet: a deep learning based classification for COVID-19 detection using chest X-ray images. Chaos Solitons Fractals 142:110495
Ibrahim AU, Ozsoz M, Serte S, Al-Turjman F, Yakoi PS (2021) Pneumonia classification using deep learning from chest X-ray images during COVID-19. Cogn Comput 1–13
Zu ZY, et al (2020) Coronavirus disease 2019 (COVID-19): a perspective from China. 200490
Wang L, Lin ZQ, Wong A (2020) Covid-net: a tailored deep convolutional neural network design for detection of covid-19 cases from chest x-ray images. Sci Rep 10(1):1–12
Ahammed K, Satu MS, Abedin MZ, Rahaman MA, Islam SMS (2020) Early detection of coronavirus cases using chest x-ray images employing machine learning and deep learning approaches. medRxiv
Kibriya H, Rafique R, Ahmad W, Adnan S (2021) Tomato leaf disease detection using convolution neural network. In: 2021 international bhurban conference on applied sciences and technologies (IBCAST). IEEE, pp 346–351
Xu X et al (2020) A deep learning system to screen novel coronavirus disease 2019 pneumonia. Engineering 6(10):1122–1129
Hemdan EE-D, Shouman MA, Karar ME (2020) Covidx-net: a framework of deep learning classifiers to diagnose covid-19 in x-ray images. arXiv preprint arXiv:2003.11055
Singh D, Kumar V, Kaur M (2020) Classification of COVID-19 patients from chest CT images using multi-objective differential evolution–based convolutional neural networks. Eur J Clin Microbiol Infect Dis 39(7):1379–1389
Loey M, Smarandache F, Khalifa NEM (2020) Within the lack of COVID-19 benchmark dataset: a novel gan with deep transfer learning for corona-virus detection in chest x-ray images. Symmetry 12(4):1–19
Hernandez D, Pereira R, Georgevia P (2020) COVID-19 detection through x-ray chest images. In: 2020 international conference automatics and informatics (ICAI). IEEE, pp 1–5
Ismael AM, Şengür A (2021) Deep learning approaches for COVID-19 detection based on chest x-ray images. Expert Syst Appl 164:114054
Narin A, Kaya C, Pamuk ZJAPA (2020) Automatic detection of coronavirus disease (covid-19) using x-ray images and deep convolutional neural networks.
Wang S, et al. (2021) A deep learning algorithm using CT images to screen for Corona Virus Disease (COVID-19). Eur Radiol 1–9
Pathak Y, Shukla PK, Tiwari A, Stalin S, Singh S (2020) Deep transfer learning based classification model for COVID-19 disease. Irbm
Zhao J, Zhang Y, He X, Xie P (2020) Covid-ct-dataset: a ct scan dataset about covid-19. arXiv preprint arXiv:2003.13865
Bai X et al (2020) Predicting COVID-19 malignant progression with AI techniques. SSRN J. https://doi.org/10.2139/ssrn.3557984
Bora DJ (2017) Importance of image enhancement techniques in color image segmentation: a comprehensive and comparative study. arXiv preprint arXiv:1708.05081
Hubel DH, Wiesel TN (1962) Receptive fields, binocular interaction and functional architecture in the cat’s visual cortex. J Physiol 160(1):106–154
Marr D (1977) Representing visual information
Brownlee J (2019) A gentle introduction to the rectified linear unit (ReLU). Available: https://machinelearningmastery.com/rectified-linear-activation-function-for-deep-learning-neural-networks/
Brownlee J (2019) A gentle introduction to pooling layers for convolutional neural networks. Available: https://machinelearningmastery.com/pooling-layers-for-convolutional-neural-networks/
Hassanien AE, Gaber T (2017) Handbook of research on machine learning innovations and trends. IGI global, Pennsylvania
Ouchicha C, Ammor O, Meknassi M (2020) CVDNet: a novel deep learning architecture for detection of coronavirus (Covid-19) from chest x-ray images. Chaos Solitons Fractals 140:110245
(2020) Introduction to residual networks. Available: https://www.geeksforgeeks.org/introduction-to-residual-networks/
He K, Zhang X, Ren S, Sun J (2016) Deep residual learning for image recognition. In: Proceedings of the IEEE conference on computer vision and pattern recognition. pp 770–778
Dietz M (2017) Understand deep residual networks—a simple, modular learning framework that has redefined state-of-the-art. Available: https://medium.com/@waya.ai/deep-residual-learning-9610bb62c355
Ramzan F et al (2020) A deep learning approach for automated diagnosis and multi-class classification of Alzheimer’s disease stages using resting-state fMRI and residual neural networks. J Med Syst 44(2):1–16
Abd ElGhany S, Ibraheem MR, Alruwaili M, Elmogy M (2021) Diagnosis of various skin cancer lesions based on fine-tuned ResNet50 deep network. CMC-Comput Mater Contin 68(1):117–135
Wu H, Xin M, Fang W, Hu H-M, Hu Z (2019) Multi-level feature network with multi-loss for person re-identification. IEEE Access 7:91052–91062
Suthaharan S (2016) Support vector machine. Machine learning models and algorithms for big data classification. Springer, New York, pp 207–235
Xue H, Yang Q, Chen S (2009) SVM: support vector machines. The top ten algorithms in data mining. Chapman and Hall/CRC, Boca Raton, pp 51–74
Kaggle (ed) COVID-19 radiography database
Kar P, Li S, Narasimhan H, Chawla S, Sebastiani F (2016) Online optimization methods for the quantification problem. In: Proceedings of the 22nd ACM SIGKDD international conference on knowledge discovery and data mining, pp 1625–1634.
Patel P, Kaggle (eds) (2021) Chest X-ray (Covid-19 & Pneumonia)
Author information
Authors and Affiliations
Corresponding author
Ethics declarations
Conflicts of interest
The authors declare that they have no conflicts of interest to report regarding the present study.
Additional information
Publisher's Note
Springer Nature remains neutral with regard to jurisdictional claims in published maps and institutional affiliations.
Rights and permissions
Springer Nature or its licensor (e.g. a society or other partner) holds exclusive rights to this article under a publishing agreement with the author(s) or other rightsholder(s); author self-archiving of the accepted manuscript version of this article is solely governed by the terms of such publishing agreement and applicable law.
About this article

Cite this article
Kibriya, H., Amin, R. A residual network-based framework for COVID-19 detection from CXR images. Neural Comput & Applic 35, 8505–8516 (2023). https://doi.org/10.1007/s00521-022-08127-y
Received:
Accepted:
Published:
Issue Date:
DOI: https://doi.org/10.1007/s00521-022-08127-y