
Abstract
Field observations have previously identified rapid cyclic changes in the behaviour of the lava lake of Erebus volcano. In order to understand more fully the nature and origins of these cycles, we present here a wavelet-based frequency analysis of time series measurements of gas emissions from the lava lake, obtained by open-path Fourier transform infrared spectroscopy. This reveals (i) a cyclic change in total gas column amount, a likely proxy for gas flux, with a period of about 10 min, and (ii) a similarly phased cyclic change in proportions of volcanic gases, which can be explained in terms of chemical equilibria and pressure-dependent solubilities. Notably, the wavelet analysis shows a persistent periodicity in the CO2/CO ratio and strong periodicity in H2O and SO2 degassing. The ‘peaks’ of the cycles, defined by maxima in H2O and SO2 column amounts, coincide with high CO2/CO ratios and proportionally smaller increases in column amounts of CO2, CO, and OCS. We interpret the cycles to arise from recharge of the lake by intermittent pulses of magma from shallow depths, which degas H2O at low pressure, combined with a background gas flux that is decoupled from this very shallow magma degassing.
Introduction
The composition of gases emitted by volcanoes is the result of a complex set of conditions, including initial magma composition, pressure, temperature, ascent pathways, and the degree of physical and chemical coupling between gas and melt. The interaction between gas and melt is a key control on the nature of volcanic activity. Inverse modelling of plume gas measurements to characterise their origins therefore provides insights into the deeper processes driving surface behaviour.
If the measured gas species are in thermodynamic equilibrium, the pressure and temperature conditions for a given composition can be calculated from known equilibrium constants, provided that sufficient numbers of redox equilibria are constrained (e.g. Gerlach and Nordlie 1975; Giggenbach 1987). However, interpreting degassing history is complicated since the composition of the gas phase changes as magma ascends. With an increasing body of experimental work to understand the solubility and redox relationships of different volatile species, thermodynamic models for degassing that incorporate empirical solubility laws are becoming available (Burgisser et al. 2012, 2015; Alletti et al. 2014).
Erebus volcano on Ross Island, Antarctica, is an excellent natural laboratory to study magma degassing from a long-lived lava lake. The phonolite lake emits gases continuously in a passive manner, with only sporadic explosive ejection of lava bombs beyond the lake due to large bubble bursts (Gerst et al. 2013). Focusing on the passive degassing regime in December 2004, Oppenheimer et al. (2009) identified cycles of 4 to 15 min in plume gas ratios, in which peaks in SO2/CO2 and HCl/CO ratios, and also in H2O, SO2, and HF abundances coincided with increased rates of lake surface motion and heat loss. These cycles, which they associated with bidirectional flow in the conduit, are key to understanding the processes that sustain the lava lake. Oppenheimer et al. (2009) argued for two sources of passive degassing with distinctive signatures: a ‘conduit gas’ rich in CO2 and a ‘lake gas’ rich in H2O and SO2. In this model, CO2-rich conduit gas exsolves continuously at depth. When the gas approaches the surface, it passes through permeable magma in the conduit without being significantly modified. In contrast, lake gas is derived from shallow degassing of magma slugs that episodically (on the quasi-10-min cycle) enter the lake, increasing its motion and heat emissions. The episodic delivery of magma batches could reflect unsteady flow conditions in the upper conduit, associated with the nature of exchange flow (e.g. Witham and Llewellin 2006; Huppert and Hallworth 2007). The cycle was subsequently identified in other parameters, including SO2 flux (Boichu et al. 2010) and lake elevation (Jones et al. 2015), while Peters et al. (2014) demonstrated its persistence over a decade of observations.
The behaviour of the full set of gas species (H2O, CO2, CO, SO2, HF, HCl, OCS) measured by Fourier transform infrared (FTIR) spectroscopy was not evaluated in detail by Oppenheimer et al. (2009). Furthermore, there was no attempt to search for leads and lags in gas composition (i.e. to consider whether the timing of cycles is identical between gases, or whether phase differences occur, reflecting redox and solubility controls). The clarity of the cycles depends on dispersal of the plume above the lake—often, gases re-circulate in the crater, hiding the cycles. Here, we focus on a particularly clear set of cyclic gas observations made on 18 December 2004. What makes this dataset stand out from comparable FTIR spectroscopic data obtained at Erebus over a decade of field seasons are the clear cycles in the column amounts (CAs) of all seven gases (online resource 1).
The retrieved gas compositions are analysed using wavelet transforms, which are well suited to investigation of non-stationary signals (i.e. signals that may have fundamental changes in frequency content over time) in volcanic gas data (Oppenheimer et al. 2009; Spampinato et al. 2012; Tamburello et al. 2013; Pering et al. 2014). We take advantage of the clarity of cycles in gas CAs to study differences in phase and power of the cycles between gas species. Potential source regions for the measured gas compositions are then examined using the D-Compress model (Burgisser et al. 2012, 2015). Our overall aim is to come closer to understanding the processes driving pulsatory behaviour of the Erebus lava lake. We expect the analysis to inform interpretation of comparable cyclic behaviour observed at other volcanoes (e.g. Spampinato et al. 2012; Pering et al. 2014).
Methods
Field methods and retrievals
Field methods and analysis procedures follow Oppenheimer and Kyle (2008) and Oppenheimer et al. (2009). A telescope-mounted MIDAC M-4402-1 FTIR spectrometer with an indium-antimonide detector was set up on the crater rim, viewing the surface of the lava lake at a distance of about 300 m (Fig. 1). Successive batches of eight interferograms were co-added (yielding time steps of about 8.5 s). More than 4000 measurements were collected spanning over 10 h of observation (03:16 to 13:42 UTC, 18 December 2004). Conditions were clear and sunny with light wind, and the optical path intersected the plume close to its source within tens of seconds after emission (Fig. 1), with limited contribution from previously released gases. The 10-in. Newtonian telescope provided a nominal field of view of 3 mrad (i.e. a footprint on the lake of order 1 m).

a Main lava lake, 12 December 2004, inside Inner Crater. b Field setup, 18 December 2004, showing the position of the FTIR spectrometer relative to the lava lake
Gas CAs were retrieved following Burton (1999). This retrieval code synthesises a spectrum containing the gases of interest over a prescribed spectral window, using the HITRAN database (Rothman et al. 2009) and Reference Forward Model (online resource 1). Seven magmatic gases were retrieved: H2O, CO2, CO, SO2, HF, HCl, and OCS. The model gives a ‘goodness of fit’, which is the fitting error between calculated and measured spectra. This was used to screen out poor quality data (we present here only retrievals with errors below 5 %, except for OCS and HF, for which fitting errors were higher and up to 10 % was accepted). Corrections were required for the contribution of atmospheric CO2 and H2O to measured CAs. The data were divided into contiguous batches of spectra, each spanning about 100 min. For each segment, background CO2 and H2O amounts were given by the y-intercept of a linear regression against CO (whose background abundance is negligible). These values were subtracted from the corresponding retrieved CAs to yield the volcanic CO2 and H2O quantities.
Wavelet power spectra
Wavelet power spectra can reveal the presence or absence of periodicity in time series. They provide better time and frequency localisation than Fourier transform-based methods and so are more suitable for analysing periodicity in non-stationary time series (Torrence and Compo 1998). We used a Morlet wavelet and the code of Grinsted et al. (2004). We applied an initial Fourier resampling of the data to provide a time series with uniform steps. Wavelet periodograms were generated showing the power spectra, which represent the strength of the periodicity at different times and for different periods, for the CA time series of each gas (online resource 2).
Wavelet coherence was used to compare periodicities between gases. Coherence was derived from normalisation of the cross-wavelet spectrum by smoothed functions of each of the input power spectra. Cross-correlation calculates shared power between two sets of wavelet transforms, revealing strong periodicities common to both datasets. Coherence, however, is not dependent on power and shows common periodicity between two datasets regardless of the strength of the original periods (Torrence and Compo 1998; Torrence and Webster 1999). It also shows phase relationships between the two datasets.
The following plots were generated:
-
(i)
Time series plots showing temporal variations of gas CAs and gas ratios (e.g. Fig. 2)
Fig. 2 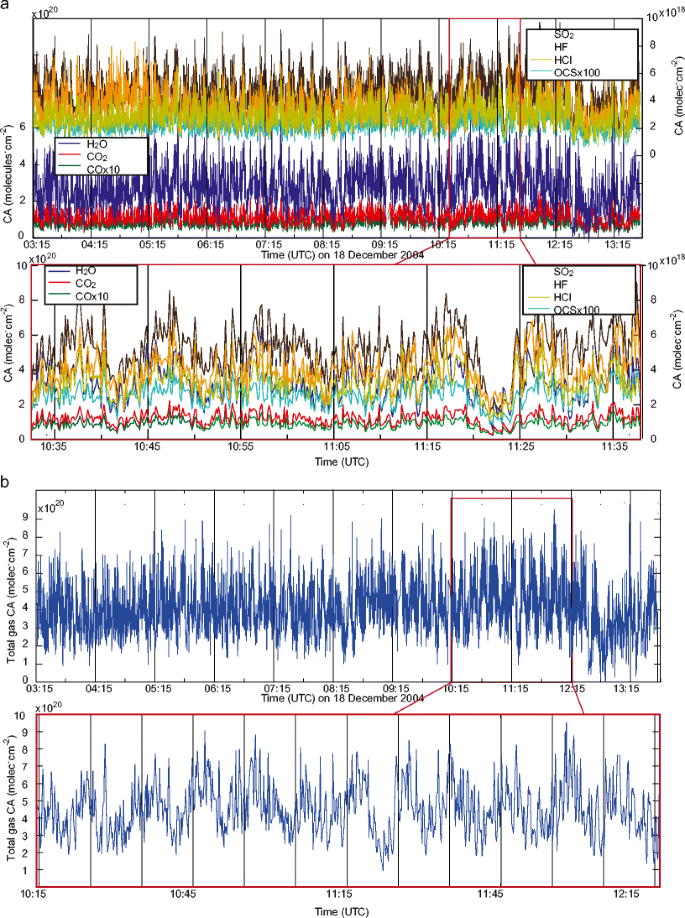
a Time series of gas column amounts (CAs), 18 December 2004, retrieved from FTIR spectra for each volcanic gas species in this study, with corrections for background CO2 and H2O. b Time series of total gas CA, derived from the sum of the seven volcanic gas species. Note cycles of approx. 10-min duration in all gases and total gas CA
-
(ii)
Scatter plots between pairs of gases (Fig. 3)
Fig. 3 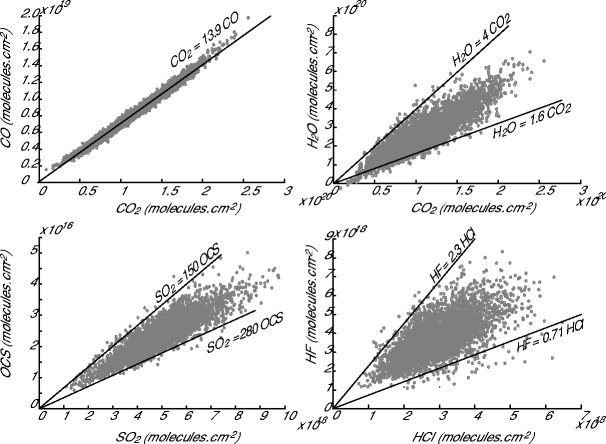
Scatter plots of retrieved CA for selected gases, 18 December 2004. CO2 and H2O corrected for background. Note tightly constrained CO/CO2 ratio. Lines show potential range of ratios at the top and bottom of cycles
-
(iii)
Wavelet periodograms of gas CAs, showing the power of periodicities found within the time series measurements of each gas (Fig. 4)
Fig. 4 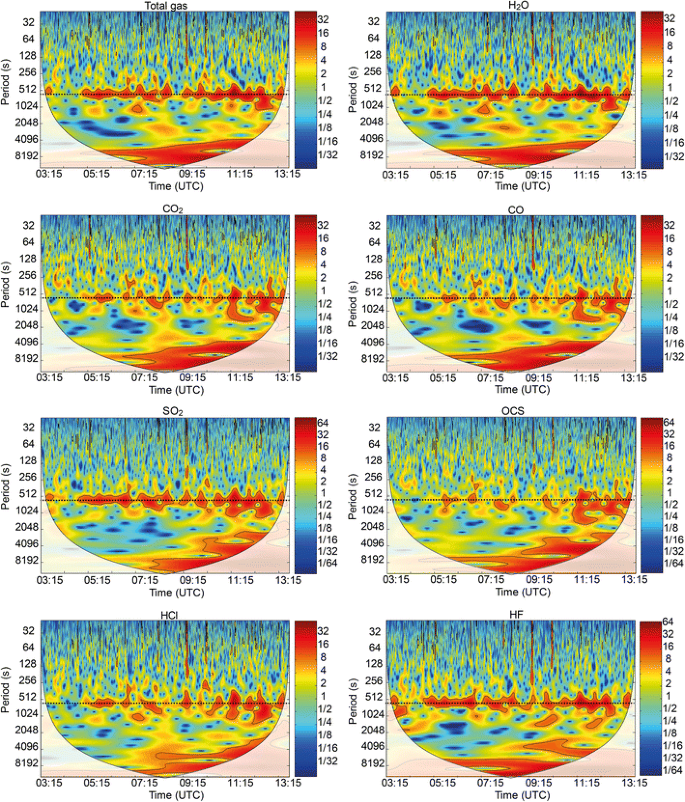
Wavelet periodograms for gas CA from 03.16 to 13.42 UTC on 18 December 2004. Colour scale shows wavelet power normalised by variance. White area is outside the cone of influence due to edge effects from the wavelet. Black contours mark 5 % significance from significance tests described by Grinsted et al. (2004). Note prominent high power at a period of 600 s (dotted black line) in all plots
-
(iv)
Coherence plots based on wavelet coefficients of two individual datasets (e.g. gases)—these show the coupling of the periodicity in both gases, even in areas of low power periodicity (Figs. 5 and 6)
Fig. 5 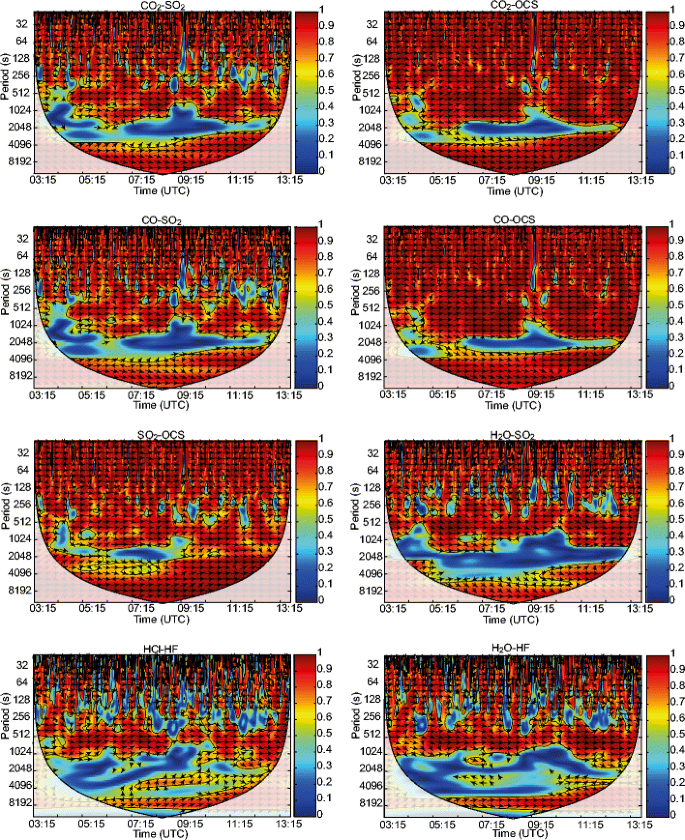
Wavelet coherence for gas CA pairs. Colour scale shows coherence (1 indicates complete correlation). Areas within 95 % confidence level from Monte Carlo simulation (black lines) are greater for CO–OCS and CO2–OCS coherence compared with plots including SO2, and smaller for HCl–HF and H2O–HF coherence. Note bands of higher coherence at 600 s and 100–130 min, and low coherence centred at 17–60 min. Arrows show phase differences: pointing right—in phase; left—out of phase; down—first gas leading; up—second gas leading
Fig. 6 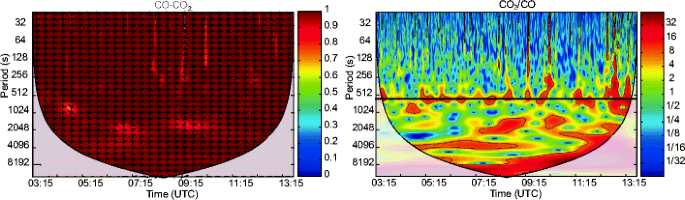
Wavelet coherence for CO–CO2 CAs (left) and wavelet periodogram for CO2/CO ratio (right). Phase arrows in the coherence plot represent lag between cycles in the input power spectra (arrow right—in phase; left—out of phase; down—CO leading; up—CO2 leading). Note high coherence at all times and across periods, and strong periodicity at 600 s in CO2/CO. Black contours mark 95 % confidence
-
(v)
Wavelet periodograms of gas ratios, showing periodicity of the relationship between two gases (Figs. 6 and 7)
Fig. 7 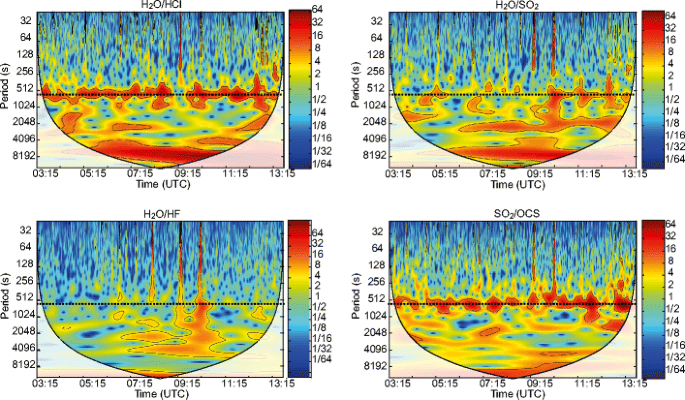
Wavelet periodograms for selected gas ratios. Note prominent periodicity at 600 s (dotted line) in H2O/HCl and SO2/OCS ratios, compared to less persistent periodicities in H2O/SO2 and H2O/HF ratios. Black contours mark 95 % confidence


Interpretations of wavelet plots
Areas of strong periodicity common to any two gas CAs, as shown by high power in their individual wavelet periodograms (e.g. Fig. 2), were considered to reflect a common degassing process and/or a direct relationship between those two gases. When these areas are restricted to certain period bands, the common process was inferred to be cyclic.
High cross-wavelet correlation, while it may indicate areas of strong periodicity that are common to both gases, was not in itself a good indicator of linked processes, as high periodicity in one gas CA can cause apparent high correlation (Grinsted et al. 2004). Instead, high coherence between CAs of two gases was interpreted as an indicator of common influences on degassing. When high coherence between two CAs of gases extends over many periods, rather than being limited to bands of strong periodicity, this indicated a coupling between the two gases independent of the common cyclic degassing process.
Finally, we considered strong periodicities in the ratio of two species. If both gases contained the same periodicities in their CA periodograms as in the periodogram of their ratio, the periodicity may be due to one gas being more strongly influenced by the cyclic degassing than the other. A more specific case was when a gas pair was highly coherent across periods and the periodogram of the ratio between the two gases showed a strong periodicity band. Given generally high coherence, we could expect the common cyclic process to affect both gases similarly, such that no periodicity occurred. The presence of strong periodicity in their ratio was taken to indicate that the common process may be causing their relationship to change cyclically.
D-Compress
The D-Compress thermodynamic model is based on experimentally determined solubility laws for key species (H2O, CO2, H2, SO2, H2S) and redox equilibrium equations for gaseous carbon-, oxygen-, hydrogen-, and sulphur-bearing species (Burgisser and Scaillet 2007; Burgisser et al. 2012; Alletti et al. 2014). Given relative proportions of these volatiles as gas ratios, CO2/H2O, CO2/CO, OCS/SO2, CO2/SO2, and optionally CO2/HCl, and assuming that the gases are at equilibrium, D-Compress calculates equilibrium temperature at a given pressure. It can then perform backward ‘recompression’ of the equilibrium gas composition to calculate the previous composition at a higher pressure. Recompression can be ‘gas-only’, i.e. gas is decoupled from melt, or closed-system, in which melt and gas are coupled and the porosity (gas volume fraction in the magma) at the surface is specified.
The version of the model used here incorporates solubility laws for phonolites. Water solubility is derived from experimental data obtained for Erebus anorthoclase phonolite; however, sulphur and carbon dioxide solubility laws derive from experimental data for other phonolites (Burgisser et al. 2012). Here, D-Compress was used to calculate equilibrium temperatures based on our gas measurements, assuming a melt density of 2455 kg m−3 (Molina 2012) and local atmospheric pressure (620 hPa). We also attempted backward tracking using selected gas compositions, following procedures described in Burgisser et al. (2012).
Results
Gas retrievals from FTIR spectra
Overall, H2O is the dominant gas by volume measured at Erebus, about 60 to 70 mol%, followed by CO2 (20–35 %), CO (1–3 %), SO2 (1–2 %), HF (<2 %), HCl (<1 %), and OCS (<0.01 %).
Figure 2 shows time series plots for our circa 10-h dataset. Total CA, as well as the CA of all individual gases, varies cyclically. Note that troughs of the cycles are generally wider and flatter than peaks. The cycles are not smooth, as they contain local maxima and minima, with the former showing a greater range of amplitudes than the latter, but individual cycles lack consistent skew. Peak heights are more variable than troughs, and the mean CA for each time series is consistently higher than the median, reflecting the narrow and high shapes of the peaks.
Bivariate plots (Fig. 3) show varying degrees of scatter for different pairs of gases, ranging from tightly constrained (CO2/CO) to more scattered (HF/HCl). This scatter is consistent with cyclically changing gas ratios; accordingly, the slopes of linear regressions that provide an envelope to the data correspond to maximum and minimum ratios through the set of cycles.
Wavelet analysis
Figure 4 shows the periodograms of CAs for the total gas and the seven measured gas species. There is a recurrent periodicity between 512 and 1024 s, which is strongest at about 10 min. Some periodograms (e.g. H2O, CO2) show significant periodicity at 2048–4096 s, which is apparent also in data from other years (e.g. 2010, not shown). There are higher power periodicities above 4096 s but these extend beyond the ‘cone of influence’, where edge effects prevail.
In the coherence plots (Figs. 5 and 6), there is a very low coherence band between about 1024–3600 s on the period axis, in which there are no periodicities and the behaviours of any two gases do not appear linked. The low coherence bands are present in the coherence plots of most gas pairs and are therefore unlikely to be due to inadequate background corrections for H2O and CO2. CO–CO2 (Fig. 6) has very high coherence overall, but even for this pair, there is lower coherence in the 1024- to 3600-s band compared to other periods.
At higher frequencies, strong periodicities are less common, but coherence is generally high for many gas pairs, for example SO2–OCS (Fig. 5) and CO–CO2 (Fig. 6), suggesting that changes in output for both gases coincide at high frequencies. Regions with ephemeral high power over a wide period range may arise from small (<3 min) data gaps (‘Wavelet power spectra’; online resource 2). Adapting the filtering procedure to avoid gaps requires including retrievals with high fitting errors, which also cause high-frequency periodicity. A comparison of wavelets generated with and without filtering and resampling showed that this does affect wavelet results, particularly at high frequencies, but that the structures at lower frequencies persist. We therefore neglect here the high-frequency perturbations.
Figure 7 shows periodograms for selected gas ratios. Some ratios, such as SO2/OCS, H2O/HCl, and to a lesser extent CO/CO2 (Fig. 6), have high-power persistent cycles at 10 min. Others, including H2O/SO2 and H2O/HF, do not exhibit such clear cycles.
D-Compress model output
Equilibrium temperature
D-Compress runs indicate high equilibrium temperatures, up to and above 1100 °C, for gas compositions at the surface (Fig. 8). This is consistent with previous calculations of lake temperature using the same model (Burgisser et al. 2012). However, it is significantly higher than various other estimates summarised by Calkins et al. (2008) and those based on phase equilibrium experiments conducted on Erebus phonolite, which indicate a magma temperature of 925–975 °C (Moussallam et al. 2013). The reason for this discrepancy remains unclear, and it remains to be determined which methodology is yielding the most accurate estimates of temperature. In the light of this uncertainty, we focus on relative changes in our computed equilibrium temperatures.

Wavelet coherence (WCT) and time series of total gas CAs (blue) and equilibrium temperature (green) calculated using D-Compress. Note periodicity in temperature appears irregular and out of phase (see phase arrows) with periodicity of gas CAs. Coherence between temperature and total gas CA is also irregular at 10-min period
An unexpected result is the phase difference between total gas CA and the equilibrium temperatures calculated by D-Compress (Fig. 8; phase arrows in coherence plot). Equilibrium temperature apparently leads total gas CA—dominated by H2O—by between one eighth and half a cycle (out of phase), which in a 10-min cycle represents about 75–300 s. Conversely, it is possible that gas CA leads with a phase difference exceeding 300 s.
We find that the troughs of cycles correspond to a higher equilibrium temperature than the peaks. If the cycle peaks represent the combination of pulsatory ‘lake’ and persistent ‘conduit’ gas emissions, the difference between these peaks and the conduit gas at the trough can be used to approximate the contribution of lake gas (Oppenheimer et al. 2009). Such calculations give slightly lower equilibrium temperatures for lake gas compared to those for conduit gas (e.g. Table 1), but this difference is within uncertainty for D-Compress results.
Recompression
Gas compositions representative of conduit and conduit + lake compositions based on cycles in total gas CA were used for recompression runs with D-Compress. We also used the differences between respective maximum and minimum points (Table 1), corresponding to lake compositions. Similar results are obtained when cycles are defined using total CA or equilibrium temperature.
We assume that the two end-members for composition changes during ascent are gas-only, controlled by pressure, and closed-system, which is influenced both by pressure and by volatile solubilities. In recompression plots (Fig. 9), the span of compositions between closed and gas-only ascent is thus the potential source region for observed surface gas compositions. A rising magma batch is more closely represented by a closed-system pathway, in which gas and melt in the batch re-equilibrate during ascent, than by a gas-only system. Gas rising through a porous conduit is a semi-open system likely to follow an intermediate path between closed and gas-only systems. If the gas percolates long enough to cause a conduit containing stagnant melt to fully re-equilibrate with it, it behaves as a gas-only system.

Recompression from D-Compress for compositions corresponding to ‘conduit + lake’, ‘conduit’, and ‘lake’. Closed-system (solid lines) and gas-only (dashed lines) runs shown, all starting from 40 % porosity at surface under 0.62 bars pressure with isothermal recompression calculated until 2000 bars. At 40 % starting porosity, closed-system runs generally end before 200 bars. See Table 1 for gas ratio inputs to D-Compress. CO2/OCS ratio is shown, to give the largest difference in starting compositions. Note shallow depths of overlap (<10 bars) between recompression pathways
Figure 9 shows an example of CO2/OCS plotted as a function of pressure (i.e. depth) during different recompression runs. The modelled ascent pathways are closely grouped, mostly due to the small differences in composition at the surface. If the conduit and lake gases are from the same source, and differentiate due to a change in the extent of gas-melt coupling, then the minimum depth by which this occurs is indicated by the divergence between their ascent pathways (Burgisser et al. 2012). Here, we observe overlap of the conduit and lake source regions, i.e. the area between closed and gas-only ascent, from just a few bars of pressure and downwards. This is within model error, so we cannot distinguish a minimum depth, showing that the end-member gas compositions could differentiate at very shallow depths (even within the lake).
Discussion
The periodogram for total gas CA (Fig. 4) shows, for most of the measurement duration, a cyclic change with a period of about 600 s. The consistent duration and persistence of the cycles, as well as the identification of comparable cycles in heat flux, lake motion (Peters et al. 2014), lake surface elevation (Jones et al. 2015), and SO2 flux (Sweeney et al. 2008; Boichu et al. 2010), indicate a source process affecting gas flux from the lava lake. We expect that due to steady plume rise on the day of measurement, the CAs retrieved from this FTIR dataset serendipitously represent a proxy for gas flux. The shapes of the cycles are also significant; they are symmetrical about their vertical axes but peaks are narrower than troughs. A sudden escape of gas through the lake (Patrick et al. 2011b) might cause a sharper rise in measured gas amount and asymmetry in the cycle shape about the vertical axis.
To show that CAs for all seven gas species follow the same cycle as the total CA (which is likely to be dominated by H2O), we refer to their coherence plots (Figs. 5 and 6). The phase arrows on these plots show that, for most gas pairs, cyclic changes in both gas CAs at the 10-min period occur nearly in phase, such that total gas amount changes cyclically. Pairs that are not directly in phase always have differences of less than 90° (one quarter of a cycle), so all gases have approximately the same cycles and phases as total CA, but not all gas CAs reflect the cycles to the same extent and the small phase differences are often variable. Gas ratios also change cyclically, and many periodograms generated from gas ratios (Figs. 6 and 7) exhibit 10-min periodicity, showing that some gases change more than others during the cycles.
CO–CO2
Cycles are present in CO and CO2 at multiple periods (Fig. 4), but most consistently at the 10-min period. The continuous bands at longer periods only represent two to three cycles. For most gas pairs, phase relationships between their CAs in the 10-min band, shown by the arrows on the cross-wavelet transform plots, change slightly over the measurement duration. The CO–CO2 pair maintains the steadiest phase relationship. This, together with the high coherence between CO and CO2 CA wavelet transforms (Fig. 5), is consistent with an established thermodynamic equilibrium in the lava lake, most likely due to the relationship:
Compared to other ratios, CO2/CO is less variable, ranging between about 13 and 15 (Fig. 3), though this is larger than the span of 13.3–13.5 reported by Oppenheimer et al. (2009).
However, there are high-power cycles in the CO2/CO periodogram, although periodograms for other ratios involving CO2 or CO do not show such clear periodicity. If the reaction equilibrium were stable throughout the total CA cycles, then, due to the high coherence between the two gases, we would expect to find no cycles in their ratio. Taking their ratio should eliminate common components such as a fixed ratio or cyclic processes that affect both gases equally. The fact that strong cycles persist in the ratio shows that cyclic changes affecting gas amounts over 10-min periods also affect relative proportions of the two gases.
The cause for the changing CO2/CO could be related to gas and heat input to the lake from the pulsatory magma supply proposed by Oppenheimer et al. (2009), although it may also be related to redox conditions. The peak of the total gas cycle generally corresponds to more oxidised conditions (higher CO2/CO). According to Burgisser et al. (2012), redox reactions occur rapidly in gas-buffered systems, accounting for CO2/CO ratio changing over a similar timescale to that of the total gas CA cycle. In ‘Equilibrium temperatures and redox conditions’, we consider whether the range of observed CO2/CO observed could also result from temperature variations.
SO2–OCS
Of the sulphur-bearing species, measurements are only available for SO2 and OCS. Recent studies have not detected H2S at Erebus (Moussallam et al. 2012), although small amounts have been reported previously (Sheppard et al. 1994). The SO2 CA shows well-defined high-power cycles (Fig. 4). Some cycles are apparent in the CA of OCS, but these are less clear than for other gases. Despite this, coherence plots of CO–OCS, CO2–OCS, and to a lesser extent SO2–OCS (Fig. 5), all show relatively large areas of high coherence distributed over most periods, with a low coherence band around 2048 s. Significant areas in coherence plots of the CAs for SO2 with CO and CO2 are smaller. Assuming a constant temperature, we expect equilibrium between these species in the magmatic gas to be established according to:
If this were dominating the signal, we could expect high coherence between all four gases across periods. However, coherence plots involving SO2 have smaller significant areas, while its CA is strongly periodic. We infer that SO2 degassing is driven by solubility and affected to a lesser extent by redox reactions. This, combined with tight coupling between CO and CO2, may explain the lower coherence of SO2 with other gases. The OCS CA, two orders of magnitude less than SO2 CA, is more affected by the redox equilibrium and therefore has higher coherence with the other gases. All four gases are generally in phase, with slight phase differences that may reflect the time taken for re-equilibration.
H2O
High power periodicities at 10 min are clear in H2O CAs (Fig. 4). As H2O is a relatively soluble species, there is likely to be magma input to shallow levels associated with the 10-min cycle. The observation that SO2 and H2O are both strongly periodic is evidence for cycles being dominated by magma influx and shallow degassing. H2O often leads SO2 slightly (Fig. 5), and this might reflect a delay between changes to shallow magma input and degassing (and thus total gas CAs) and the redox reactions between gas species.
Halogens
Coherence between HCl and HF (Fig. 5) is highest at the 10-min band, suggesting that the similarity in their degassing behaviour is promoted by this cycle. Coherence plots for HF with H2O and SO2 have strong periodicity at 10 min. The wavelet periodogram for HF CA has a higher power periodicity at 10 min than does that for HCl, but the periodogram of ratios involving HF with H2O (Fig. 7), CO, CO2, SO2, or OCS does not show this periodicity. Ratios involving HCl generally do have strong 10-min periodicity (e.g. H2O/HCl, Fig. 7).
The clear periodicity of HF is similar to that seen in the periodograms for H2O and SO2, which could reflect an increase towards the top of the cycle as a magma batch enters the lake. However, transient phase differences between species such as H2O and HF suggest that incoming magma batches may not be degassing as a fully closed system.
Equilibrium temperatures and redox conditions
Figure 8 shows that total gas CA (dominated by H2O) is out of phase with calculated equilibrium temperatures (affected by CO2, CO, SO2, and OCS). This contrasts with the relationship observed between lake surface temperatures measured by thermal infrared imagery at the top of the pulsatory cycle (Oppenheimer et al. 2009; Peters et al. 2014). However, surface temperatures will reflect rates of resurfacing of the lake and the area of incandescent fissures on the lake surface, which can be unrelated to gas equilibration temperatures controlled by deeper processes. We also cannot exclude the possibility that the gases are in disequilibrium during part, or all, of the cycle.
To determine whether changing lake temperatures would alone be sufficient to cause the variation in CO2/CO, we consider the temperatures required to generate the range of observed CO2/CO, assuming fixed oxygen fugacity (fO2) and equilibrium between these two species.
The equilibrium constant, K p, for Eq. 1 is given by:
where X Y is the molar fraction of gas Y, given by the CA of Y divided by the sum of the seven retrieved volcanic gases. It can also be expressed as a function of temperature, T (in K), calculated using standard thermochemical tables (Chase et al. 1986):
We can then fix fO2 at any value and calculate equilibrium temperatures for measured CO2/CO ratios. Taking as a reference a logfO2 of −11.9 (Kelly et al. 2008), Eqs. 3 and 4 give a temperature range of 1007–1064 °C. The range of equilibrium temperatures calculated with D-Compress is greater than that required to explain the range of CO2/CO ratios at fixed fO2. This suggests that both temperature and redox changes occur during the cycles.
Similarly, from Eq. 2, we can use the relationship:
where P is the pressure, with the equilibrium constant
to calculate equilibrium temperature at a given pressure. At an atmospheric pressure of 620 hPa, a temperature range of about 1083–1110 °C is sufficient to generate most (90 % of) values observed for X CO2 2·XOCS/XCO 3·XSO2. For the range of CO2/CO measured, these temperatures correspond to logfO2 of about −9.9 to −10.4, or approximately QFM−0.5 to QFM−0.8. This is a conservative estimate as, if separate lake and persistent conduit gases are present but not in equilibrium with one another, the lake gas equilibrium conditions have lower temperatures than those calculated for the top of the cycle when both compositions are mixed (Table 1). Given the phase differences between gases, one possibility is that changes to redox equilibria are detected ahead of the arrival of magma batches, through gas escape during their ascent.
Modes of degassing
We summarise the key observations as follows:
-
(i)
There is noticeable periodicity in the CO2/CO ratio that could be caused either by shifting fO2 and/or temperature within the lake or by a different gas composition introduced by increased shallow degassing at the peak of the cycles.
-
(ii)
CO and CO2 CAs are very coherent and in phase, but other species have slight, variable phase differences between them.
-
(iii)
The peak of the cycle affects shallow degassing species (H2O, SO2, and HF) most, as noted by Oppenheimer et al. (2009).
-
(iv)
The shape of the cycles is consistent with perturbation from a background level of degassing resulting in gradual increases and decreases in CAs of gases measured, matching observations by Peters et al. (2014) about the shape of cycles in thermal imagery of the lava lake.
Any model to explain these observations must account for continuous gas supply and magma convection to maintain heat output, without much loss of mass. The Oppenheimer et al. (2009) model explains both the persistence of Erebus lava lake through bidirectional flow (Kazahaya et al. 1994; Stevenson and Blake 1998; Huppert and Hallworth 2007) and the degassing cycles. Conduit gas rises through permeable magma in the conduit, while lake gas arrives coupled to the melt, in batches of magma entering the lake at ca. 10-min intervals. The lake composition is close to equilibrium with its melt. The bottom of the cycle is comprised of conduit gas, which re-equilibrates with the melt until approx. 150-m depth when permeability allows decoupling (Oppenheimer et al. 2011).
Our results show, however, that it is also possible for the chemical decoupling of conduit gas and melt to occur at shallower depths. If we accept a pulsatory flow model (Fig. 10), exsolved conduit gas could continue to re-equilibrate with the melt until near the lake, before gas-only ascent through fractures below the crater. The lake is sustained by magma upwelling, potentially from the shallow magma body whose presence has been inferred by seismological analysis (Zandomeneghi et al. 2013), located northwest of the lava lake at a depth of 650–700 m relative to its surface. This magma provides the more reduced lake gas, with relatively variable compositions, that mixes with the conduit gas of consistent composition. As in the Oppenheimer et al. (2009) model, the density contrast between degassed magma, which sinks down the same conduit, and ascending magma leads to bidirectional flow and pulsed magma ascent. Ascending magma batches are thus associated with peaks in the degassing cycles when conduit and lake gases mix.

Model of degassing based on Oppenheimer et al. (2009). Dashed arrows represent ‘conduit’ (white) and ‘lake’ (black) gases. Solid arrows indicate magma exchange flow and convection. a Minima of total gas CA cycles: background degassing sustained by conduit gas, exsolved from continuously ascending magma at depth or shallower open-system degassing, decoupling only at shallow depths. b Added degassing from incoming magma batches gives variable plume compositions that relate to mixing, shifting redox and temperature conditions, potentially causing peaks or troughs in some gas emissions before magma enters the lake. c Maxima of thermal radiance and total CA cycles: increased gas output with higher H2O, SO2, and halogen content due to shallower exsolution from the magma batches
Among alternative models for persistent lava lakes are those driven primarily by gas supply. Analogue experiments by Witham et al. (2006) reproduced cyclic recharge of a ‘lava lake’ owing to periodic suppression of gas ascent, instability, and sudden draining of the lake. Cycles in gas and thermal data at Kīlauea are attributed to gas pistoning (Patrick et al. 2011a, b; Spampinato et al. 2012) due to accumulation of a gas under a cooled lake surface. A pistoning mechanism at Erebus requires the minima of gas cycles to occur when degassing is suppressed, and the maxima during release. This allows gas types to differentiate at shallow depths but cannot fully explain the cycles. This type of gas pistoning and the Witham et al. (2006) model require rapid gas release and draining. Cycles in gas and thermal data (Peters et al. 2014) are not consistent with rapid gas release, nor do we observe the explosive activity (spattering) and draining that characterise pistoning at Kīlauea.
Bouche et al. (2010) presented a gas-driven model in which large bubbles with a gas-rich wake of magma supply both gas and thermal input to Erta Ale lava lake. At Erebus, it is clear that degassing plays a key role in lake convection (Molina et al. 2012). However, there are extended periods lacking large bubble events and, more significantly, we observe high power periodicities in H2O, SO2, and halogen amounts that must be due to shallow degassing. Sufficient magma must enter the lake or shallow conduit to produce this increase in relatively soluble volatiles. Since the system loses negligible volumes of magma through eruptions, it must drain through the conduit, so we favour a model that includes exchange flow.
Small phase differences between cycles in most gases suggest the possibility that degassing is not always in equilibrium for more slowly diffusing species, e.g. S or CO2, within the melt (Burgisser et al. 2012). Magma batches may begin to behave as open systems during ascent, such that exsolution of some species or changes to redox equilibria are detected ahead of the batch entering the lake.
We have focused here on the 10-min periodicity but other periodicities at longer durations are apparent, as are bands of low coherence around 30 min and short-lived perturbations at high frequencies. The higher CO2/CO ratios seen in explosions suggest a deeper, more oxidised gas source and lower equilibrium temperatures possibly linked to adiabatic cooling (Burgisser et al. 2012). Bubbles with a faster ascent rate could release CO2-rich gas sourced from greater depths, with larger bubbles leading to explosive eruptions. Any model for passive degassing may have implications for interpreting the explosive activity at Erebus. Studies of high-frequency events over short timescales and of gas compositions during and after explosions could provide more information about both the mechanism of explosions and the source of magma that refills the lake. We note that viscosity of Erebus phonolite (Le Losq et al. 2015) is greater than that of the basalt at Stromboli and of other lava lakes (Tazieff 1994), and this will affect the extent to which melt and gas are coupled during both passive and explosive degassing.
Conclusions
Based on wavelet analyses of spectroscopic measurements of gas emissions, we have identified two types of processes that generate the circa 10-min cycles in passive degassing at Erebus. The first is an increase in degassing shown by the change in a proxy for gas flux (gas column amounts), and affects all gases. The second process is the set of possible interactions between gas species present, through chemical redox equilibria and vapour phase partitioning, that determine relative changes in gas amounts. Strong periodicities in shallow degassing species such as H2O and SO2 are consistent with an episodic magma supply into the lake. Persistent cyclicity at the same period in CO2/CO ratio suggests that changing temperature and redox conditions are associated with this influx of magma.
We calculated thermodynamic equilibrium temperatures for the gases observed and found these to lead total gas column amounts by one eighth to half a cycle (out of phase), about 75–300 s. Total column amount increases due to shallow magma input, but gas compositions and equilibrium temperature are not tightly phase-locked. This could be a result of different rates of re-equilibration between gases and/or changes to surface gas composition ahead of the arrival of a magma batch, due to open-system degassing. Gases equilibrated under different conditions may mix in the plume so that the measured compositions are not in equilibrium.
Gas compositions representative of conduit and lake compositions were used for recompression modelling. We find that both compositions could, theoretically, be generated at shallow depths, including within the lake, i.e. tens of metres depth, regardless of degassing style. Cyclic changes in gas composition result from the mixing of these gases in variable proportions as magma approaches and enters the lake.
References
Alletti M, Burgisser A, Scaillet B, Oppenheimer C (2014) Chloride partitioning and solubility in hydrous phonolites from Erebus volcano: a contribution towards a multi-component degassing model. GeoRes J 3–4:27–45. doi:10.1016/j.grj.2014.09.003
Boichu M, Oppenheimer C, Tsanev VI, Kyle PR (2010) High temporal resolution SO2 flux measurements at Erebus volcano, Antarctica. J Volcanol Geotherm Res 190:325–336. doi:10.1016/j.jvolgeores.2009.11.020
Bouche E, Vergniolle S, Staudacher T, Nercessian A, Delmont J-C, Frogneux M, Cartault F, Le Pichon A (2010) The role of large bubbles detected from acoustic measurements on the dynamics of Erta’Ale lava lake (Ethiopia). Earth Planet Sci Lett 295:37–48. doi:10.1016/j.epsl.2010.03.020
Burgisser A, Scaillet B (2007) Redox evolution of a degassing magma rising to the surface. Nature 445:194–197. doi:10.1038/nature05509
Burgisser A, Oppenheimer C, Alletti M, Kyle PR, Scaillet B, Carroll MR (2012) Backward tracking of gas chemistry measurements at Erebus volcano. Geochem. Geophys. Geosystems 13. doi:10.1029/2012GC004243
Burgisser A, Alletti M, Scaillet B (2015) Simulating the behavior of volatiles belonging to the C-O-H-S system in silicate melts under magmatic conditions with the software D-Compress. Comput Geosci 79:1–14. doi:10.1016/j.cageo.2015.03.002
Burton MR (1999) Remote sensing of the atmosphere using Fourier transform spectroscopy (Ph.D). University of Cambridge, UK
Calkins J, Oppenheimer C, Kyle PR (2008) Ground-based thermal imaging of lava lakes at Erebus volcano, Antarctica. J Volcanol Geotherm Res 177:695–704. doi:10.1016/j.jvolgeores.2008.02.002
Chase MW, Davies CA, Downey JR, Frurip DJ, McDonald RA, Syverud AN (1986) NIST Standard Reference Database 13; NIST JANAF Thermochemical Tables 1985, Version 1.0. U.S. Department of Commerce
Gerlach TM, Nordlie BE (1975) The C-O-H-S gaseous system, part II: temperature, atomic composition, and molecular equilibria in volcanic gases. Am J Sci 275:377–394. doi:10.2475/ajs.275.4.377
Gerst A, Hort M, Aster R, Johnson JB, Kyle PR (2013) The first second of volcanic eruptions from the Erebus volcano lava lake, Antarctica—energies, pressures, seismology, and infrasound. J Geophys Res Solid Earth 118:3318–3340. doi:10.1002/jgrb.50234
Giggenbach WF (1987) Redox processes governing the chemistry of fumarolic gas discharges from White Island. Appl Geochem 2:143–161. doi:10.1016/0883-2927(87)90030-8
Grinsted A, Moore JC, Jevrejeva S (2004) Application of the cross wavelet transform and wavelet coherence to geophysical time series. Nonlinear Process Geophys 11:561–566. doi:10.5194/npg-11-561-2004
Huppert HE, Hallworth MA (2007) Bi-directional flows in constrained systems. J Fluid Mech 578:95–112. doi:10.1017/S0022112007004661
Jones LK, Kyle PR, Oppenheimer C, Frechette JD, Okal MH (2015) Terrestrial laser scanning observations of geomorphic changes and varying lava lake levels at Erebus volcano, Antarctica. J Volcanol Geotherm Res 295:43–54. doi:10.1016/j.jvolgeores.2015.02.011
Kazahaya K, Shinohara H, Saito G (1994) Excessive degassing of Izu-Oshima volcano: magma convection in a conduit. Bull Volcanol 56:207–216. doi:10.1007/BF00279605
Kelly PJ, Kyle PR, Dunbar NW, Sims KWW (2008) Geochemistry and mineralogy of the phonolite lava lake, Erebus volcano, Antarctica: 1972–2004 and comparison with older lavas. J Volcanol Geotherm Res 177:589–605. doi:10.1016/j.jvolgeores.2007.11.025
Le Losq C, Neuville DR, Moretti R, Kyle PR, Oppenheimer C (2015) Rheology of phonolitic magmas—the case of the Erebus lava lake. Earth Planet Sci Lett 411:53–61. doi:10.1016/j.epsl.2014.11.042
Molina CI (2012) Convection and degassing of a magmatic system: the case of the lava lake at Erebus, Antarctica (Ph.D). Université d’Orléans, France
Molina I, Burgisser A, Oppenheimer C (2012) Numerical simulations of convection in crystal-bearing magmas: a case study of the magmatic system at Erebus, Antarctica. J Geophys Res 117. doi:10.1029/2011JB008760
Moussallam Y, Oppenheimer C, Aiuppa A, Giudice G, Moussallam M (2012) Hydrogen emissions from Erebus volcano, Antarctica. Bull Volcanol 74:2109–2120. doi:10.1007/s00445-012-0649-2
Moussallam Y, Oppenheimer C, Scaillet B, Kyle PR (2013) Experimental phase-equilibrium constraints on the phonolite magmatic system of Erebus volcano, Antarctica. J Petrol 54:1285–1307. doi:10.1093/petrology/egt012
Oppenheimer C, Kyle PR (2008) Probing the magma plumbing of Erebus volcano, Antarctica, by open-path FTIR spectroscopy of gas emissions. J Volcanol Geotherm Res 177:743–754. doi:10.1016/j.jvolgeores.2007.08.022
Oppenheimer C, Lomakina AS, Kyle PR, Kingsbury NG, Boichu M (2009) Pulsatory magma supply to a phonolite lava lake. Earth Planet Sci Lett 284:392–398. doi:10.1016/j.epsl.2009.04.043
Oppenheimer C, Moretti R, Kyle PR, Eschenbacher A, Lowenstern JB, Hervig RL, Dunbar NW (2011) Mantle to surface degassing of alkalic magmas at Erebus volcano, Antarctica. Earth Planet Sci Lett 306:261–271. doi:10.1016/j.epsl.2011.04.005
Patrick MR, Orr TR, Wilson D, Dow D, Freeman R (2011a) Cyclic spattering, seismic tremor, and surface fluctuation within a perched lava channel, Kīlauea Volcano. Bull Volcanol 73:639–653. doi:10.1007/s00445-010-0431-2
Patrick MR, Wilson D, Fee D, Orr TR, Swanson D (2011b) Shallow degassing events as a trigger for very-long-period seismicity at Kilauea Volcano, Hawaii. Bull Volcanol 73:1179–1186. doi:10.1007/s00445-011-0475-y
Pering TD, Tamburello G, McGonigle AJS, Aiuppa A, Cannata A, Giudice G, Patanè D (2014) High time resolution fluctuations in volcanic carbon dioxide degassing from Mount Etna. J Volcanol Geotherm Res 270:115–121. doi:10.1016/j.jvolgeores.2013.11.014
Peters N, Oppenheimer C, Kyle PR, Kingsbury NG (2014) Decadal persistence of cycles in lava lake motion at Erebus volcano, Antarctica. Earth Planet Sci Lett 395:1–12. doi:10.1016/j.epsl.2014.03.032
Rothman LS, Gordon IE, Barbe A, Chris Benner D, Bernath PF, Birk M, Boudon V, Brown LR, Campargue A, Champion J-P, Chance K, Coudert LH, Dana V, Devi VM, Fally S, Flaud J-M, Gamache RR, Goldman A, Jacquemart D, Kleiner I, Lacome N, Lafferty WJ, Mandin J-Y, Massie ST, Mikhailenko SN, Miller CE, Moazzen-Ahmadi N, Naumenko OV, Nikitin AV, Orphal J, Perevalov VI, Perrin A, Predoi-Cross A, Rinsland CP, Rotger M, Simeckova M, Smith MAH, Sung K, Tashkun SA, Tennyson J, Toth RA, Vandaele AC, Auwera V (2009) The HITRAN 2008 molecular spectroscopic database. J Quant Spectrosc Radiat Transf 110:533–572. doi:10.1016/j.jqsrt.2009.02.013
Sheppard DS, Le Guern F, Christenson BW (1994) Compositions and mass fluxes of the Mount Erebus volcanic plume. In: Volcanological and environmental studies of Mount Erebus, Antarctica, Antarctic Research Series. AGU, pp 83–96. doi:10.1029/AR066p0083
Spampinato L, Oppenheimer C, Cannata A, Montalto P, Salerno GG, Calvari S (2012) On the time-scale of thermal cycles associated with open-vent degassing. Bull Volcanol 74:1281–1292. doi:10.1007/s00445-012-0592-2
Stevenson DS, Blake S (1998) Modelling the dynamics and thermodynamics of volcanic degassing. Bull Volcanol 60:307–317. doi:10.1007/s004450050234
Sweeney D, Kyle PR, Oppenheimer C (2008) Sulfur dioxide emissions and degassing behavior of Erebus volcano, Antarctica. J Volcanol Geotherm Res 177:725–733. doi:10.1016/j.jvolgeores.2008.01.024
Tamburello G, Aiuppa A, McGonigle AJ, Allard P, Cannata A, Giudice G, Kantzas EP, Pering TD (2013) Periodic volcanic degassing behaviour: the Mount Etna example. Geophys Res Lett 40:4818–4822. doi:10.1002/grl.50924
Tazieff H (1994) Permanent lava lakes: observed facts and induced mechanisms. J Volcanol Geotherm Res 63:3–11. doi:10.1016/0377-0273(94)90015-9
Torrence C, Compo GP (1998) A practical guide to wavelet analysis. Bull Am Meteorol Soc 79:61–78. doi:10.1175/1520-0477(1998)079%3C0061:APGTWA%3E2.0.CO;2
Torrence C, Webster PJ (1999) Interdecadal changes in the ENSO-monsoon system. J Clim 12:2679–2690. doi:10.1175/1520-0442(1999)012<2679:ICITEM>2.0.CO;2
Witham F, Llewellin EW (2006) Stability of lava lakes. J Volcanol Geotherm Res 158:321–332. doi:10.1016/j.jvolgeores.2006.07.004
Witham F, Woods A, Gladstone C (2006) An analogue experimental model of depth fluctuations in lava lakes. Bull Volcanol 69:51–56. doi:10.1007/s00445-006-0055-8
Zandomeneghi D, Aster R, Kyle PR, Barclay A, Chaput J, Knox H (2013) Internal structure of Erebus volcano, Antarctica imaged by high-resolution active-source seismic tomography and coda interferometry. J Geophys Res Solid Earth 118:1067–1078. doi:10.1002/jgrb.50073
Acknowledgments
We thank Aslak Grinsted for the MATLAB wavelet coherence package; Mike Burton and Georgina Sawyer for the FTIR retrieval code; Nial Peters for discussions; and the editor, Paul Wallace, and referees (Yuri Taran and anonymous) for incisive comments on the original manuscript. Data were collected with the assistance of the G-081 Erebus team and the US Antarctic Program, supported by the National Science Foundation under grants ANT0838817 and ANT1142083. TI received doctoral grants from the AXA Research Fund and the William Georgetti Trust. CO acknowledges the NERC Centre for the Observation and Modelling of Earthquakes, Volcanoes and Tectonics (http://comet.nerc.ac.uk/) for support.
Author information
Authors and Affiliations
Corresponding author
Additional information
Editorial responsibility: P. Wallace
Rights and permissions
Open Access This article is distributed under the terms of the Creative Commons Attribution 4.0 International License (http://creativecommons.org/licenses/by/4.0/), which permits unrestricted use, distribution, and reproduction in any medium, provided you give appropriate credit to the original author(s) and the source, provide a link to the Creative Commons license, and indicate if changes were made.
About this article

Cite this article
Ilanko, T., Oppenheimer, C., Burgisser, A. et al. Cyclic degassing of Erebus volcano, Antarctica. Bull Volcanol 77, 56 (2015). https://doi.org/10.1007/s00445-015-0941-z
Received:
Accepted:
Published:
DOI: https://doi.org/10.1007/s00445-015-0941-z