
Abstract
Nuclear medicine studies for the evaluation of liver, spleen, and biliary tract pathologies include a number of tests performed with various radiotracers. These imaging modalities are based on an assessment of the various histological components of the liver and spleen and their functional characteristics. Hepatobiliary scintigraphy (HBS) evaluates the function of the hepatocytes and the biliary system. Liver and spleen scintigraphy with [99mTc]-labelled colloid tracks active tracer phagocytosis by the reticuloendothelial system (RES) of the liver, spleen, and bone marrow. Approximately 80–90% of tracer is taken by the liver, 5–10% by the spleen, and the remainder by the bone marrow. The physiologic basis for spleen scintigraphy with heat damaged red blood cells (DRBCs) is the ability of this organ to trap and remove deformed and damaged RBCs from circulation. This method involves drawing blood, in vitro labelling RBCs with [99mTc], and inducing damage to their cell membrane with controlled heating. Following reinjection of DRBCs splenic tissue can be identified with high sensitivity and specificity. Unlike labelled colloid scans and HBS, liver and spleen scintigraphy with [99mTc]-labelled RBCs can be highly specific in the evaluation of vascularity and blood pool of focal liver lesions.
You have full access to this open access chapter, Download chapter PDF
Keywords
7.1 Hepatobiliary Scintigraphy
7.1.1 Clinical Indications [1, 2]
-
Differential diagnosis between biliary atresia and other causes of neonatal jaundice such as neonatal hepatitis.
-
Evaluation of cystic masses such as choledochal cysts.
-
Diagnosis of cholecystitis.
-
Evaluation of liver transplants.
-
Evaluation of bile leaks following surgery or trauma.
7.1.1.1 Pre-Exam Information
-
The need for fasting or pharmacologic interventions will be determined by the age of the patient and the specific clinical indication.
-
In cases of liver transplantation: anatomy of the graft (one lobe, whole liver), site and type and location of the anastomosis with the bowel, complications during surgery.
Study Protocol, Hepatobiliary Scintigraphy [3,4,5]
Patient Preparation:
Fast: 4–6 h when the study is performed to investigate gallbladder pathology.
-
Fasting is not required for the evaluation of biliary atresia, liver transplant, and biliary leaks.
-
Premedication (in infants with suspected biliary atresia):
-
Preferred: ursodeoxycholic acid (UDCA), administered orally (PO) 20 mg/Kg every 12 h for 2–3 days prior to the study.
-
Alternative: Phenobarbital 5 mg/kg/day, administered orally in two equal doses for 5 days prior to the study.
-
Radiopharmaceutical, Administered Activity, Mode of Delivery
Radiopharmaceutical:
-
[99mTc]labelled iminodiacetic acid (IDA) derivates.
-
Preferred: [99mTc]mebrofenin (preferred, when available) and 99mTc-disofenin.
Activity:
-
1.85 MBq/Kg (0.05 mCi/Kg), minimum dose 20 MBq (0.54 mCi).
-
Refer to the EANM pediatric dosage card and to the North American consensus guidelines on radiopharmaceutical administration in children in the respective EANM and SNMMI and image gently web sites.
-
Reference to national regulation guidelines, if available, should be considered.
-
Acquisition Protocol:
-
Collimator: low-energy high-resolution parallel hole.
-
Field-of-view (FOV): entire abdomen, anterior view.
Acquisition protocol depends on the study indication; can be customized according to interim findings.
-
In general, it starts with a dynamic acquisition of 30–60 seconds/frame for a total of 60 mins, matrix 128 × 128.
-
Serial static images at 1 and 4 h (for an acquisition duration of 3–5 min) follow after the completion of the dynamic study, and if needed at 24 h (for a duration of 15 min), matrix 256 × 256.
-
Size-appropriate zoom.
-
SPECT/CT (when available) will improve the diagnostic accuracy.
Suspected biliary atresia:
-
The study can be discontinued at earlier time points if there is clear evidence of tracer accumulation in the bowel.
Suspected acalculous cholecystitis—includes a pharmacological intervention to stimulate gallbladder contraction:
-
When there is clear tracer accumulation in the gallbladder at 60 mins post-injection imaging, a cholecystokinin (CCK) analogue such as Sincalide (Kinevac, Sincalide, Bracco Diagnostics, Princeton, NJ) is administered IV.
-
Dose: 0.02 microgram/Kg diluted with saline to 30 ml.
-
Delivery: infusion pump at a rate of 1 ml/min for 30 mins.
-
-
If CCK is unavailable it can be substituted by a standardized fatty meal or by high-fat containing dairy products (milkshake, half-and-half, whipped cream).
-
A second sequence of dynamic images is obtained for 30 mins.
Study Processing:
-
Quantitative analysis of tracer uptake and excretion is not routinely performed in clinical practice.
-
Gallbladder ejection fraction (EF) can be obtained by drawing a region-of-interest (ROI) over the gallbladder, recording pre- and 30-min post-stimulation counts.
-
The EF is calculated as the difference between the pre- and post-stimulation counts divided by the pre-stimulation counts. An EF below 35% is considered abnormal.
7.1.2 Study Interpretation
Suspicion of Biliary Atresia [2, 6, 7]
-
Initial hepatic uptake and timing of the first bowel loops appearance should be recorded.
-
Increased tracer activity in the background and alternative excretion by the kidneys should be noted.
-
The diagnosis is ruled out when a tracer is identified in bowel loops at any time point during the study.
-
Tracer retention in the liver and lack of excretion up to 24 h post-injection may suggest biliary atresia but is not specific.
-
Differential diagnosis:
-
Severe neonatal hepatitis.
-
Other entities: bile plug syndrome in patients with cystic fibrosis, Alagille syndrome, dehydration, sepsis, and occasionally total parenteral nutrition may produce similar scintigraphic findings.
-
Acalculous Cholecystitis:
-
Scintigraphy will typically show a prominent gallbladder with little or no emptying following stimulation by pharmacologic intervention or a fatty meal.
-
The gallbladder EF is typically less than 35%.
Choledochal Cysts:
-
Scintigraphy will show drainage from the liver and gradual tracer accumulation in the region of the porta hepatis.
-
Bowel activity can be seen when the cyst is not obstructive.
-
Occasionally, early hepatic images will show a photopenic area corresponding to the cyst that gradually fills up as the rest of the liver drains.
-
SPECT/CT may be helpful in selected cases to clarify the scintigraphic findings.
Liver Transplant:[8,9,10]
-
Tracer distribution in the liver parenchyma during the early phases of the study is important.
-
Areas with decreased uptake may suggest ischemia or necrosis.
-
Tracer transit into the bowel is important to rule out obstructions. Transient tracer accumulation at the site of the anastomosis with the bowel is a common feature.
-
Bile leaks should be suspected when there is tracer activity in fluids collected from surgical drains.
-
Contained bile leaks may be seen as ectopic sites of tracer accumulation usually close to the liver margins.
-
Free bile leaks typically manifest as ectopic tracer localization in the gutters or pelvic floor.
-
7.1.3 Correlative Imaging [11,12,13]
-
US and cross-sectional imaging may show the presence of a cystic mass suspected to represent a choledochal cyst or non-visualization of the gallbladder that may be associated with biliary atresia.
-
Choledochal cysts are usually first identified with US or CT, but these modalities cannot ascertain the nature of the cyst. Magnetic resonance cholangiopancreatography (MRCP) is also being used more frequently to evaluate the biliary tree.
7.1.3.1 Red Flags [9]
-
In cases of suspected biliary atresia, it is essential to verify that pre-scan medication was taken as required. Repeat scintigraphy can be considered when the first study did not clearly demonstrate tracer localization in the bowel, prior to more invasive diagnostic measures.
-
Phenobarbital blood levels prior to HBS should be within the therapeutic range. It is recommended to check drug levels prior to performing the scan. If they are still low, treatment should be continued and the test postponed.
-
When no gastrointestinal (GI) excretion is visualized up to 24-h imaging, biliary atresia cannot be ruled out and must be confirmed by biopsy and other clinical tests. The report should also not conclude that the scan is consistent with biliary atresia.
-
Alternative tracer excretion through the kidneys is commonly seen in infants with neonatal jaundice. Distinction between renal and bowel activity may be difficult in the late, count poor images. Posterior view images may be helpful as well as SPECT or SPECT/CT.
-
Distinction between normal uptake in the gallbladder vs. activity in a choledochal cyst can be difficult. Administration of a fatty meal can be helpful. A normal gallbladder will empty following a fatty meal stimulation unlike a choledochal cyst.
-
The location of anastomosis between bile ducts and bowel is essential for the interpretation of liver transplant studies. Tracers tend to transiently accumulate at the site of the surgical anastomosis and could erroneously be interpreted as indicating a contained bile leak. Later images should show tracer clearance from the anastomotic site.
7.1.4 Take Home Messages
-
IDA derivates differ in their extraction rate from the blood and the rate of clearance from the liver parenchyma into the bowel.
-
Phenobarbital increases bile flow and improves the specificity of the study by ruling out biliary atresia.
-
SPECT/CT can improve the diagnostic accuracy:
-
Allows direct correlation between sites of tracer accumulation and anatomic findings such as fluid collections and abdominal cysts.
-
Enhances the study sensitivity for detection of small amounts of tracer in bowel loops.
-
-
HBS has a high negative predictive value for biliary atresia and thus its value is in excluding biliary atresia.
-
The definite diagnosis of biliary atresia requires percutaneous or intraoperative transhepatic cholangiography and liver biopsy. Biliary atresia requires a Kasai hepato-porto-enterostomy surgery, an initial measure to enable bile drainage from the liver. Liver transplantation is usually performed later.
-
In neonatal hepatitis, the hepatocellular damage impairs tracer uptake by the liver and results in increased background activity. This characteristic is usually not seen in biliary atresia when the diagnosis is made early prior to hepatocellular damage.
-
Congenital cystic dilatations of the extrahepatic bile ducts may cause biliary obstruction. The most common type is the cystic dilatation of the common bile duct. Abdominal pain and occasionally jaundice are common clinical signs. Scintigraphy is required to prove the biliary origin of the cyst which accumulates the tracer.
-
Bile leaks following liver transplantation, other abdominal surgery, or trauma can be identified and distinguished from other fluid collections.
7.1.5 Representative Case Examples
Case 7.1. Biliary Atresia (Fig. 7.1)

History: A 6-week-old infant with prolonged direct hyperbilirubinemia. Biliary atresia was suspected. A hepatobiliary scan with Tc-Disofenin was performed. Study report: Dynamic images (a) obtained for 60 mins and static images obtained at 4 h (b) and 24 h after tracer administration (c) show tracer retention in the liver. There is no activity seen in the bowel. The 24-h images show faint tracer activity in the kidneys. The liver uptake is homogenous and there is no significant background activity. Impression: These findings suggest that biliary atresia cannot be ruled out. The diagnosis was further confirmed by intraoperative transhepatic cholangiography
Case 7.2. Choledochal Cyst (Fig. 7.2)

History: An 11-month-old girl presented with a large cyst in the region of the common bile duct as shown by US (a) and MRI (b, c) suspected to be a choledochal cyst. Scintigraphy was performed to assess the relationship of the cyst to the hepatobiliary system, which could not otherwise be established. Study report: Early dynamic scintigraphy (d) shows normal liver uptake and excretion, with gradual tracer accumulation just below the inferior liver margin, most likely in the known cyst. Tracer activity was clearly noted in bowel loops with no evidence of obstruction. Late, 4- (e) and 24-h (f) images demonstrate continuing tracer pooling in the cyst (arrows). Impression: The findings are consistent with a choledochal cyst, part of the biliary system
Case 7.3. Acalculous Cholecystitis (Fig. 7.3)

History: A 16-year-old boy experienced repeated episodes of upper abdominal colicky pain during and after meals. Cholecystitis was suspected. The US did not show stones in the gallbladder or bile ducts. Study report: Dynamic images acquired for 60 mins following tracer injection (a) show normal uptake in and excretion from the liver. There is tracer accumulation in the gallbladder. A fatty meal was given to stimulate gallbladder emptying, followed by only slight emptying on dynamic images acquired for additional 30 mins after ingestion of the meal (b). Gallbladder EF, calculated from static images obtained before and 30 mins after the fatty meal challenge (c) was 22% (normal values >35%). Impression: The findings suggest acalculous cholecystitis with abnormal gallbladder contraction
Case 7.4. Suspected Biliary Leak after Liver Transplant (Fig. 7.4)

History: An 11-year-old girl underwent liver transplantation 3 weeks prior to the current examination. During her postoperative course, she developed septicemia and ascites and a bile leak was clinically suspected. Study report: Dynamic images acquired for 60 mins after tracer injection (a) show homogenous uptake in the transplanted liver with some accumulation at the site of the anastomosis, just below the inferior margin of the liver. There is prominent tracer activity in the tubing of the surgical drain positioned at the site of the anastomosis. No tracer transit into the bowel is noted. Static images at 1 h after tracer injection (b) show more tracer accumulation at the site of the anastomosis and a small amount in the bowel loops. At 4 h after tracer injection, anterior and posterior static images and a SPECT volume rendered image (MIP) (c) show cholestasis and tracer activity in the bowel loops. Impression: No evidence of bile leak
7.2 Liver and Spleen Reticuloendothelial System Scintigraphy
7.2.1 Clinical Indications [14]
At present, this study is performed quite rarely for relatively uncommon indications:
-
Rarely, to assess liver and spleen involvement in metabolic diseases (e.g., Gaucher’s disease and glycogen storage diseases).
-
Evaluation of suspected portal hypertension.
-
Evaluation of extramedullary hematopoiesis.
-
Evaluation of splenic or hepatic trauma, in selective cases in conjunction with correlative imaging.
-
Evaluation of the immunologic function of the spleen (functional hyposplenism).
-
Presence of accessory spleens prior to or after elective splenectomy for hematologic disorders (when splenic scintigraphy with denatured RBCs cannot be performed).
-
Evaluation of poly−/asplenia in cases of heterotaxy syndrome (when splenic scintigraphy with denatured RBCs cannot be performed).
Study Protocol for Liver-Spleen Scintigraphy [15]
Patient Preparation:
-
No specific preparation is required.
-
Check for results of correlative radiologic studies, especially in cases of heterotaxy syndrome.
Radiopharmaceutical, Administered Activity, Mode of Delivery
Radiopharmaceutical:
-
[99mTc]sulfur colloid (SC).
Activity:
-
1.85 MBq/Kg (0.05 mCi/Kg), minimum dose 15 MBq (0.4 mCi).
Refer to the EANM pediatric dosage card and to the North American consensus guidelines on radiopharmaceutical administration in children in the respective EANM and SNMMI and image gently web sites.
Reference to national regulation guidelines, if available, should be considered.
Acquisition Protocol:
-
Imaging can start a few minutes after tracer injection.
-
Collimator: low-energy high-resolution parallel hole.
-
Position: supine.
-
Static images, in the anterior, posterior, RAO, LAO, and optionally right and left laterals, 2–5 min/view, matrix 256 × 256, and size-appropriate zoom.
-
SPECT: 120 projections, 15 seconds/frame.
-
SPECT/CT: when available can be helpful for specific indications.
7.2.2 Study Interpretation (Fig. 7.5)
-
Normal pattern: the intensity of tracer uptake in the spleen is similar or slightly reduced compared to the liver on posterior view images.
-
Size of liver and spleen: measured as maximal vertical length of the liver or vertical length of the liver at the midclavicular line (on the anterior view) and the maximal length of the spleen (on the posterior view).
-
Location: abnormal ectopic foci of activity are seen in accessory spleen, polysplenia, or splenosis.
-
Focal liver defects can be caused by numerous etiologies such as primary tumors, metastases, abscesses, hematoma, cirrhosis, cysts, and storage disease.
-
Increased focal liver uptake is seen in focal nodular hyperplasia, regenerating nodules, and Budd-Chiari syndrome (focal increased activity in the caudate lobe).
-
Focal or diffuse reduced liver uptake and increased uptake in spleen and bone marrow are found conditions causing extensive hepatocellular damage.
-
Focal areas of reduced or even absent uptake of variable sizes in liver or spleen are due to trauma.
-
Reduced tracer localization in a normal-appearing spleen in US suggests functional hyposplenism.
Case(s) 7.5 Patterns of liver and spleen SC uptake (Fig 7.5)
Fig. 7.5 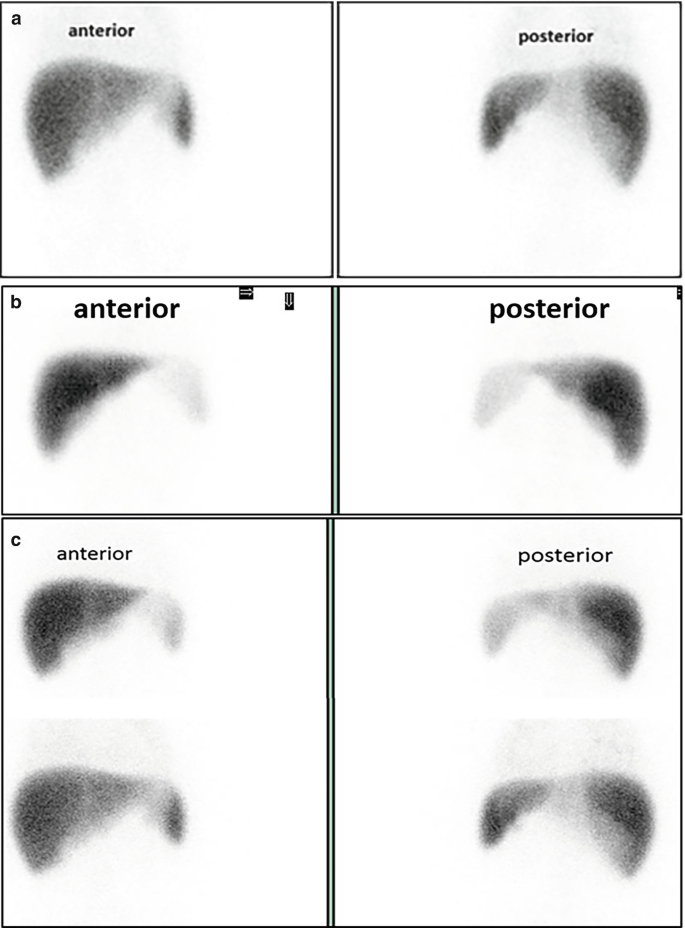
Patterns of liver and spleen SC uptake. (a) Normal tracer uptake in liver and spleen in a 7-year-old girl with no evidence of immune deficiency. (b) Reduced uptake in an anatomically normal spleen in a 4-month-old infant evaluated for functional hyposplenism following pneumococcal meningitis and pneumonia. (c) Transiently reduced uptake in the spleen in a 5-year-old girl following two episodes of pneumococcal meningitis who was suspected of functional hyposplenism. Reduced SC activity in the spleen supports the clinical suspicion (top row). The patient was treated with antibiotic prophylaxis. A repeat study 30 months later (bottom row) shows normalization of the tracer uptake by the spleen. Prophylaxis was discontinued

7.2.3 Correlative Imaging
-
US and cross-sectional imaging with CT and/or MRI may show a solid mass in the liver or spleen.
-
Contrast-enhanced US may be useful to characterize these solid lesions.
-
MRI with specific biliary contrast agents may also help characterize lesions in the liver and biliary system.
-
Correlation with US may show a normal appearing spleen in spite of low or absent radiotracer uptake.
7.2.3.1 Red Flags
-
Scintigraphic findings suggesting space occupying lesions (SOL) are not specific. If clinically indicated, tissue sampling is advised following additional cross-sectional imaging.
-
Improper SC labelling with subsequent appearance of dissociated free Pertechnetate in the circulation may result in the latter’s focal accumulation in the renal collecting systems that may be erroneously interpreted as accessory spleens.
-
Occasionally there is a significant superposition of the left liver lobe and the spleen. Planar images may suggest asplenia and a transverse-lying liver. SPECT or SPECT/CT is essential to determine if there is, in fact, a superimposed functioning spleen.
7.2.4 Take Home Messages
-
Size of the liver and spleen are age related.
-
Transient enlargement of the liver and spleen is common in many pediatric diseases.
-
Functional hyposplenism indicates inadequate phagocytosis of the tracer by RES macrophages in the spleen. Similar to asplenia, functional hyposplenism carries an increased risk of overwhelming, often fatal, sepsis by certain bacteria and requires prophylactic antibiotic therapy and immunizations.
7.2.5 Representative Case Examples
Case 7.6. Asplenia (Fig. 7.6)

History: A 4-month-old infant with heterotaxy syndrome that included ventricular and atrial septal defects and a right-sided stomach was evaluated for possible asplenia or polysplenia. Study report: Selected planar images (a) show a transverse lying liver and no splenic uptake, confirmed on selected SPECT slices (b). Impression: No evidence of functioning spleen tissue
Case 7.7. Splenic Infarct (Fig. 7.7)

History: This 12-year-old boy with previous biliary atresia and a functioning Kasai developed portal hypertension. He complained of recurrent sharp pain in the region of his enlarged spleen. There were concerns regarding a possible splenic infarct. Study report: The SPECT/CT study (selected SPECT and fused coronal, sagittal and transaxial slices, left, and MIP, right) shows a wedge-shaped defect in the lower pole of the spleen. Impression: The findings are consistent with a splenic infarct in the lower pole of the spleen
7.3 Spleen Scintigraphy with Denatured (Heat Damaged) Red Blood Cells
7.3.1 Clinical Indications [16]
-
Failure of splenectomy to relieve thrombocytopenia in idiopathic thrombocytopenic purpura (ITP) or anemia (in spherocytosis) in order to determine the presence of accessory spleen/s that was/were not resected.
-
Heterotaxy syndromes, to determine the presence of polysplenia or asplenia.
-
Identification of splenosis following splenectomy or abdominal trauma.
-
Evaluation of abdominal or thoracic nodules suspected as ectopic, accessory, or wandering spleens.
-
Evaluation of splenic torsion.
Study Protocol for DRBC Spleen Scintigraphy [17, 18]
Patient Preparation:
-
No specific patient preparation is required.
-
Check for results of correlative radiologic studies.
Radiopharmaceutical, Administered Activity, Mode of Delivery
Radiopharmaceutical—Preparation:
-
[99mTc]heat damaged red blood cells (DRBC).
-
1–3 ml of blood is drawn into a syringe containing heparin or acid citrate dextrose (ACD) solution for anticoagulation.
-
[99mTc] in vitro labelling of RBCs is performed.
-
Labelled RBCs are denatured by incubating the tube with the blood in a warm water bath with a constant temperature of 49.5 °C for 15 mins.
-
Allow the tube with the labelled blood to cool prior to reinjection.
-
Activity:
-
20–40 MBq (0.5–1 mCi).
Refer to the EANM pediatric dosage card and to the North American consensus guidelines on radiopharmaceutical administration in children in the respective EANM and SNMMI and image gently web sites.
Reference to national regulation guidelines, if available, should be considered.
Delivery:
-
Slow IV reinjection.
Acquisition Protocol:
-
Imaging starts 15 mins after tracer injection.
-
Collimator: low-energy, high- or ultrahigh-resolution parallel hole.
-
FOV: entire abdomen. The thorax should be included in suspected intrathoracic ectopic splenic tissue.
-
Static anterior, posterior, 4 obliques, and 2 lateral images are acquired; 2–5 min/view, matrix 256 × 256, size-appropriate zoom.
-
SPECT (or SPECT/CT if available) should follow planar scintigraphy and provides important information in particular in cases with suspected polysplenia, splenosis, and ectopic splenic tissue.
7.3.2 Study Interpretation
-
Sites of increased tracer localization represent DRBCs trapped in splenic tissue.
-
The intensity of uptake is significantly higher than the background and surrounding organs.
-
The location, size, and number of these foci should be reported, as well as their relationship to the liver.
-
DRBCs scintigraphy determines the presence of multiple spleens (polysplenia) or the absence of the spleen (asplenia).
-
Splenosis: scattered splenic nodules (mostly in the abdomen) that appear as multiple hot spots.
-
Accessory spleens: found in approximately 10–15% of autopsies in children.
-
Ectopic spleen: found in a location different from the known anatomic site in the left upper abdomen can be easily identified with DRBC scans.
-
Splenic torsion: the spleen is not visualized.
7.3.3 Correlative Imaging
-
US and cross-sectional imaging with CT and or MRI may confirm the presence, position, and appearance of splenic tissue.
7.3.3.1 Red Flags
-
DRBC scintigraphy is the investigation of choice when looking at anatomical localization of splenic tissue. However, it does not provide information on the function of the splenic tissue and is more cumbersome when compared to colloid scintigraphy.
-
Reinjection of DRBCs should be done after proper identification of the patient and according to local regulations for blood administration.
-
Scheduling no more than one RBC scan per session is a good practice to reduce the chance of labelled blood misadministration.
7.3.4 Take Home Messages
-
The so-called wandering spleen occurs rarely, when there is abnormal mobility of the spleen that is inadequately fixed to its surroundings and can be located in a different position within the abdomen. The wandering spleen carries a risk of torsion because of the consequent occlusion of the splenic vessels.
-
Splenosis is an acquired condition of splenic tissue auto-transplantation in different body compartments following trauma involving the spleen and should be distinguished from accessory spleens.
-
Accessory spleens are a congenital condition of additional up to six spleens that receive their blood supply from branches of the splenic artery and are located in specific abdominal regions.
-
A small ectopic spleen or multiple small spleens that are identified on DRBC scintigraphy may lack the immunological function of a normal spleen.
-
SPECT/CT correlation of sites of splenic tissue with anatomic findings (e.g., nodules) is of particular value in cases with complex anatomy such as in heterotaxy syndromes.
-
Intraoperative gamma-probe localization of accessory splenic tissue might be suggested.
7.3.5 Representative Case Examples
Case 7.8. Polysplenia (Fig. 7.8)

History: A newborn baby with heterotaxy syndrome and cardiac malformations that included patent ductus arteriosus, patent foramen ovale, and interrupted inferior vena cava was evaluated. Study report: Anterior and posterior planar images (a) and volume-rendered SPECT projections (b) show accumulation of DRBCs in three small adjacent spleens, ectopically located in the right upper abdomen (arrows). Impression: The findings are consistent with polysplenia associated with left heterotaxy isomerism
Case 7.9. Residual splenic tissue (Fig. 7.9)

History: An 18-year-old girl with ITP underwent elective splenectomy because of life-threatening thrombocytopenia. The thrombocytopenia persisted despite the surgical removal of the spleen. Explorative laparotomy did not reveal any residual or ectopic splenic tissue. Study report: Planar views of the abdomen and lower chest (a) show a number of foci of DRBC uptake in the posterior upper abdomen, adjacent to the left posterior lower ribs (arrows). SPECT/CT (b) was performed to better localize the sites prior to re-exploration and showed intense uptake in one of the splenic nodules adjacent to the upper left posterior abdominal wall. Impression: Evidence for residual splenic tissue that was either not removed at previous surgery or represents splenosis due to auto-implantation of splenic tissue that occurred during operation
7.4 Liver Blood Pool Scintigraphy
7.4.1 Clinical Indications [19]
-
Detection and evaluation of hemangiomas.
Study Protocol for RBC Scintigraphy [20]
Radiopharmaceutical, Administered Activity, Mode of Delivery
Radiopharmaceutical:
-
[99mTc]RBCs [21].
-
In vitro labelling is the method of choice and should be employed when an adequate facility and proper radiopharmacy practices are available 1–3 ml of the patient’s blood is drawn anticoagulated with heparin or acid citrate dextrose (ACD).
-
RBCs are labelled with a commercially available preparation according to the manufacturer’s instructions.
-
Activity:
-
Minimum dose 74 MBq (2 mCi), maximum dose 740 MBq (20 mCi).
Refer to the EANM pediatric dosage card and to the North American consensus guidelines on radiopharmaceutical administration in children in the respective EANM and SNMMI and image gently web sites.
Reference to national regulation guidelines, if available, should be considered.
Acquisition Protocol [ 18 , 22 ]:
-
Imaging is performed in the supine position.
-
Collimator: low energy, high- or ultrahigh-resolution parallel hole.
Acquisition Parameters:
-
Dynamic study: 1 second/frame x 60, matrix 128 x 128, size-appropriate zoom.
-
Early blood pool static images follow the dynamic study. Multiple projections, anterior, posterior, RAO, LAO, and lateral views optional, 3–5 mins per view, matrix 256 x 256.
-
Late static blood pool images 2 h after tracer injection in same projections, with same parameters.
-
SPECT (or SPECT/CT when available) of the liver follows the late static images with 120 projections, 25 seconds/step, matrix 128 x 128, and appropriate zoom.
-
Late whole-body images to assess for additional hemangiomas.
7.4.2 Study Interpretation
-
Foci of increased tracer accumulation on the late blood pool planar or SPECT images are likely to represent hemangiomas.
-
Large hemangiomas in the liver may appear photopenic on early blood pool images due to slow blood flow.
-
SPECT/CT or software fusion of SPECT with CeCT is recommended to ascertain correspondence between anatomical and radionuclide findings.
7.4.3 Correlative Imaging
-
Small hemangiomas are better evaluated with contrast CT or MRI.
-
Contrast-enhanced US may be useful to characterize these solid lesions.
-
MRI may also help to characterize these lesions.
7.4.3.1 Red Flags
-
Injection of in vitro labelled RBCs requires extreme caution to ensure that the blood is injected into the patient from whom it was drawn. To reduce the chance of misadministration it is advised to avoid booking more than one in vitro labelled RBC study per session.
-
Inadequate RBC labelling may result in dissociated Pertechnetate with visualization of the thyroid gland and stomach.
-
The ability to detect hemangiomas depends on their size and location. Lesions smaller than 1.5 cm in diameter may not be evident, especially when situated in regions with high blood pool activity.
7.4.4 Take Home Messages
-
The study is specific for lesions with high blood pool and is useful in distinguishing them from other space occupying lesions.
-
RBCs cannot distinguish between subtypes of hemangiomas or between hemangiomas and hemangiosarcomas.
-
SPECT or SPECT/CT can improve the accuracy of the study and diagnostic confidence in the evaluation of lesions suspected of hemangiomas.
-
Hemangiomas can be multifocal, especially in infants. It is advised to perform a whole-body late blood pool scan to screen for additional hemangiomas throughout the body.
7.4.5 Representative Case Examples
Case 7.10. Liver Hemangioma (Fig. 7.10)

History: A newborn in whom prenatal US detected a large mass in the left lobe of the liver confirmed on postnatal US was referred for RBCs scan since a hepatic hemangioma was included in the differential diagnosis. Study report: Late anterior and posterior planar images (a) show high physiologic activity in the splenic blood pool. A previously performed contrast-enhanced (ce) CT (b, left image) shows an enhancing mass (arrow) in the left hepatic lobe displacing the spleen posteriorly. SPECT (b, middle image) and co-registered SPECT-ceCT (b, right image) show high blood pool with a central photopenic region in the mass (arrow). Uptake in the posterior portion of the mass is contiguous with the physiologic blood pool activity of the spleen. Impression: The findings are consistent with a large liver hemangioma. Note that planar images could not identify the hemangioma because of the superposition of blood pool activities in the liver lesion and the spleen, which could be interpreted as normal spleen activity only
References
Kianifar HR, et al. Accuracy of hepatobiliary scintigraphy for differentiation of neonatal hepatitis from biliary atresia: systematic review and meta-analysis of the literature. Pediatr Radiol. 2013;43(8):905–19.
Tulchinsky M, et al. SNM practice guideline for hepatobiliary scintigraphy 4.0. J Nucl Med Technol. 2010;38(4):210–8.
Nadel HR. Hepatobiliary scintigraphy in children. Semin Nucl Med. 1996;26(1):25–42.
Roca I, Ciofetta G. Hepatobiliary scintigraphy in current pediatric practice. Q J Nucl Med. 1998;42(2):113–8.
Andersen TB, Aleksyniene R, Petersen LJ. Accuracy of hepatobiliary scintigraphy and added value of SPECT/CT versus planar imaging for diagnosing biliary atresia. Hell J Nucl Med. 2021;24(2):108–13.
Ziessman HA. Hepatobiliary scintigraphy in 2014. J Nucl Med. 2014;55(6):967–75.
Barseghyan K, et al. Utility of hepatobiliary scintigraphy in diagnosing or excluding biliary atresia in premature neonates and full-term infants with conjugated hyperbilirubinemia who received parenteral nutrition. J Matern Fetal Neonatal Med. 2018;31(24):3249–54.
Shammas A, Vali R, Charron M. Pediatric nuclear medicine in acute care. Semin Nucl Med. 2013;43(2):139–56.
Low CS, Ahmed H, Notghi A. Pitfalls and limitations of radionuclide hepatobiliary and gastrointestinal system imaging. Semin Nucl Med. 2015;45(6):513–29.
Gutierrez-Villamil C, et al. Hepatobiliary scintigraphy to evaluate biliary complications of Pediatric liver transplantation: an account of an experience. Eur J Pediatr Surg. 2022;32(3):258–62.
Miller TT, et al. Choledochal cyst. Preoperative sonographic and scintigraphic assessment. Clin Nucl Med. 1993;18(11):1001–2.
Napolitano M, et al. Practical approach to imaging diagnosis of biliary atresia, part 1: prenatal ultrasound and magnetic resonance imaging, and postnatal ultrasound. Pediatr Radiol. 2021;51(2):314–31.
Napolitano M, et al. Practical approach for the diagnosis of biliary atresia on imaging, part 2: magnetic resonance cholecystopancreatography, hepatobiliary scintigraphy, percutaneous cholecysto-cholangiography, endoscopic retrograde cholangiopancreatography, percutaneous liver biopsy, risk scores and decisional flowchart. Pediatr Radiol. 2021;51(8):1545–54.
Treves ST, Jones AG. Liver and spleen. In: Treves ST, editor. Pediatric nuclear medicine and molecular imaging. New York: Springer; 2014. p. 235–63.
Matesan MM, et al. Assessment of functional liver reserve: old and new in 99mTc-sulfur colloid scintigraphy. Nucl Med Commun. 2017;38(7):577–86.
Scheuerman O, et al. Functional hyposplenism is an important and underdiagnosed immunodeficiency condition in children. Acta Paediatr. 2014;103(9):e399–403.
Armas RR. Clinical studies with spleen-specific radiolabeled agents. Semin Nucl Med. 1985;15(3):260–75.
Schillaci O, et al. Single-photon emission computed tomography/computed tomography in abdominal diseases. Semin Nucl Med. 2007;37(1):48–61.
Arcay A, et al. Hepatoblastoma mimicking Hemangioma in Labeled red blood cell scintigraphy. Clin Nucl Med. 2019;44(3):229–31.
Middleton ML. Scintigraphic evaluation of hepatic mass lesions: emphasis on hemangioma detection. Semin Nucl Med. 1996;26(1):4–15.
Radiolabelled Autologous Cells. Methods and standardization for clinical use. Vienna: Int Atomic Energy Agency; 2015.
Roy SG, et al. Importance of SPECT/CT in detecting multiple hemangiomas on 99mTc-labeled RBC blood pool scintigraphy. Clin Nucl Med. 2015;40(4):345–6.
Author information
Authors and Affiliations
Editor information
Editors and Affiliations
Rights and permissions
The opinions expressed in this chapter are those of the author(s) and do not necessarily reflect the views of the IAEA: International Atomic Energy Agency, its Board of Directors, or the countries they represent
Open Access This chapter is licensed under the terms of the Creative Commons Attribution 3.0 IGO license (http://creativecommons.org/licenses/by/3.0/igo/), which permits use, sharing, adaptation, distribution and reproduction in any medium or format, as long as you give appropriate credit to the IAEA: International Atomic Energy Agency, provide a link to the Creative Commons license and indicate if changes were made.
Any dispute related to the use of the works of the IAEA: International Atomic Energy Agency that cannot be settled amicably shall be submitted to arbitration pursuant to the UNCITRAL rules. The use of the IAEA: International Atomic Energy Agency's name for any purpose other than for attribution, and the use of the IAEA: International Atomic Energy Agency's logo, shall be subject to a separate written license agreement between the IAEA: International Atomic Energy Agency and the user and is not authorized as part of this CC-IGO license. Note that the link provided above includes additional terms and conditions of the license.
The images or other third party material in this chapter are included in the chapter's Creative Commons license, unless indicated otherwise in a credit line to the material. If material is not included in the chapter's Creative Commons license and your intended use is not permitted by statutory regulation or exceeds the permitted use, you will need to obtain permission directly from the copyright holder.
Copyright information
© 2023 The Author(s)
About this chapter

Cite this chapter
Brink, A., Bar-Sever, Z., Biassoni, L. (2023). Liver and Spleen. In: Bar-Sever, Z., Giammarile, F., Israel, O., Nadel, H. (eds) A Practical Guide for Pediatric Nuclear Medicine. Springer, Berlin, Heidelberg. https://doi.org/10.1007/978-3-662-67631-8_7
Download citation
DOI: https://doi.org/10.1007/978-3-662-67631-8_7
Published:
Publisher Name: Springer, Berlin, Heidelberg
Print ISBN: 978-3-662-67630-1
Online ISBN: 978-3-662-67631-8
eBook Packages: MedicineMedicine (R0)