
Abstract
This paper describes problems in mathematics learning, the development of a system to address them, and its effectiveness and considerations. We realize a function that converts symbolic expressions entered by learners to graphical representations and a function for manipulating the converted graphic. The conversion function enables the visualization of an input symbolic expression as a graphic. If the symbolic expression contains an error, the function visualizes the error so that learners can become aware of it. Through their operations, learners deepen their understanding of how the symbolic sentence influences the graphic and clarify their understanding of the relation between the symbolic expression and its graphical representation.
You have full access to this open access chapter, Download conference paper PDF
Keywords
1 Introduction
This paper describes the development of a learning support system for understanding mathematics by expression transformation and active manipulations.
In an ordinary teaching form, since the ratio of learners to teachers is N to 1, the teacher cannot individually diagnose each learner’s perception and provide appropriate feedback. Therefore, the learner cannot sufficiently learn whether an idea is correct or erroneous, or the underlying explanation. Even if there is an error in the learner’s response, it is not noticed, and trial and error cannot be performed for correction. In order to solve this problem, it is necessary to construct a learning environment that can diagnose and provide feedback appropriate to each learner. However, in mathematical learning, since learners often have a superficial understanding, simple diagnosis and feedback may result in an insufficient understanding of errors. In problem-solving in mathematics, learners cannot interpret a sentence based on the unique symbolic description; accordingly, those who do not aim for a deep understanding are limited by a superficial understanding. In normal learning, it is possible to memorize an example and the way in which it is solved; if a similar problem is presented, it can be solved by applying the procedure corresponding to the past problem. Even a learner who gains such a superficial understanding may not fully understand the meaning of his own solution or may not be able to explain it [1]. In order to solve this problem, it is important to understand what the problem sentence or solution means in graphical form and to understand how to express a graphical representation as a sentence or a mathematical expression. In addition, it has been pointed out that thinking about a situation represented by one sentence described by a learner, discovering an error, and obtaining an endogenous awareness are important for correcting and understanding knowledge [2,3,4,5].
Therefore, in this research, a concept expressed by symbols, such as letters, mathematical expressions, and sentences, is represented by symbolic expression, and a concept handled by mathematics is represented by a graphical depiction composed of points and lines in order to promote an understanding of the relationship between this symbolic expression and graphical expression. Therefore, the purpose of this work was to define a concept expressed in mathematics by symbols, such as letters, mathematical expressions, or sentences, as a symbolic expression, and a concept expressed as a graphic composed of points, lines, and the like, which is handled in mathematics as a graphical expression, in order to promote an understanding of the relationship between this symbolic expression and the graphical expression.
To deepen the understanding between symbolic representation and graphical representation, we used a system in which a function described one expression by a learner and visualized it by converting it to the other expression type. In this system, the learner describes the solution method using a symbolic expression, and a feedback function is developed such that the system visualizes the learner’s solution as a graphical expression. In this paper, we deal with a planar coordinate geometry problem with a locus as a theme. Recent work has suggested sentences handled in mathematics aimed at promoting the understanding of symbolic expressions and graphic expressions (point P (x, y), AP = BP, etc.). We developed a system that generates graphics that can be operated. We found that converting a symbolic expression in mathematics to a graphical representation results in a voluntarily awareness of the relationship between the two expressions. Based on this, learners can think about their own descriptions and consider ways to detect errors.
In this paper, we adopt a function in which the system presents a graphical representation of a correct answer corresponding to each sentence of the answer and an answer template in a form in which a part of the symbolic text is blank, and receives inputs from the learner. A system with these functions enables learners to create an “endogenous awareness” of errors and to understand the relationship between a symbolic representation and graphical representation. As a result, an answer can be considered graphically for a symbolic sentence, and these graphical contents can be understood symbolically, consequently leading to a mathematical understanding.
2 Conventional Work
Nakahara [6] proposes five categories of mathematical expressions: realistic, operation, graphical, linguistic, and symbolic. Using these expressions, it is difficult for learners to grasp the quantitative relationships included in mathematical sentences. The roles and effects of graphical representation have been clarified in conventional work [9]. Recent studies of graphical representations have indicated that they have multiple roles and effects. For example, they can lessen the role of working memory in children learning mathematics, produce concrete models, make it easier to find related information, and make features of a problem clearer [7]. Furthermore, graphical representations more clearly express problem structures, provide a basis for correctly solving problems, allow tracing learners’ knowledge, and clearly show implicit information [8].
However, despite research themes aimed at promoting the understanding of symbolic expressions by exploiting graphical representation, there has been no change in the status quo, and graphical expressions are not commonly used. Additionally, many studies have focused on graphical expressions [6], but the understanding of their relationship with symbolic expressions is unclear.
Nakahara [6] argues that it is important for learners to capture problems and solutions using various expression methods. Even if an answer can be described by a symbolic expression, a learner who cannot imagine a graphic represented by the form of the answer cannot be said to have a sufficient understanding. Accordingly, it is claimed that it is important to develop various expression methods for learners to deepen their mathematical understanding in mathematics learning. There is a lack of training approaches in which symbolic expression errors are visualized in graphical form and students are prompted to think about their relationships in a trial-and-error manner. Additionally, the visualization of errors in previous studies has only been performed by the simulation (execution) of results based on the learner’s thinking.
3 System Design
In this paper, we develop a system that realizes a function for converting symbolic expressions described by learners into graphical representations as an initial stage of environmental development that enables the mutual conversion between symbolic representation and graphic expression. The internal design of the system is summarized in Fig. 1. As mentioned in Sect. 2, in mathematics learning, it is important to understand each component of the answer sentence. The system diagnoses the correctness or incorrectness of each component, rather than the whole sentence, for the learner’s mathematical solution, and returns a graphic that conveys the content to the learner. Like source code compilation in programming learning, we diagnose the correctness of each sentence, and graphically display the contents to the learner.

Internal design of the system.
3.1 Learning Task
Although the scope of this work covers high school mathematics, college students do not fully understand the relationship between symbols and graphics, even for mathematics in the high school range. A sentence expressing the concept/quantity relation handled in this range (a sentence such as “point P is (x, y)” used in mathematics textbooks “from the condition of problem”) is obtained with a numerical/restricted part by preparing an answer template in which a part is blank, supplementing words and numerals suitable for the blank, and combining the template sentences to create an answer sentence. In addition, in this paper, we shall make a simple sentence containing one or more graphically meaningful elements and limit it to a single element to the extent possible. An example would be a sentence containing “a statement defining a point” and “a relation of that point.” In this case, the point definition becomes one element and is made visible in the graphic. Here, the point definition is given as point coordinates (x, y), and the point relationship is a sentence, such as “AP = BP,” which stipulates that the line segments AP and BP are of equal length. We refer to this type of statement as a short sentence. We refer to such a point P as (x, y), AP = BP, with the restricted part of the sentence as a blank “answer template” that is used when the learner designs the answer. When describing an answer by a learner, an answer template is selected, the learner’s words, numerical values, variables, and the like are inserted into the blank space of the template, a single sentence for one line of the whole answer is completed, and answers can be described. Completion of the whole answer can be realized by combining this simple sentence and then expressing the answer.
3.2 Feedback Through Error Visualization
In an ordinary classroom lecture where the ratio of learners to teachers is N to 1, it is extremely important to individually diagnose the cause of wrong answers by learners and to provide appropriate feedback for each learner having difficulty. Often, only the learner’s answer is deemed correct or incorrect, and the correct answer is often presented. However, this level of feedback is insufficient for a trial-and-error approach, and the learner cannot fully reflect on the reason for an incorrect answer. For the learner to look back on the error itself rather than negative feedback indicating that an answer was incorrect, positive feedback (error visualization) indicating what is wrong, even if an answer is correct, is effective. Learning from mistakes is possible by this approach. The visualization of errors can be applied to the situation in which the learner’s answer is affirmed, and the learner is prompted to spontaneously detect an error by observing the visualized contents.
Many works have suggested that this “learning from errors” approach plays an important role in knowledge correction and understanding, particularly when learners notice their errors themselves [2,3,4,5]. Recent studies have suggested that error visualization is a way of grasping action and reaction dynamics [10,11,12], inferring error visualization in geometric proofs [13], visualizing errors as three-dimensional models [14], and visualizing errors in English composition using animation [15]. To produce an “intrinsic awareness” of errors, it is effective to indicate the kind of conclusion that results from answers and to show the learner contradictions that arise.
In this work, according to the answer sentence constructed by the learner using the answer template in the mathematical problem, a corresponding graphical representation is generated one sentence at a time. As a result, when the wrong answer template is used or when inappropriate content is entered in the answer template, a graphic with strange elements (constraints) is generated so that the learner introspectively notices the error.
3.3 Manipulation Function of Visualized Graphics
In studies of the visualization of errors in physics (dynamics) learning and related research described in the previous section, in addition to the solution expressed by the learner, a method for simulating errors using ordinary physical laws or the like is used. Therefore, even if the learner’s answer is insufficient, the behavior can be generated using the physical law. On the other hand, in mathematics, when the learner’s answer is insufficient, there is a problem in which an appropriate graphic cannot be generated. For example, for the single sentence “Position P is (x, y),” it is impossible to uniquely determine the original location of point P (point P is correct if it is arranged on the xy-plane). Therefore, the system will be placed on random coordinates, such as (3, 2), as an example. However, in this case, we cannot visualize the difference between the original sentence and the simple sentence “point P is (3, 2).” Therefore, simply visualizing the content of the sentence is not enough to determine whether the learner happened to obtain such a picture by chance or whether the graphic was definitively written.
Therefore, in this research, the visual output is designed so that the learner can operate it within the range of sentence constraints for the sentence in the current situation (a simple sentence). As a result, the learner can confirm the range of the drawing obtained by the current answer sentence and deepen their understanding. Additionally, despite being a trajectory problem, it is expected that point P exposes the error in the manipulation by not including the trajectory or fixing it.
4 System Implementation
4.1 Learning Range
In this system, the subject range is mathematics II “graphics and equations;” that is, the problem ranges up to the ideas of a locus and trajectory in planar coordinate geometry (e.g., calculations of the distance between points). In the system, problems in the above-mentioned range of topics in actual mathematics textbooks, following the guidelines in Sect. 3.1, “point P (x, y),” “AP = BP,” and so on were analyzed. We prepared an answer template sentence containing graphical elements of about one or two clauses. Each problem (three questions) prepared by the system can be answered by combining six simple sentences. A simple sentence prepared in the system consists of a “prerequisite” combining the definition of points and question by points, “conditional expression” summarizing conditions on points, “calculation formula” consisting of the precondition and conditional expression, “result” of the “calculation formula,” and “conclusion” derived from the “result”.
4.2 Learner’s Activities in the System
First, the system presents a problem list that the learner can tackle. The learner then selects the problem to be addressed and shifts to the problem solution of mathematical learning (Fig. 2). The problem that can be addressed in this system is one question (problem in Fig. 2), namely, calculating unknown coordinates from the distance between a point and another point, and two questions (three total questions) for finding the trajectory of a point. The learner’s activities within the system are as follows.

Problem-solving screen.
-
1.
Check mathematical problem sentences given to the system.
-
2.
Press the “answer start” button to operate functions, such as pull-down and answer construction.
-
3.
Since the model answer graphic for the sentence contents of process 1 (the first line of the overall answer) is displayed on the right graphic, the observation and manipulation contents of that graphic are confirmed (right graphic of Fig. 3).
Fig. 3. 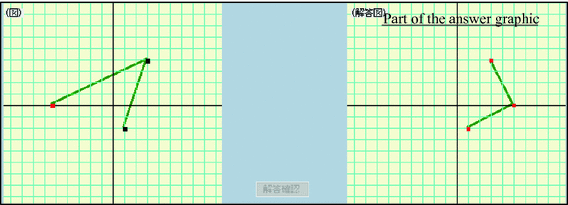
Conversion graphic (right) and model answer graphic.
-
4.
After confirmation, a sentence matching the graphic is selected from the template list on the lower left portion of the screen and the contents of the selected template are displayed below the list.
-
5.
According to the contents of the selected template, the system creates a text box for blank input, so that each word or numerical value corresponding thereto is inserted in the blank. Then, the “build answer” button is pressed.
-
6.
When the “build answer” button is pressed, the system generates the selected template and the drawing with the contents in the blanks on the left side of the screen (Fig. 3, Left); check the observation and the manipulation content of that graphic.
-
7.
Steps 4 to 6 are repeated when there is an uncomfortable feeling (error) regarding the behavior of the graphic based on the symbolic text, with reference to the model solution drawing.
-
8.
When answer 6 is correct, it becomes impossible to manipulate the template, and the “answer confirmation” button at the center of the screen (between drawing drawings) becomes operable. After sufficiently confirming that the relationship between the answer graphic and the model answer graphic is consistent, pressing this button shifts the solution to the next process.

By repeating the above flow, the learner constructs an answer.
4.3 Interface
The user interface of the system is shown in Fig. 2. The learner’s problem answer is obtained by providing an input to the template using the keyboard at the lower right portion of the screen. This is necessary because when allowing the learner’s free input, it is possible to enter sentence content that the system cannot interpret. In this research, focusing on the understanding of the relationship between symbolic expression and graphical expression, which is not a logical consistency of the solution, it is used not as a free construct by the learner, but as a meaningful mistake choice. The interface was made to enable recognition of the difference between the graphical meaning of the group mean and the graphical meaning of meaningful choices of correct answers. A sentence informing the learner’s current answer situation is displayed at the bottom of the screen, and a “return to menu” button for returning to problem selection, an “update” button for initializing the state of the problem being worked on, and a “delete line drawing” button for erasing only the line are prepared.
4.4 Realization of Graphical Generation and Manipulation Based on Sentences
In this system, graphical elements are stored in the database in correspondence with prepared template sentences. For example, for the simple sentence “the point P is ((a), (b)),” it is described in the database that “it is a point moving on the xy-plane” and “AP = BP.” The distance moved by point P, equivalent to the distance between point A and point B, is described for the simple sentence. The system refers to this database for the sentence used by the learner and calculates and generates a graphic according to the constraint. When the graphic cannot be uniquely determined due to the constraint, a graphic is generated as an example within the constraint, and the graphic can be manipulated within the constraint. (The elements of the graphic described in each template are as follows.)
In “prerequisites,” points can be generated from the information given from the problem and the definitions of points suitable for the problem by the learner. It judges whether the input value is a numeric value or a variable and generates a graphic that has a constraint matching the content. It describes what point, which points, and what constraints are added regarding the distance between points, such as “AB = BP” and “AP:BP.” Assuming that the constraint is (x, y) under the precondition, the point can be moved along a straight line according to the conditional expression “AB = BP,” and is determined as one point if it is (x, 0) or (0, y). A graphic is drawn. In “calculation formula,” mathematical expressions consisting of “conditional expressions” or mathematical expressions of “results” derived from the “calculation formula” are prepared. For example, when a numerical value is incorrect when assigned to a “conditional expression” in the “calculation formula,” a graphic is generated referring to the wrong numerical value. Figure 4 shows an example of errors when inputting incorrect coordinates for given coordinates by formulas. In “conclusion,” since the coordinates of the point and the expression of the straight line are determined based on the “result,” if a wrong input is made, a different point is generated.

Visualization of errors in answer sentences.
5 Evaluation Experiment
5.1 Purpose
We will conduct an experiment to verify the validity and effectiveness of the feedback function of the learning system in mathematics developed in this paper. In addition, since this experiment is scheduled to be performed ex post, this report will describe its progress.
5.2 Method
To confirm the effectiveness of system functions, we also used a system without an expression conversion function. Subjects were 18 university students who had taken at least one mathematics course intended for those in math-heavy fields of study. These subjects were divided into an experimental group (9 subjects) and a control group (9 subjects). Before applying the system, the experimental procedure was explained to the subjects. The system was operated by an author of the study, and the method and manipulation of the system were described, including a tutorial on how problems are handled in the case of an incorrect answer.
The experimental procedure was as follows: preliminary system testing before learning (15 min), the first half of system learning (30 min), and post-test 1 (15 min). The contents were as follows: Question 1 is a contradiction evaluation problem including four questions, namely, a question to show the symbolic statement given question 2, question 3 is a blank column assist question, and question 4 is a description problem. It is a quiz questionnaire with 21 evaluation points. A delayed posttest is expected to be implemented 4 weeks after the first day. In the delayed follow-up test, after a 15-min test (first day and common content), the questionnaire is administered.
5.3 Provisional
The expected effects of this experiment on learners are as follows:
-
Expression conversion from symbols to graphics is effective for mathematical understanding.
-
Visualization of errors leads to mathematical understanding.
-
Manipulating graphics leads to an understanding of the source symbolic sentence.
5.4 Results
In this paper, we do not conduct the delayed follow-up test, and so we report the results of the pre-ex post-test on the first day.
Table 1 shows the scores and pre- and post-test results for the experimental and control groups obtained in the experiment described in Sect. 5. All tests were evaluated with a significance level of p < 0.01.
Table 1 shows the average number of correct answers in the pre/post-tests for subjects of the experimental and control groups. From Table 1, the average number of correct answers immediately after system learning in the experimental group (from pre to post-testing) improved by 5.78. In particular, in the description problem of Q4, the learning effect by this system is evident. In the control group, the average number of correct answers immediately after system learning (from pre- to post-testing) improved by 1.44. This shows that system learning outperforms the average number of correct answers as compared to the system without the function for converting symbolic representations to graphic representations.
Furthermore, a variance analysis confirmed significant differences among individuals in both groups. In an analysis of variance, significant differences were confirmed within the individual. Since an interaction effect was confirmed, a simple main effect analysis was performed to determine the source of the interaction. In the simple main effect analysis, significant differences were detected in both the experimental group (p < 0.001) and the control group (p < 0.05) from pre- to post-testing. In other words, significant differences were obtained in the post-test after learning in this system compared with the control group, indicating that the proposed system was effective.
6 Discussion
In this work, we proposed a method to improve understanding of the relationship between symbolic and graphical expressions. In particular, learners describe answers using symbolic expressions, and the system develops a function to visualize the answers by graphical expressions. We demonstrated that the proposed system is suitable for mathematical learning. Pre- and post-testing showed that subjects could produce answers from problem solving, along with graphic answers. We also confirmed that points of confusion at the time of testing were corrected after learning in the system. These results suggest that learners themselves experienced expression transformation to diagrams, leading to the manipulation of figures.
7 Summary
We proposed the transformation of mathematical expressions and graphic manipulations as a method for improving learner understanding of mathematics. The selected target expressions were symbolic and graphic, two forms of expression that are important for understanding mathematics. Using the proposed system, we conducted experiments to verify its effectiveness at improving understanding in mathematics.
We evaluated the effectiveness for mathematical learning by providing graphical feedback to learners using the proposed system. The proposed method of converting mathematical expressions promoted learner understanding, as evidenced by the experimental results. Furthermore, by manipulating graphics, we were able to support understanding of motion constraints and quantity relations in graphics included along with symbolic sentences.
Our findings are summarized as follows:
-
1.
At the time of learning, there were significant differences in test results between the system with functions for converting sentences into graphics and the control group. This demonstrates that the method is suitable for mathematical learning.
-
2.
Learner efforts to correct errors were indicated by graphical manipulations. In immediate post-tests, learners presented their own ideas by drawing graphics.
-
3.
In the evaluation experiment, we will plan a delayed posteriori test as an extension of this experiment; we need to consider the whole experiment further based on a comparison with the experiment results obtained on the first day.
Future work will focus on further improvements in awareness of errors due to observation and manipulation by considering conversion from graphics to symbols.
References
Fujimura, N.: Acquisition and utilization of knowledge and meta - cognition, Makiko Sannomiya Metacognition - Higher order cognitive function supporting learning ability, Kitaoji Shobo, Kyoto (2008). (in Japanese)
Perkinson, H.J.: Learning from Our Mistakes: A Reinterpretation of Twentieth-Century Educational Theory, p. 305. Keiso shobo, Tokyo (2000). (in Japanese)
Hirashima, T., Horiguchi, T.: Attempt to visualize errors from orienting learning from error. Trans. Jpn. Soc. Inf. Syst. Educ. 21(3), 178–186 (2004). (in Japanese)
Hirashima, T.: Aiming at interaction giving awareness of error. Hum. Interface Trans. Hum. Interface Soc. 6(2), 99–102 (2004). (in Japanese)
Tomoto, T., Imai, I., Horiguchi, T., Hirashima, T.: A support environment for learning of class structure by concept mapping using error-visualization. Trans. Jpn. Soc. Inf. Syst. Educ. 30(1), 42–53 (2013)
Nakahara, T.: Study of Constitutive Approach in Mathematics and Mathematics, p. 389. Seibunsha, Kasugai (1995)
Van Essen, G., Hamaker, C.: Using self-generated drawings to solve arithmetic word problems. J. Educ. Res. 83(6), 301–312 (1990)
Diezmann, C.M., English, L.D.: Promoting the use of graphicals as tools for thinking. In: NCTM 2001 Yearbook: The Roles of Representation in School Mathematics, pp. 77–89. NCTM (2001)
Doishita, A., Shimizu, H., Ueoka, T., Ichisaki, M.: Teaching strategy in the problem solving: conducting a survey of the pupils on pictures and graphicals and putting it into practice. Jpn. Soc. Math. Educ. 68(4), 18–22 (1986). (in Japanese)
Horiguchi, T., Hirashima, T.: Simulation-based learning environment for assisting error-awareness - management of error-based simulation considering the expressiveness and effectiveness. Trans. Jpn. Soc. Inf. Syst. Educ. 18(3), 364–376 (2001). (in Japanese)
Horiguchi, T., Hirashima, T.: Simulation-based learning environment for assisting error-correction. Jpn. Soc. Artif. Intell. 17(4), 462–472 (2002). (in Japanese)
Imai, I., Tomoto, T., Horiguchi, T., Hirashima, T.: A classroom practice of error-based simulation to improve pulils’ understanding of mechanics: the “challenge to Newton!” project. Trans. Jpn. Soc. Inf. Syst. Educ. 25(2), 194–203 (2008). (in Japanese)
Funaoi, H., Kameda, T., Hirashima, T.: Visualization of an error in solution of geometry proof problems. Jpn. J. Educ. Technol. 32(4), 425–433 (2009). (in Japanese)
Matsuda, N., Takagi, S., Soga, M., Horiguchi, T., Hirashima, T., Taki, H., Yoshimoto, H.: Error visualization for pencil drawing with three-dimensional model. IEICE Trans. Inf. Syst. 91(2), 324–332 (2008). (in Japanese)
Kunichika, H., Koga, T., Deyama, T., Murakami, T., Hirashima, T., Takeuchi, A.: Learning support for English composition with error visualization. IEICE Trans. Inf. Syst. 91(2), 210–219 (2008). (in Japanese)
Acknowledgements
This work was partially funded by Grants-in-Aid for Scientific Research (C) (15K00492), (B) (K15H02931), and (B) (K26280127) in Japan.
Author information
Authors and Affiliations
Corresponding author
Editor information
Editors and Affiliations
Rights and permissions
Copyright information
© 2018 Springer International Publishing AG, part of Springer Nature
About this paper

Cite this paper
Kurokawa, K., Tomoto, T., Horiguchi, T., Hirashima, T. (2018). Development of a Mathematical Solution Environment to Understand Symbolic Expressions in Mathematics. In: Yamamoto, S., Mori, H. (eds) Human Interface and the Management of Information. Information in Applications and Services. HIMI 2018. Lecture Notes in Computer Science(), vol 10905. Springer, Cham. https://doi.org/10.1007/978-3-319-92046-7_26
Download citation
DOI: https://doi.org/10.1007/978-3-319-92046-7_26
Published:
Publisher Name: Springer, Cham
Print ISBN: 978-3-319-92045-0
Online ISBN: 978-3-319-92046-7
eBook Packages: Computer ScienceComputer Science (R0)