
Abstract
The paper presents a case of Smart Shoes that uses ultrasonic sensors to detect the obstacle in front of the user. Additionally, this shoe signals a user by tapping at the foot arch. An evaluative study of the Smart Shoes was conducted with (n = 31) users; (17) blind people, (9) low vision and (5) non-disabled users. The study was conducted to judge reliability of the Smart Shoes by evaluating it from (a) ratio of obstacles identified to total obstacles encountered, (b) distance of obstacle apprehension and (c) response time. The study was conducted in a controlled and definite environment. The results from the study illustrate this footwear to be 89.5% effective in detecting obstacles such as vehicles, people, furniture, footpaths, poles, and miscellaneous obstacles with a mean response time of 3.08 s. Users average distance of obstacle apprehension was 108 cm in regular mode and 50 cm in the crowd mode. The future research & evaluative studies will be conducted in actual operational/moving environments.
You have full access to this open access chapter, Download conference paper PDF
Keywords
1 Introduction
Worldwide, it is estimated that approximately 285 million people are visually impaired out of which 39 million are blind [1]. India accounts for 20% of world’s blind population. Mobility is an important aspect of human life and is adversely affected in people with visual disability. To overcome this limitation, they turn towards assistive devices to take a step closer to independent mobility. Most common and the oldest conventional device aiding them in mobility is the Hoover cane. Other options such as guide dogs, GPS and other Tech Gizmos have been continuously evolving to make these users independent [2]. The design and evaluative study of smart shoes reported in this paper is an effort to leapfrog current assistive devices’ development process for people with visual Impairment.
The long Hoover cane is one of the world’s oldest products. While Hoover cane has been a widely accepted mobility-aid, there has not been any significant innovation in this domain since last few decades. In analyzing the existing Hoover cane, we came across few limitations needed to be addressed to improve the existing mobility of its users. For instance, users get feedback about the obstacles only when the cane touches it. This means a small range of obstacle detection (the length of the cane) [3], and consequently less time to react to the obstacle. It can prove to be dangerous when it comes to obstacles like moving vehicles etc. Also, using aids like Hoover cane, guide dogs or some other technologically advanced hand-held gadgets to navigate in domestic environment keeps one hand always occupied in holding the aid, which otherwise can be used for purposes like safeguarding during an accident.
Many people without disabilities perceive an assistive mobility aid as an indicator of the physical disability and they either get out of the way or rush to help the user, out of pity. What people don’t realize is that these are the means used by them to be more independent. This stigma created in the society against the aids and the visually challenged have perpetuated a myth of helplessness for long and have kept them away from achieving the first-class status. In studying most of the accidents [4] among people using Hoover cane, we found that one of the primary reasons usually is the short or long length of the cane not being able to provide adequate information in time and lack of training.
With reference to Neurophysiology, humans are sight dependent [5]. 30–40% of our cerebral cortex is devoted to vision, as compared to 8% for touch or just 3% for audio [6]. To compensate for our most dominant sense, providing the feedback tactilely [7] is an efficient and effective mechanism when coupled with vibrations. We do acknowledge that prolonged exposure to vibrations could cause problems like tactile hallucinations (“Phantom Vibrations”) and Whole-Body/Hand-Arm Vibration Syndrome [8].
For blind people, hearing and touch become the major senses, respectively [9]. Considering the noise pollution level of private or public spaces in India, tap (tactile) emerges as a promising tool to communicate with aforementioned users. The Smart Shoes presented in this paper explores the potential of tap in alerting users about the obstacles in front through a novel (and innocuous on prolonged usage) feedback mechanism. This footwear employs a novel method of providing feedback and has a long and customizable range of detection that can aid in independent mobility. The remaining sections will describe the design of the Smart Shoes, methods followed in conducting user testing, results of this on-going study, followed by conclusion indicating future research plans for this project.
2 Design
The design of Smart Shoes is our effort to serve visually impaired people by facilitating their mobility. It detects obstacles in a customizable range of up to 2 m by making use of an ultrasonic sensor and providing the feedback to user through a tapping mechanism at the foot-arch. The footwear employs a directional ultrasound sensor that is continuously transmitting and receiving sound waves to detect the obstacles in front of the user. The intensity of the tapping varies based on the distance between the user and the obstacle. This feedback mechanism has been developed meticulously so as to be effective and at the same time, not to have any ill effects on the user’s health, in case of long term product usage. The footwear works in two modes; (a) Regular mode - This is the ‘by-default’ mode detecting obstacles present in a range of 0–2 m. (b) Crowd mode- It has a range of 0–1 m and is suitable for surroundings with frequent obstacles. Figure 1 depicts the design of Smart Shoes. Figure 2 depicts positioning of the ultrasound sensor.

Depicts ultrasound sensor that detects the obstacles (left). Depicts design of the Smart Shoes prototype (right).

Depicts two modes of the Smart Shoes and power button
Based on the mode selected, processor sends the signal to arch-pad to initiate tapping with computed intensity. Ease of usability is what the user interface is based on. The users don’t have to remember any complex button combinations nor do they need an extensive training to operate the device. There are two buttons; (a) Power button: This button is used for powering the system on/off, (b) Mode button: The footwear can be used in any of the two modes using the mode button. When it is pressed, the buzzer present in the system indicates current mode. Figure 3 depicts two modes of the Smart Shoes and the two buttons.

Depicts distribution of user age and level of blindness
The system is powered by using a rechargeable Lithium-ion battery. Battery level is indicated by the buzzer when switching on the system. Once fully charged the system can work for at least 5 h. The pleasant aesthetics of the footwear helps in diminishing the prejudice held by the society against the assistive devices.
3 Method
3.1 User Group
A total of (n = 31) users participated in the study where 17 users were Blind People, 9 Low vision [10] and 5 non-disabled users (see Fig. 3). Non-disabled and low vision users were included in the study to understand if presence of sense of sight affects the usage of the product. These users were blindfolded during the testing. Of the 26 users with visual disability, 20 users had it since birth (of which 8 had low vision) and the rest 6 users from time ranging from 4 years ago to 22 years ago. The users were distributed into the age group of 16 to 35 years old, 45% users falling in the age group of 16–20 years old, 35% in the age group of 21–25 years old, and 10% in the age group of both 26–30 years old and 31–35 years old each. 9 users out of the total had undergone a cane-training course. All the users volunteered for the study and were associated with Blind People’s Association (BPA), Ahmedabad, Gujarat.
3.2 Experiment Design
To assess the effectiveness of Smart Shoes in detecting the obstacles, definite control trials with (n = 31) users were conducted on an artificial obstacle course. The course was designed in such a way so as to emulate the obstacles encountered in day-to-day life. All the visually impaired users (n = 26) were selected from BPA, Ahmedabad and were from different backgrounds (age, educational qualification, profession etc.). All these participants were using different modes of navigation from one place to another (cane, human aid etc.). However during the testing they were asked to use only smart shoes to navigate among the obstacles. The non-disabled users (n = 5) belonged to Ahmedabad, Gujarat and were happy to volunteer by themselves on seeing the experiment.
Before the testing, each user was introduced to the Smart Shoes and its functionality for an average of 5 min. They were shown a demonstration of the Smart Shoes; they were asked to be stationary and one team member from development team moved in front of them; changing the distance between them and allowing them to get a feel of the tapping and its varying intensity. The simple UI of the Smart Shoes allowed the users to get acquainted with it relatively quickly and ready for the test.
The testing took place in the campus of BPA, Ahmedabad, Gujarat. A parking space of 12 × 6 m was used as the test arena where all the frequently encountered obstacles (such as vehicles, people, footpath, poles, pillars, furniture and other miscellaneous obstacles) were re-created artificially (see Fig. 4). The obstacles were categorized as follows:

Depicts artificial obstacle course
-
Vehicle: Motorbike, Car, Cycle, Rickshaw, Three-wheeler, Carts, Bus.
-
People: Our team members tried to simulate the encounters such that the user might have in their daily life with fellow human beings (stationary and moving of 3 & 2 people respectively, refer Fig. 5).
Fig. 5. 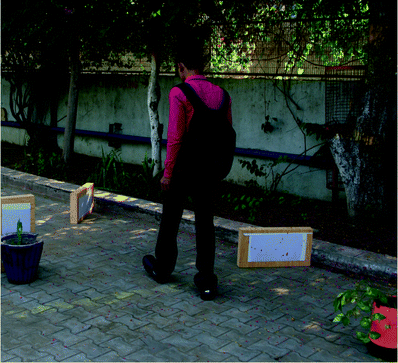
User navigating through the obstacle course wearing the Smart Shoes
-
Footpath: Peripheral walls of the obstacle course ranging from 15 cm to 45 cm high.
-
Pole: Electric poles, PVC pipes (diameter 20 cm), cylindrical pots.
-
Furniture: Chair with cylindrical thin legs with the ground clearance of more than 45 cm, Sofa, etc.
-
Miscellaneous Obstacles: Cardboard blocks of different dimensions.

All the obstacles were of different dimensions and users encountered one obstacle at a time. To ascertain the ability and effectiveness of the Smart Shoes, the following performance indicators were studied:
The Ratio of Obstacles Identified to Total Obstacles Encountered:
Out of all the obstacles that were encountered by the user while navigating the course, how many were detected before coming in contact with the obstacle. A high ratio indicates a high awareness about the obstacle presence in the environment. This will also reflect the collision rate of a user with the obstacles when he was mobilized using the Smart Shoes. The relation being inversely proportional to the metric studied.
The Distance of Obstacle Apprehension:
The distance between the user and the obstacle when it was detected with the help of the smart shoes. A large distance means early detection, alerting the user about the obstacle just in time to take effective measures to avoid it.
Response time:
Response time is characterized as the time between the user stopping due to an obstacle detection using the Smart Shoes and starting to walk again, assuming that an obstacle-free path has been identified. A low response time means that the user has adapted well to the ways of the Smart Shoes and is able to quickly ascertain the free path when encountered with an obstacle.
4 Results
The results showed that the users were able to detect 89.5% obstacles out of all encountered obstacles with a mean response time of 3.08 s. Users’ average distance of obstacle apprehension was 108 cm in regular mode and 50 cm in the crowd mode. Sample image shown in Fig. 5.
4.1 Ratio of Obstacles Identified to Total Obstacles Encountered
The overall ratio of the obstacles identified, against the total obstacles encountered were 0.8948. Users encountered up to a maximum of 40 obstacles during the experiment in the obstacle course. The responses were manually scored and the collisions with the obstacles were noted down during the experiment. The ratio of obstacles identified to total obstacles encountered was calculated post-experiment from the data (see Table 1).
4.2 Distance of Obstacle Apprehension
The Smart Shoes has two modes: Regular mode (range 0–200 cm) and crowd mode (0–100 cm). The average distance of early detection was 108 cm in regular mode with a standard deviation of 21.49 and 50 cm in crowd mode with a standard deviation of 7.89 (see Table 2).
4.3 Response Time
The average response time was 3.08 s. Prolonged usage of the product may result in a shorter response time for the user. The responses were manually scored meticulously from a thorough study of the video recordings of the experiments post testing (see Table 3).
4.4 Other Observations on the Use of the Smart Shoes
The users were skeptical about the feedback mechanism of the Smart Shoes in the beginning of the experiment leading to a cautious gait. As they became familiar with the product usage and understood how the feedback works, their walking resumed to normal and had a better understanding of the change in the tapping intensity. The users became more confident as the experiment went on and they were able to check for an obstacle-free path using the Smart Shoes more efficiently. In rare cases, users went astray and needed experimenter’s intervention to get back on course.
5 Conclusions
This paper presented an obstacle detection system embedded Smart Shoes that enabled people with visual impairment to identify obstacles in advance. Quantitative controlled trials conducted on (n = 31) users in an artificially designed obstacle course showed that the system is able to detect the obstacles with an efficiency of 89.5%. Users’ average distance of obstacle apprehension was 108 cm in regular mode and 50 cm in the crowd mode. The average response time of users was 3.08 s. The study was conducted on an artificially designed obstacle course. The obstacle course was designed carefully with a wide variety of obstacles. Obstacles present in the experiment replicated most commonly encountered hindrances in the daily lives of users. Users with blindness had an average obstacle detection ratio of 0.889 with an average response time of 2.54 s. Their average distance of obstacle apprehension was 108.88 cm in regular mode and 51.49 cm in crowd mode. Users with low vision had an average obstacle detection ratio of 0.91 with an average response time of 3.23 s. Their average distance of obstacle apprehension was 116.21 cm in regular mode and 48.11 cm in crowd mode. The users without disability had an average obstacle detection ratio of 0.89 with an average response time of 4.65 s. Their average distance of obstacle apprehension was 84.8 cm in regular mode and 48.4 cm in crowd mode.
The results reflected that the non-disabled users had the longest response time and the least distance of obstacle apprehension when it comes to using the Smart Shoes. It may have happened due to their sudden loss of sense of sight, implicitly relating this finding to the recently turned blinds. Further study including recently turned blind users will be able to reflect more on the same. Low vision users had the highest obstacle detection ratio. This may have happened due to their self-confidence in their mobility that their residual sight gives them even when they are blind-folded. They may also be dependent on their other senses for mobility that may have led to a high obstacle detection ratio using the Smart Shoes. From this study, we conclude that the Smart Shoes could be used by the blind and low vision users to enhance their visibility in daily life. In future, longitudinal research would be required to judge if the Smart Shoes would be able to augment their conventional way of mobility, thereby make them independent after prolonged usage. Next evaluative studies will be conducted in actual operational/moving environments.
References
World Health Organization. Visual Impairment and Blindness statistics: Fact sheet No. 282, August 2014
Tebo, L.R.: OTR/L. ATP, A Resource guide to assistive technology for students with visual impairment
Staffordshire University. http://blogs.staffs.ac.uk/profdavidclarkcarter/2014/10/21/why-would-a-blind-person-not-use-a-white-stick/
Manduchi, R., Kurniawan, S.: Mobility-related accidents experienced by people with visual impairment. AERJOURNAL-D-10-00048R1, February 2011
NORA Neuro-Optometric Rehabilitation Association. https://nora.cc/vision-a-brain-injury-mainmenu-64.html
Biological exceptions. perspective on our senses, September 2011
Pundlik, S., Tomasi, M., Luo, G.: Evaluation of a portable collision warning device for patients with peripheral vision loss in an obstacle course. Invest. Ophthalmol. Vis. Sci. 56, 2571–2579 (2015). doi:10.1167/iovs.14-15935
World Health Organization. Occupational exposure to vibration from hand-held tools: The effects on human performance: risk assessment and prevention, vol. 03, pp. 16–20
Velázquez, R.: Wearable assistive devices for the blind (Chap. 17). In: Lay-Ekuakille, A., Mukhopadhyay, S.C. (eds.) Wearable and Autonomous Biomedical Devices and Systems for Smart Environment: Issues and Characterization. LNEE, vol. 75, pp. 331–349. Springer, Heidelberg (2010). doi:10.1007/978-3-642-15687-8_17
Disabilities, Opportunities, Internetworking, and Technology (DO-IT). http://www.washington.edu/doit/how-are-terms-low-vision-visually-impaired-and-blind-defined
Acknowledgement
The research team would like to acknowledge Mr. Anip Sharma’s contribution for his support in building the prototype and assist us in conducting the field experiment.
Author information
Authors and Affiliations
Corresponding author
Editor information
Editors and Affiliations
Rights and permissions
Copyright information
© 2017 IFIP International Federation for Information Processing
About this paper
Cite this paper
Parmar, V.S., Inkoolu, K.S. (2017). Designing Smart Shoes for Obstacle Detection: Empowering Visually Challenged Users Through ICT. In: Bernhaupt, R., Dalvi, G., Joshi, A., K. Balkrishan, D., O'Neill, J., Winckler, M. (eds) Human-Computer Interaction – INTERACT 2017. INTERACT 2017. Lecture Notes in Computer Science(), vol 10515. Springer, Cham. https://doi.org/10.1007/978-3-319-67687-6_17
Download citation
DOI: https://doi.org/10.1007/978-3-319-67687-6_17
Published:
Publisher Name: Springer, Cham
Print ISBN: 978-3-319-67686-9
Online ISBN: 978-3-319-67687-6
eBook Packages: Computer ScienceComputer Science (R0)