
Abstract
This chapter highlights the context of the neighbourhoods issue. This is an uneasy one, because globalisation has become a dominant paradigm. What need would then scientists and decision-makers have to pay attention to neighbours, when the global world is at stake and within reach? Yet, we give the factors that explain the rise of the regionalisation –i.e. the neighbourhoods– issue, as a complementary pattern, along with the “globalisation” pattern, of the internationalisation of human activities in the last four decades. We also explain why this issue is poorly addressed in scientific literature in particular in Europe. Indeed, the EU is the most advanced experience of regional integration worldwide. But for many reasons, it overlooks relationships with its developing neighbour countries. We assume here that Europe and its neighbours constitute one major region. Despite unrest and wars in these neighbourhoods, we assume that they offer more opportunities than threats. We provide a territorial analysis of these, showing the tough methodological challenges we had to overcome when it comes to access to reliable data and geometries delineation, which are indispensable if one wants to draw an overall vision of this region.
You have full access to this open access chapter, Download chapter PDF
Keywords
These keywords were added by machine and not by the authors. This process is experimental and the keywords may be updated as the learning algorithm improves.
1.1 The Rise of the Neighbourhoods in the Regionalisation Context
1.1.1 The Dialectic Between Globalisation and Regionalisation
Three factors explain the rise of regionalisation—thus the neighbourhood—issue, as a complementary major pattern, along with the “globalisation” pattern, of the internationalisation of human activities in the four last decades. The first factor is economic: in a knowledge economy, an increasing share of the resources are decreasingly withdrawn to other players but rather produced with other players. The bigger the interaction with players the larger the new resources. Thus, neighbouring countries can more easily turn into strategic partners for business. The “neighbour” gets a new status: it is decreasingly viewed as the historical military enemy and increasingly becomes the necessary economic partner—see the new East Asian policy of China, which, in the 1990s turned its regional strategy from confrontation to partnership [Beeson and Li 2012].
The second factor is environmental: the rise of concerns regarding the climate and natural resources has, of course, a global dimension (e.g. IPCC reports), but it also has a regional dimension because dissemination of air or water pollution spreads to neighbouring territories. The domain of the environment provides the most convincing proof that proximity has not been dissolved in globalisation. Moreover, the perspective of costlier long distance transport due to energy price increases, could promote shorter supply chains, hence growing economic interaction with neighbours.
The third factor is political: the collapse of purely national regulation since the 1980s did not give way to alternative regulation at global scale. The recent failures of global regulation in the financial area (2008 international crisis), in the environment area (2009 Copenhagen climate change conference), and in the trade area (Doha round’s successive adjournments), have exposed a need for international regulation on a regional scale, of which the European Union was a primary example.
The consequences of this rising interaction between regionalisation and globalisation are threefold:
-
(i)
The rise of regionalism, that is the multiplication since the mid-1990s of Regional trade agreements—which go much further than trade since they can also deal with migration or environment. As reflected in the positions adopted by the FAO and Unctad favouring regional agreements [Mashayekhi et al. 2005], the regionalisation of efforts to regulate environment, food security, new North-South relations and international economic relations is more and more viewed as a positive complement to global regulation.
-
(ii)
The confirmation of de facto regionalisation of migratory, cultural and economic international exchanges. For decades, international trade has increased more on the scale of large international regions than on the scale of the world (Fig. 1.1). The story changed in the 2000s, due to the booming importance of a new global player: China, but the long run regionalisation pattern remains relevant. The advantages of regional cooperation are particularly high when it associates neighbours of different levels of development with economic complementarity: know-how and technology in the developed countries, rising markets, labour forces and low economic costs in their developing neighbours [Deblock and Regnault 2006]. Despite the globalisation of routes, foreigners still mostly come from the neighbourhoods; in the USA, contrary to what is often said due to the rapid growth of Asian newcomers, the bigger change over the last half century has been the replacement of European in-migrants by neighbour American in-migrants (Figs. 1.2 and 1.3).
Fig. 1.1 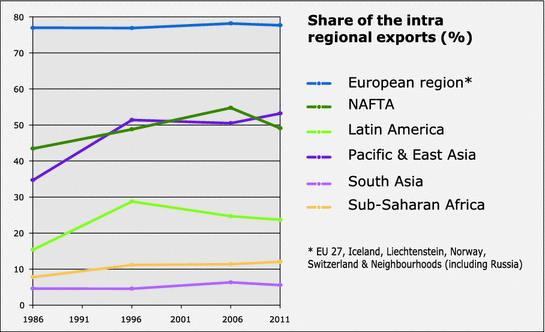
The long-run trend of regional integration. The case of trade. Source: Comtrade, ESPON TIGER & ITAN projects, FP7 Eurobroadmap Project, IGEAT, OMC, P.Beckouche
Fig. 1.2 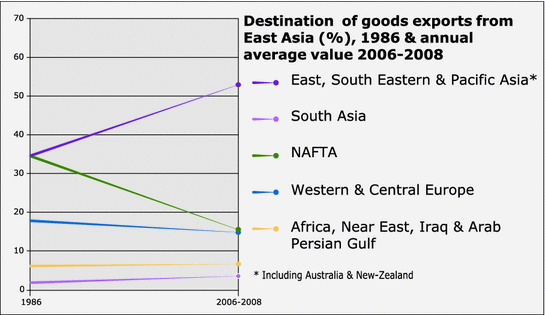
Trade: the impressive rise of the East Asia regional integration. Source: ESPON Europe in the World project, FP7 FP7 Eurobroadmap Project, IGEAT
Fig. 1.3 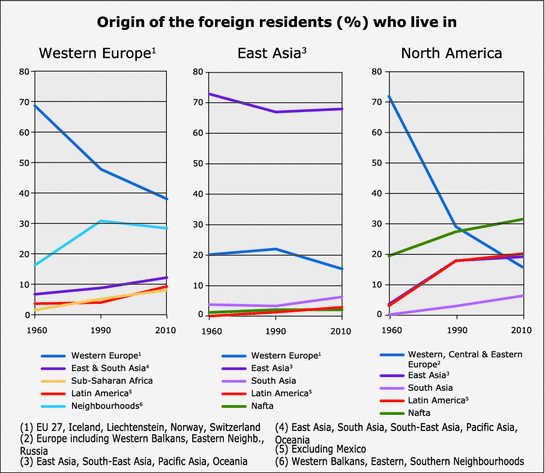
Despite the globalisation of routes, foreigners mostly come from the neighbourhoods. Source: IGEAT, World Bank & Bilateral Migration and Remittances, 2012
-
(iii)
What could be called the regionalisation of minds, that is to say the rising use of international institutions and think tanks to figure out internationalisation through the regional pattern. The World Bank works increasingly at a regional scale: “East Asia and the Pacific”, “Latin America”, “Middle East and North Africa (Mena region)” etc., as an example, see its book with the Islamic development bank on the Arab countries’ integration [CMI, WB and IDB 2012]. In 2011, the Asian development bank (ADB) published a report whose significant title is “Institutions for Regional Integration—Towards an Asian Economic Community”; regional integration is one of its three strategic axes, along with inclusive and sustainable growth. Likewise, the strategy of the African development bank is now designed in a regional framework, as expressed in the “AfDB Group Regional Integration Strategy”; in 2012 the bank published a book very much in favour of a North African integration [Santi et al. 2012]; since 2004 it has been associated with the UN Economic commission for Africa in publishing a set of reports on African regional integration. The UNDP and the WTO also see the world in regions. The Institute for the integration of Latin America (Intal) of the Inter-American development bank publishes comparisons with other large world regions. The OECD publishes studies of the various regional integrations. Whereas it had come down against any East Asian financial cooperation during the 1997–1998 financial crisis and advocated for a sole global monetary fund, the IMF now regards the regional issue positively. Its Finance & Development review recognises that “Done right, regional integration helps connect developing countries to world markets” [Deichmann and Gill 2008]. Meaningfully, a rising number of large companies choose a regionalised organisation of their world activities: Americas, Europe (more and more “Europe-Middle East-Africa”), East Asia …


1.1.2 How the Neighbourhoods Issue Is Addressed in International Scientific Literature…
Since the beginning of the 2000s, the regional issue has also been the target of a huge rise in academic publishing. Things began as early as the 1960s when the European Community came into force: the debate among economists dealt mainly with the opportunity this community represented for fulfilling the five stages of any regional integration according to the theory of Balassa [1961]: free trade area, customs union, common market, economic and monetary union.
The main impetus for academic publishing came from the rise of Regional trade agreements (RTAs) worldwide in the 1990s and what Hettne and Soderbaum [2004] called the “new regionalism”. Contrary to the old regionalism that took place in the 1950s and 1960s, this new regionalism is open to new membership and to globalisation, has multidimensional objectives (politics, security, culture but above all economics [Baldwin 1997]), and involves State but also market and civil society actors in many institutional forms. In a recent book, De Lombaerde and Soderbaum [2014] provide a comprehensive analysis of the regionalisation process in the six last decades. However, the territorial issue remains largely overlooked.
1.1.3 … and in the EU Political Framework
For Europe, the territorial approach of regionalisation is a way to ease functional integration with its neighbourhoods (transports, energy…), and its international relations with its neighbours thanks to territorial cooperation—which is often easier than diplomatic relations. Lastly, a territorial approach of regionalisation is a driver to mobilise the rising civil society in the European neighbour countries (ENCs). That is why the EU pays close attention to this neighbourhood issue in its strategic papers. Cooperation with the neighbourhoods has long been a significant matter for the European Union. The rise of regional integration in America (Nafta) and eastern Asia (Asean Plus Three: Japan, South Korea and China), the European need for new markets since the beginning of the financial crisis, the Arab spring and the outburst of the regional crisis in Eastern Ukraine, have made this issue still more relevant. A large set of EU policies draw a favourable context for a renewal of European territorial actions related to neighbour countries:
-
Launched in 2007, the European Neighbourhood Policy (ENP, plus the Strategic partnership with Russia) provides the general framework for cooperation, security and free trade with the neighbourhoods defined as the countries sharing a border with EU.
-
Europe 2020 Strategy advocating smart, inclusive and sustainable growth, gives a role to enlargement and regional integration with neighbouring countries: “The Europe 2020 strategy (…) can also offer considerable potential to candidate countries and our neighbourhood and better help anchor their own reform efforts” [European Commission 2010, p. 23].
-
The Cohesion Policy promotes cross-border and transnational cooperation and macro-regions including neighbouring countries.
-
The Territorial Agenda 2020 states that “cohesion at the external borders is crucial, as disparities and differences in legal, social and political systems have important consequences especially in terms of migration and trade” and that “growing interdependence of regions generates demand for better connectivity” [European Union 2011b, p. 5].
Nevertheless, the tools for a better cooperation with neighbouring territories are to be improved. As the Territorial State and Perspective of the EU states, “the current territorial cooperation system is composed of three loosely co-ordinated blocks: territorial cooperation within the EU, territorial cooperation with neighbouring, candidate and potential candidate countries, and cooperation with other countries” [European Union 2011a p. 24]. This means that a comprehensive vision of this large region that encompasses Europe and the neighbouring countries is lacking. Rather, we have a juxtaposition of status, tools, programmes and visions. Launched by the EU and the Mediterranean partner countries in 1995, the Barcelona process itself is divided into an enormous number of programmes—much closer to an impressionist painting than to a coherent strategy.
In its “Elements for a Common Strategic Framework 2014 to 2020”, the European Commission [2013] paves the way for a better combination of its financial funds for cohesion, social, regional, rural and maritime policies. It maintains the main EU goals related to the neighbourhoods. The European Neighbourhood Instrument (ENI, which replaced the ENPI in January 2014) benefits from a significant increase when compared to the budget of the previous ENPI instrument, with €18.2 billion for the period 2014–2020. Given the potential role of territorial cooperation, it is of utmost importance for the success of EU policies dedicated to the neighbourhoods to begin to fill the gap of territorial knowledge on the two sides of the external European border.
1.2 Assumptions and Key Questions
1.2.1 Two Assumptions: “One Region”, “Greater Opportunities than Threats”
Our first assumption is that the European territory and its neighbourhoods are one “region”. The EU and its neighbours have a number of cooperation agreements on an intergovernmental scale down to the local cross-border local scale. Nevertheless, it has to be said that these agreements are much less effective than the EU’s discourse on the ENP would lead one to expect. Several studies have shown how scattered the action taken by the Commission in the framework of the Barcelona process was for overall very limited financial means—not to mention the almost non-existent neighbourhood strategy of each EU member state.
Our second assumption is that this greater region shows greater opportunities than threats. European neighbourhoods are all too often regarded with a simplified view: great natural resources on the one hand, especially energy; migration pressure and political unrest on the other hand. This atlas depicts a much more nuanced view of both opportunities and threats, at national and at local scale: access to markets, investment scarcity and potential, climate change and water shortage but also opportunities for cooperation, cross-border trafficking control but also cooperation, etc. We acknowledge that the assessment of threats is underrepresented because we do not deal with geopolitics.
1.2.2 Three Objectives
The atlas has three objectives. The first objective is humble: bringing a comprehensive view of the neighbour territories to European stakeholders. It is a preliminary step for any regional view of the greater European region. Otherwise stakeholders would remain in today’s situation: a fragmented representation of the various neighbourhoods, with large loopholes in the knowledge of these strategic territories for Europe, and, all too often, fantasy rather than sound knowledge.
The second objective is assessing the regional integration between the Europe and the neighbour countries, through a territorial analysis. Can we more and more speak of “one greater region”? Do trends show convergence or divergence? Convergence is increasing in the Northern neighbourhood, whereas divergence is increasing in the Southern neighbourhood. In the case of the Western Balkans the dominant trend is convergence rather than divergence, but the results of research show a variety of degrees according to the country considered. The result of the Eastern neighbourhood is highly complex, because Russia has resisted, in the last decade, the reorientation of the Eastern neighbourhood’s economic geography toward Europe that occurred in the 1990s, and recently managed to regain economic, energetic and, thus, political influence upon its CIS neighbours.
The last objective is suggesting policy orientations in order to reduce risks and foster opportunities throughout the regional integration.
1.2.3 What Do We Call “Neighbourhoods”?
The ESPON project “Europe in the world” had proposed a functional regional breakdown of the world thanks to a wide range of economic, cultural and historical indicators. In the European case, it designed a region encompassing Europe and its neighbouring countries. Indeed the precise span of the “European region” varies according to the chosen indicators but as a whole, this geographical figure confirmed that countries surrounding Europe belong to the same large region [Grasland and Didelon 2007]. The issue of the Arabic peninsula and the Persian Gulf which are in the area of influence of several world poles, including Europe, remains unclear.
This atlas is based on the official list of neighbour countries according to the ENP, but with some differences: (i) formally Turkey was, but is no longer, a “neighbour” country since it became a “candidate” country in 2005. The same applies to the candidate countries of the Western Balkans: the Former Yugoslav Republic of Macedonia, Serbia and Montenegro, which are, nevertheless, regarded as “neighbours” in this atlas. (ii) The Caucasian countries (Georgia, Armenia and Azerbaijan) are taken into account but only at a national scale, with no infra-national data and mapping. (iii) The atlas encompasses the Faroe Islands and Greenland as neighbouring countries of the Northern Periphery Programme and the Northern Dimension.
Our choice of considering actual and recent European neighbour countries, should not make us forget that other groupings exist in the area. Not the least of these groupings is the Community of independent states (CIS) which is being reinforced by a Eurasian custom union driven by Russia, which Ukraine recently decided to join under very contentious circumstances, provoking political unrest since the beginning of 2014. In the Mediterranean also, in line with the background of rising South-South trade and investment flows, other alternatives are offered to the Arab countries, on the scale of the Arab Maghreb Union or on the scale of a pan-Arab agreement (Greater Arab free trade agreement, GAFTA). For Europe, there is less motivation given that some neighbour countries have not yet negotiated any Association agreement or Action plan (see Syria, Libya and Belarus on Map 1.2 [Beckouche and Richard 2013]). Turkey considers the Union for the Mediterranean as a diversion of the membership issue, and develops its own sub-regional strategy with the Middle-East and the countries with Turkish-speaking populations of central Asia (a “five seas strategy” from Caspian to Black, Aegean, Mediterranean and Red Seas).
Sticking to a strict definition of the “neighbourhood”, we do not cover the central and eastern parts of Russia nor Europe overseas’ American neighbours. The present neighbourhoods are, therefore:
-
Northern neighbourhood: the Faroe Islands and Greenland (to Denmark), and not Iceland because this country is an ESPON member. The Faroe Islands and Greenland are self-governing overseas administrative divisions of the Kingdom of Denmark, but, unlike Denmark, they are not members of the European Union or ESPON.
-
Eastern neighbourhood: Ukraine, Belarus, Moldova, and Russia (every oblast from the western boundaries to the Ural Mountains which is the conventional limit of European Russia). Georgia, Armenia and Azerbaijan are covered on a national scale.
-
South-Eastern neighbourhood, i.e. Western Balkans: Croatia (because it joined the EU after the beginning of the ITAN project), Bosnia-Herzegovina, Serbia, Montenegro, Kosovo, The Former Yugoslav Republic of Macedonia (Fyrom) and Albania.
-
Southern, i.e. Mediterranean, neighbourhood: Morocco, Algeria, Tunisia, Libya, Egypt, Jordan, the occupied Palestinian territory (oPt), Israel, Lebanon, Syria and Turkey.
Our area covers territories that are politically disputed: Abkhazia (vis-à-vis Georgia); South Ossetia (vis-à-vis Georgia); Transnistria (vis-à-vis the Republic of Moldova); the Golan Heights (between Israel and Syria); the Hala’ib triangle (between Egypt and Sudan). We followed the EU statements to be able to properly display these territories on maps, though there is no statement on the Hala’ib Triangle claimed by Egypt and Sudan. The Western Sahara issue was difficult to address: the UN cartography does not encompass it within the Moroccan national territory—whereas Morocco is certainly the Mediterranean country the most thoroughly involved in the partnership with the EU (Maps 1.1, 1.2 and 1.3).

A proliferation of sub-regional organisations in the greater European region

Contractual relations between the EU and the neighbour countries

The atlas’ four neighbourhoods
1.3 Methodological Challenges in Unstable Territories
1.3.1 The Difficult Geometries Issue
As the goal is to create an integrated geography EU + neighbourhoods, we have set up “similar to NUTS” geometries throughout all the neighbourhoods, that is to say territorial delineation stemming from administrative local divisions (oblast in Russia, governorates or provinces in many Arab countries, etc.) and comparable to the European NUTS (Nomenclature of Territorial Units for Statistics, that is to say the official subdivisions of EU countries for statistical purposes). As a first step, our targeted scale is the equivalent of European NUTS 2 or 3 (Regions, Départements, Länder…). That means that we could not reduce the scale, thus we could not address the urban issue, since it would have required data collection on a very local scale.
Another shortcoming is that several neighbour countries have recently experienced major unrest and even wars such as the Lebanon civil war (1975–1990), the two Intifadas (1987 and 2000, the current situation being close to a permanent guerrilla conflict between Israel and the Palestinians), the breaking up of the former USSR in 1991. Various unrests followed the latter: in Transnistria (1992 war), Chechnya (wars from 1994 to 2000, maybe 200,000 deaths), Georgia (armed conflict in August 2008 with Russia and the separatist South Ossetia and Abkhazia), Ukraine (on-going crisis which started after the unsuccessful Eastern Partnership Summit of November 2013). The former Yugoslavian wars lasted from 1991 to 2001, and caused between 200,000 and 300,000 deaths and one million displaced people.
Since January 2011 the Arab spring has affected all the Mediterranean neighbours, in particular:
-
Tunisia, where it first broke out, and Egypt where the revolution caused at least 500 deaths and where a civil war is not at stake but is not completely impossible.
-
Libya where the civil war, from February to October 2011, caused around 30,000 deaths and provoked the outmigration of hundreds of thousands, maybe millions, into the neighbouring countries Egypt and Tunisia in particular. Libya now faces a dramatic period that recalls the violence of its history, including during the Italian Fascist occupation. Since the 2011 war, Libyan society is still characterised by reversibility: everything is done and undone; everything is built and then falls into ruin. Everything reflects the Bedouin tent: quickly installed for a short moment in a space that never becomes a place. Nevertheless, we managed to collect some local Libyan data, all the more valuable in that we have demographic data from before and after the war, which provides interesting insights into the territorial impact of the war.
-
Syria, where the civil war has been on-going since March 2011. In this atlas, the analysis of the Syrian territory is based on data and information obtained recently pertaining to the period prior to the civil war. The crisis that has overwhelmed the country since 2011 has seen 4 million Syrians flee to the neighbouring states of Iraq (0.2 million), Turkey (1.6 million), Lebanon (1.5) and Jordan (0.9), and more than 6 million within Syria in search of a safe refuge. As the Arab Reform Initiative states,Footnote 1 the conflict has not only caused many casualties (perhaps 300,000 to date), but also disrupted health systems that are essential for the nation’s future, with childhood diseases such as polio resurfacing, a number of hospitals being turned into refugee shelters, and destroyed the economy down. The country is torn apart for decades.
Notwithstanding wars, many countries of the European neighbourhoods have experienced huge changes in their territorial geometries over the last decades and sometimes the last century. The attempt to delineate territories similar to Europe’s is all the more challenging in that several neighbour countries do not benefit from a steady territorial division.
There are many examples of the difficulty of setting up good time series due to these delineation changes. In Moldova, the number of rayons (departments) has varied between 60 and 18 during the Soviet period; at the time of independence there were 40 rayons, then during the first years of independence three administrative-territorial reforms took place. Approaching European standards, Moldova returned to the pre-Soviet administrative-territorial structure of 12 counties in 1998; but in 2003 the country returned to the departmental administrative system! Moreover, one of the two main regions of the country, Transnistria, is a breakaway state located on a strip of land between the River Dniester and the eastern Moldovan border with Ukraine. Since its declaration of independence in 1990, and especially after the War of Transnistria in 1992, it has been governed as the Pridnestrovian Moldavian Republic (PMR), a state with limited recognition. Because of the Russian military contingent there, the European Court of Human Rights considers Transnistria “under the effective authority or at least decisive influence of Russia”. The territory’s political status remains unresolved: it is an unrecognized, but independent, presidential republic with its own government, parliament, military, police, postal system, and currency. Countless geometry changes of this kind exist in the European neighbourhoods.
When it became independent, in 1963, Algeria had to drastically reduce the number of communes (from 1577 to 676) to tackle the lack of competent managers once the Europeans left. This skill shortage has to be kept in mind when trying to understand why the South Mediterranean countries are so centralised; this is, of course, only one of a number of explanations but, for instance, in the case of Tunisia the choice of centralised public national bodies and delivery for water supply or electricity was partly due to the need to concentrate the few competent managers left in the country at the end of the French protectorate. Indeed, poor national governance also explains geometry changes: for instance, continuous changes have occurred in Libya, during the colonial era, under Kadhafi’s rule and since the 2011 war.
Likewise, Moroccan territorial reform in the 2000s introduced new provinces. Due to the quality of Moroccan local data, it could be partially possible to rebuild the data corresponding to the limits of former provinces by aggregating municipal data. This demonstrates the importance of on-the-ground work to fully understand the nature of the delineation changes, even when official names and territories’ codes remain unchanged!
Lebanon is another case. In 2003, its parliament approved the establishing of two new governorates by splitting the governorates of the North into two, and that of Beqaa into two as well. The corresponding application decrees were never developed and the political will to implement the administrative division is lacking. But one fears that further research will have to cope with this coming geometry change.
The number and boundaries of Turkish provinces and districts have undergone radical changes. The number of districts increased from 636 in 1960 to 957 in 2011. These changes do not seem to follow a clear pattern, and it is barely possible to track the changes. TurkStat has not published any data to allow comparisons with previous borders.
In the former Yugoslavia, the territory, its delimitation and settlements have been largely modified during the wars. From 1991 (secession of Slovenia from the federation) to 2001 and even 2008, these territories went through combats, ethnic cleansing, massive migration, finally the multiplication of new republics replacing the former confederation with in-depth internal territorial reorganisation. For instance in Bosnia and Herzegovina, after 1995, the territorial structure was reformed according to the “Inter-Entity Boundary Line” with no continuity with the previous situation, assigning municipalities or part of municipalities to one of the two entities (Federation of Bosnia and Herzegovina on the one hand and Republika Srpska on the other) in accordance with their “ethnic” composition. As a result, drawing any steady delineation was a complex process. For the first time, and thanks to the help of the M4D consortium,Footnote 2 this atlas displays a coherent new nomenclature for all the neighbour countries except for Croatia, the Fyrom, Montenegro and Turkey which were granted official NUTS divisions as candidate countries to the EU.
1.3.2 The Local Data Issue: Scarcely Available, Reliable and Comparable
Problems are common to all the fields of data: access to data, change in quality of data, data reliability in particular the expected issue of informal activity, sources’ reliability, etc.
The main problem of data reliability lies in the informal issue. The huge scale of informal activity, income and employment is a major characteristic of the neighbourhoods’ economy and thus statistics. It ranges from 20 to 50 % in the non-agricultural sectors in Arab countries [Aita 2011]. In Egypt one can estimate that informal economy accounts for 40 % of the economy; informal jobs have enormously increased during the liberal 2000s decade. In Morocco, the informal economy employs 30 % of the workforce. In Jordan the figure is about 20 % for jobs and over 20 % for the economy. Before the uprising in Syria broke out, 25 % of the workforce was unregulated. The figures are similar in the Western Balkans. Over the 1990s, the ratio of the informal economy to registered GDP in the Federal Republic of Yugoslavia was approximately one-third. Before they split into two countries, the size of the shadow economy in Serbia and Montenegro was estimated at more than one third of the GDP [Krstić and Sanfey 2010].
According to the estimate of the Russian federal state statistics service (Goskomstat), the share of the informal economy of total GDP increased from 13 % in 1993 to 23 % in 1996 and 25 % in 2000s. However, Goskomstat’s method has been strongly criticized by national and international experts; their estimation is that during the transition, the informal economy reached 23 % when the USSR collapsed, 42 % in 1995 and almost 50 % in the first half of the 2000 decade. One half of the Russian population is employed informally as a part or the entirety of their activity. In Ukraine, the share of employment in informal activity outside of agriculture in the mid-2000s was 17 %, but at the largest account, that is, including individuals involved in agricultural production on a secondary basis or for their own use, the figure was 66 % [Commander et al. 2013]. It seems that informal activity accounted for around 16 % of the Ukrainian GDP in 1990, rising to 47 % in the mid-1990s and over 50 % in the mid-2000s. Formerly, it has been estimated that the informal economy accounted for between 35 and 44 % of GDP in the countries of the former Soviet Union. In this matter, things do not seem to have really changed since then.
Another shortcoming of the neighbour countries’ statistics system is that the national body in charge is often recently-created—the Palestinian Central Bureau of Statistics was created in 1994. These bodies follow international prescriptions in terms of statistical definition and methods, but to varying degrees and since different years. Definitions of categories remain different from one country to another and even when they are alike, the available data on the local scale varies. As an example, incomes are documented in a large number of ways: in the Near East we could only find net incomes in Israel, daily wages in the occupied Palestinian territory, and households’ income in Jordan. In order to make comparable series and maps, we harmonised data by keeping the regional distribution of the data provided for a given country, and applying it to the national value found in the same international database selected to apply to all neighbour countries—Gross National Income from World Bank data in that case. We acknowledge that the final result is an approximation, but such approximation allows comparison.
Given the challenge of the heterogeneity of the collected data, our composite indicators are a major asset of this territorial integrated analysis of the neighbourhoods. The atlas set up four composite indicators:
-
“Local Human Development Index” taking into account income, life expectancy and education, in order to analyse local social disparities
-
“Territorial dynamism” through the demographic evolution and the economic evolution in the 2000s (which, by the way, means that we also had to make time series harmonisation so as to be able to have data for 2000 and 2010 for all countries)
-
“International openness index” based on data on international ports, international airports and presence of Foreign Direct Investment (FDI) on a local scale, so as to address the question of regional international integration
-
“Territorial potential index” based on tertiary education, transport accessibility and international openness.
1.3.3 The Climax of Geometries and Data Complexity: The Israel-Palestine Puzzle
Nowhere in the neighbourhoods are these contested territories, data and mapping more complex than in Palestine and Israel. This conflicting history has directly impacted not only the size of “Palestine” but also its internal territorial organisation and data production. Between 1948 and 1967, the West Bank (800,000 inhabitants) was under the Jordanian administration and divided into 3 districts, the Gaza Strip (300,000 inhabitants) was under the Egyptian administration and included 5 territorial entities. Under Israeli administration between 1967 and 1994, the West Bank was divided into 8 governorates, and the Gaza Strip into 5 governorates. Since 1994, according to the Palestinian Authority administration, the Occupied Palestinian territory (OPT) has consisted of two physically separated land masses, the West Bank (5660 km2, 2.6 million inhabitants in 2011, 11 governorates including East Jerusalem) and the Gaza Strip (360 km2, 1.6 million, 5 governorates).
The conflicted complexity of these recurrent territorial changes is increased by settlements developed under the on-going Israeli occupation: upon the Israeli withdrawal from the heart of the Gaza Strip in 2005, the main urban areas of Gaza constitute a single territorial unit, with the exception of an unpopulated security buffer zone along the northern and eastern borders of Gaza that remains under Israeli control. But in the West Bank, Israel’s aim has been to control as much land as possible, and this aim was marked, in 1991, by a master plan for every single settlement. In the past two decades the Israeli settlements’ built-up areas have increased from 69 km2 in 1990 (240,000 settlers) to 189 km2 in 2011 (179 settlements, 628,000 settlersFootnote 3 whereas the Israeli Central Bureau of Statistics says “531,000” people including East Jerusalem). 84 % of the Palestinian West Bank population live in Areas A and B, whilst Area C, over which Israel has full control, constitutes 61 % of the total West Bank but is scarcely populated with Palestinians because of the long term restrictions imposed on any kind of Palestinian development. In the West Bank as a whole, in addition to the 72 checkpoints, 26 partial checkpoints, 94 road blocks, 163 earth mounds, 121 road/iron gates, 71 watchtowers and 113 agricultural gates, Israel initiated, in 2002, its “defensive wall”. Once completed, the wall will isolate 66 Palestinian localities (320,000 people including 274,000 in Jerusalem), totalling 733 km2 i.e. 13 % of the total area of the West Bank.
When it comes to the data issue, the most valuable data on population come from the census taken by the British in 1931. The quality of Mandate statistics declined after the 1931 census. Civil unrest, followed by World War II, made it impossible for the British to take another census. After 1948, during the Israeli occupation, the statistical situation deteriorated even further in the West Bank and Gaza Strip. In this atlas, directly derived from the ARIJ work, occupied Palestinian territory data for the years 1950–1990 are taken from the Palestine remembered website,Footnote 4 a non-profit organisation that gathers data from this variety of statistical sources. The task is all the more difficult in that Israel did not transfer the data to the Palestinian Authority covering the years 1948–1994. Despite serious efforts been made by different governmental and non-governmental institutions to generate demography data for that period, data for the years 1991 and 1993 remains unavailable, because of the unrest of the first Intifada which occurred since 1987 until the Oslo Agreements of 1993. When the Palestinian Authority took over the administration in 1994, it established the Palestinian Central Bureau of Statistics (PCBS); data for the years 1994–1996 are preliminary estimates published by the PCBS; the first census taken by the Bureau was conducted in 1997, and the second in 2007, with reasonable reliability.
Let us now consider these data matters from the Israeli side. The occupation, annexation of East Jerusalem and Golan Heights, and the settlement movement emanating from the 1967 war have influenced the complex way Israel counts its own population. The 1949 borders of Israel, known more commonly as the pre-1967 borders, or the “Green Line,” were in effect for only 18 years, until 1967 when Israel unilaterally occupied the West Bank, the Golan Heights, the Sinai Peninsula and the Gaza Strip. At the end of 2012, about 531,000 Israeli Jewish settlers lived in the occupied West Bank (including an estimated 190,000 in East Jerusalem); an additional 19,000 settlers reside in the annexed Golan Heights. Israel considers its population to include all those residing within the 1967 borders, plus all those residing in Jewish settlements in the West Bank, as well as all those (both Jews and Palestinian-Arabs) residing in annexed East Jerusalem and the Golan Heights. By contrast, the international community does not consider the occupied West Bank and the Golan Heights to be part of Israel, nor does it recognise the annexation of East Jerusalem or consider the settler population in the occupied Palestinian territory to be part of Israel. However, specific statistical analyses made it possible for ITAN to compare the settler population in the West Bank (not including those in East Jerusalem) to the population in Israel’s other six districts, something which had not been done by previous research.
Note that many Israeli maps, notably those available at schools and other state institutions, do not show the 1967 borders (Green Line) between Israel and the West Bank and the Golan Heights.
Notes
- 1.
- 2.
- 3.
Source: ARIJ GIS Department 2011.
- 4.
References
Aita, S. 2011. Les travailleurs arabes hors-la-loi: emploi et droit du travail dans les pays arabes de la Méditerranée: vision des enjeux et implications du partenariat européen: Algérie, Egypte, Jordanie, Liban, Maroc, Palestine, Syrie, Tunisie, 2011, p. 276. Paris: Editions L’Harmattan.
Balassa, B. 1961. The Theory of Economic Integration. IL: R.D. Irwin.
Baldwin, R. 1997. The causes of regionalism. The World Economy 20–7: 865–888.
Beckouche, P., and Y. Richard. 2013. Atlas de la grande Europe: économie, culture, politique, Paris: Autrement.
Beeson, M., and F. Li. 2012. Charmed or alarmed? reading China’s regional relations. Journal of Contemporary China 21(73): 35–51. Special Issue: The Rise of China and the Regional Responses in the Asia-Pacific.
De Lombaerde, P., and F. Soderbaum. 2014. Regionalism. Thousand Oaks: Sage publications Ltd.
Deblock, Ch., and H. Regnault. 2006. Nord-Sud: La Reconnexion Périphérique. Montréal: Editions Athéna.
Deichmann, U., and Indermit, G. 2008. The economic geography of regional integration. In: Finance & Development. Washington: IMF.
European Commission. 2013. Elements for a common strategic framework 2014 to 2020, the European Regional Development Fund, the European Social Fund, the Cohesion Fund, the European Agricultural Fund for Rural Development and the European Maritime and Fisheries Fund, 14.3.2012, SWD(2012) 61, final, Brussels.
European Commission. 2010. Europe 2020, a strategy for smart, sustainable and inclusive growth. Communication of the EC, 3.3.2010, COM(2010) 2020 final, Brussels.
European Union. 2011a. The territorial state and perspectives of the European Union, background document for the territorial agenda of the European Union 2020. Presented at the Informal meeting of Ministers Responsible for Spatial Planning and Territorial Development, on 19th May 2011 Gödöllő, Hungary.
European Union. 2011b. Territorial agenda of the EU 2020, towards an inclusive, smart and sustainable Europe of diverse regions.
Grasland, C., and C. Didelon. 2007. Europe in the World. ESPON Project 3.4.1, Luxembourg. Available at: http://www.espon.eu/main/Menu_Projects/Menu_ESPON2006Projects/Menu_CoordinatingCrossThematicProjects/europeintheworld.html.
Hettne, B., and F. Soderbaum. 2004. Regional cooperation. A tool for addressing regional and global challenges (Chap. 5). In International Task Force on Global Public Goods, 179–244. Available at: http://www.cris.unu.edu/uploads/media/GlobalTaskForce.pdf.
Krstić, G., and P. Sanfey. 2010. Earnings inequality and the informal economy: evidence from Serbia. Working Paper 114, EBRD.
Mashayekhi, M., and T. Ito (eds.). 2005. Multilateralism and regionalism. The New Interface, report of the 11th Unctad Conference, June 2004, Sao Paulo, Geneva. Available at: http://unctad.org/en/docs/ditctncd20047_en.pdf.
Santi, E., S. Ben Romdhane, and W. Shaw. 2012. Unlocking North Africa’s Potential Through Regional Integration. Abidjan: African Development Bank Group.
Author information
Authors and Affiliations
Corresponding author
Editor information
Editors and Affiliations
Rights and permissions
Open Access This chapter is distributed under the terms of the Creative Commons Attribution-Noncommercial 2.5 License (http://creativecommons.org/licenses/by-nc/2.5/) which permits any noncommercial use, distribution, and reproduction in any medium, provided the original author(s) and source are credited. The images or other third party material in this chapter are included in the work’s Creative Commons license, unless indicated otherwise in the credit line; if such material is not included in the work’s Creative Commons license and the respective action is not permitted by statutory regulation, users will need to obtain permission from the license holder to duplicate, adapt or reproduce the material.
Copyright information
© 2016 The Author(s)
About this chapter
Cite this chapter
Beckouche, P. (2016). Political Context, Conceptual Framework. In: Beckouche, P., Besnard, P., Pecout, H. (eds) Atlas of Challenges and Opportunities in European Neighbourhoods. Springer, Cham. https://doi.org/10.1007/978-3-319-28521-4_1
Download citation
DOI: https://doi.org/10.1007/978-3-319-28521-4_1
Published:
Publisher Name: Springer, Cham
Print ISBN: 978-3-319-28520-7
Online ISBN: 978-3-319-28521-4
eBook Packages: Social SciencesSocial Sciences (R0)