
Abstract
Contrast-enhanced multi-phasic MDCT is the most important liver imaging technique in many institutions, when a focal lesion is suspected at ultrasound. Lesion characterization is based on size, shape, contour, and assessment of contrast enhancement pattern. If a lesion shows peripheral and nodular enhancement, with the density of enhancing portions similar to the vascular pool, a hemangioma can be confidently diagnosed. There are many different arterial-phase hypervascular lesions, include FNH, adenoma, HCC, and metastases from NET, melanoma, renal cell carcinoma, sarcoma, and breast cancer. Lesion characterization in general, HCC is considered in a setting of cirrhosis or chronic liver disease.
An MR examination of the liver routinely includes unenhanced T1-weighted GRE DIXON, T2-weighted TSE fatsat, and diffusion-weighted imaging (DWI) as well as dynamic contrast-enhanced pulse sequences. DWI’s main clinical benefit is the detection of focal liver lesions, which may be missed on conventional and contrast-enhanced imaging sequences. Liver-specific MR contrast agents have been shown to increase the detection of liver metastases, improve the characterization of FNH and adenoma, as well as the characterization of equivocal lesions in cirrhosis.
You have full access to this open access chapter, Download chapter PDF
Keywords
- Liver
- HCC
- LI-RADS
- Metastasis
- Cholangiocellular carcinoma (=CCC)
- Hemangioma
- Focal nodular hyperplasia (=FNH)
- Adenoma
- Computed tomography
- Magnetic resonance imaging
-
To learn about the imaging protocol in MDCT and MRI for detection and characterization of focal liver lesions.
-
To learn the typical and atypical imaging features of benign and malignant focal lesions.
-
To understand the importance of knowledge about chronic liver disease because the presence of chronic liver disease alters the differential diagnosis and the diagnostic approach.
7.1 Introduction
Multidetector computed tomography (MDCT) and magnetic resonance (MR) imaging provide non-invasive insights into liver anatomy and the pathophysiology of liver diseases, which allows for better diagnosis of focal liver lesions, monitoring of disease evolution and treatment response, as well as for guiding treatment decisions. Understanding the application of different imaging techniques is critical for the management of focal liver lesions. In the current climate of challenging health economics, the most appropriate and cost-effective modality should be utilized. For liver imaging, ultrasonography (US) is widely available, non-invasive, and is often used in the community for disease screening but has unfortunately limited diagnostic sensitivity and specificity. Contrast-enhanced MDCT remains the modality of choice for routine liver imaging. MR imaging is still used largely as a problem-solving tool, when MDCT or US are equivocal or if there is concern for malignancy in high-risk populations.
In this chapter, we will highlight imaging of focal liver lesions, focusing on the use of MDCT and MR imaging for disease detection and characterization. The reader should learn how to optimize CT and MR imaging in his/her own practice, understand how to apply and interpret CT and MR imaging for the management of focal liver lesions and appreciate the expanding role of liver-specific MR contrast agents for lesion characterization.
7.2 MDCT Imaging Techniques
Advantages of MDCT imaging in clinical practice are very rapid scan acquisition, which avoids motion artifacts, and the capability of multi-planar imaging. Using a state-of-the-art MDCT system, the entire liver can be scanned within 1-3 s using a sub-millimeter detector configuration allowing for high-quality 3D-reconstructions [1]. When viewed axially, reconstructed sections of 2.5–3 mm thickness with an overlap of 0.5–1 mm are usually used in clinical practice. Thinner slices do not improve lesion conspicuity because of increased image noise [2, 3] that can decrease diagnostic specificity [3]. The amount of contrast material administered should be adapted according to the patient’s weight, with 0.5 g iodine/kg b.w. being a typical dosage (i.e., 1.7 mL/kg b.w. at 300 mg iodine/mL). The total amount of iodine administered determines the quality of the portal venous imaging phase, with the aim of increasing the liver attenuation by 50 HU after contrast injection [4]. To achieve good arterial-phase imaging, a relatively high contrast medium injection rate of 4–5 mL/s is recommended [5]. However, the weight-based adaptation of contrast media dosage should also go hand in hand with an adaptation of the contrast media injection rate. Accordingly, studies using a fixed injection duration of 30 s (meaning that the injection rate will differ according to patient’s weight) have shown that this approach provides consistent image quality.
The timing of the image acquisition in relation to contrast media administration depends on whether imaging is required during early arterial phase (for arterial anatomy only), late arterial phase (for hypervascular tumor detection and characterization), or venous phase (for follow-up imaging and hypovascular tumor detection). For the detection and characterization of focal liver lesions, late arterial-phase imaging (scan delay of aortic transit time plus 15–18 s) [6, 7], and a venous phase scan (20–30 s interscan delay or with fixed delay of app. 60–70 s) are performed. In patients with chronic liver disease, a delayed phase (at app. 3 min post contrast) for better lesion characterization is recommended.
Automated methods of measuring arterial enhancement (aortic transit time) on CT, often termed bolus tracking, has largely replaced the use of fixed scan-delay times because it provides better coincidence of scanning with peak enhancement of liver tumors (in the late arterial phase) and the liver parenchyma (in the venous phase).
Different techniques for dose reduction and optimization of image quality are now widely in use: automatic exposure control by tube current (mA) modulation, selection of lower tube potential (kVp), and adaptive dose shielding to minimize overscanning in the z-axis, to name a few. Conventional filtered back projection (FBP), the standard CT image reconstruction technique for many years, has given way to iterative reconstruction (IR) techniques. IR allows for dose reduction by reconstruction low-noise image data from intrinsically noisy reduced-dose CT acquisitions, preserving imaging quality [8]. IR techniques can be either hybrid or model-based, with the latter being more advance, allowing for stronger dose reduction at the cost of slower images reconstruction. All major manufacturers now provide iterative reconstruction techniques (SAFIRE (hybrid], ADMIRE [model-based], Siemens; iDose [hybrid], IMR [model-based], Philips; ASIR [hybrid], MBIR [model-based], GE Healthcare; AIDR 3D [hybrid], FIRST [model-based], Canon [8]. Stepwise IR reduces CT noise levels. However, (too) high levels of IR may produce an unfamiliar image texture that may render image quality unacceptable [9]. A substantial dose reduction of 38–55% is possible with IR without compromising image quality [10,11,12]. In recent years, dual energy and spectral CT technique has emerged, where different vendors use different concepts. Utilization of dual source or a split-beam (Siemens), kV-switching during scanning (GE healthcare, Canon) and the use of dual-layer CT detectors (Philips) provide the differential attenuation of X-ray beams of different kV when scanning different tissues. In clinical practice, spectral CT has found several applications in oncologic imaging: in the liver, it improves the detection of hypervascular hepatocellular carcinomas [13] or allows quantification of hepatic iron content [14]. More recently, the advent of photon-counting CT promises even further improvement in the spatial and contrast resolution of CT images. Photo-counting CT detectors can directly convert detected X-rays into electrical signal for image reconstruction, making it possible to use smaller detectors to improve spatial resolution and producing images at different keVs to improve contrast resolution (Fig. 7.1).

A woman with pancreatic carcinoma evaluated using photon-counting CT in the upper abdomen. Images reconstructed at tube voltages of (a) 60 keV and (b) 40 keV. Both the primary tumor (arrowhead) and the liver metastasis (arrow) appear more conspicuous on the lower 40 keV image. The use of photon-counting CT can improve image spatial and contrast resolution of disease. [Images courtesy of Dr. Nikolaos Kartalis, Karolinska Institute, Sweden]
Key Points
-
For detection and characterization of focal lesions at least a bi-phasic contrast-enhanced protocol is necessary, in patients with chronic liver disease (cirrhosis, chronic hepatitis B infection) a triple-phasic enhanced protocol is recommended.
-
Iterative reconstruction techniques are standard to reduce image noise and, thus, to reduce radiation dose.
-
Spectral CT is achieved by various technologies (dual source, rapid kV switching, dual layer detector) by different vendors. It may be particularly of help in oncologic imaging.
7.3 MR Imaging Technique
MR imaging of the liver can be performed at both 1.5 T and 3.0 T, the latter providing improved image quality due to increased signal-to-noise ratio. MR examination of the liver should include unenhanced T1-weighted and T2-weighted sequences, diffusion-weighted imaging as well as contrast-enhanced sequences. Specific acquisition sequences vary by manufacturer, patient compliance, and the clinical question being addressed.
T1-weighted MRI should be performed using a 3D DIXON technique, which can generate in-phase, opposed-phase (syn.: out-of-phase), water-only and fat-only images of the whole liver volume in a single breath-hold acquisition. In- and opposed-phase T1-weighted imaging is used for characterization of fat-containing tumors (e.g., adenoma, HCC) and the presence of steatosis. The resultant water-only images have been shown to improve the uniformity of fat-suppression at 3 T, compared with conventional spectral fat-suppression technique [15]. The use of the DIXON images for dynamic contrast-enhanced acquisition has also been shown to improve the detection of HCC compared with standard fat-suppressed sequences.
Another useful recent implementation is non-cartesian radial T1-weighted imaging, which allows 3D volume T1-weighted imaging of the liver to be performed in free breathing. This allows good quality T1-weighted GRE of the liver to be obtained in patients with poor breath holding (e.g., elderly patients in poor general condition or young children) (Fig. 7.2), especially during dynamic contrast-enhanced acquisitions [16]. T2-weighted pulse sequences with fat-suppression provide better lesion contrast than non-fat-suppressed sequences and are also widely used.

Radial acquisition technique. Portal venous phase T1-weighted MRI in a child presenting with a liver metastasis from a rhabdomyosarcoma. In children and adults who are unable to breath-hold, the radial acquisition technique performed in free-breathing can overcome the effects of respiratory motion
Diffusion-weighted imaging (DWI) is standard in liver imaging, and it is now available on all scanners. In general, DWI depends upon the microscopic mobility of water, called Brownian motion, in tissue. Water-molecule diffusion (and thus the measured signal intensity) depends on tissue cellularity, tissue organization, integrity of cellular membranes, and extracellular space tortuosity. Usually, lower water diffusion is found in most solid tumors, which is attributed to their high cellularity [17]. Thus, DWI is helpful for detecting liver solid focal liver lesions [18,19,20]. By performing diffusion-weighted imaging using two or more b-values, we can quantify the apparent diffusion coefficient (ADC) of liver tissues. Benign focal liver lesions have been shown to have higher ADC value than malignant liver lesions although there is significant overlap [20]. Nonetheless, quantitative ADC values may be useful to support lesion characterization and for identifying early tumor response to treatment.
Imaging after the administration of intravenous contrast agents remain the cornerstone for liver MR imaging. Of these, nonspecific extracellular gadolinium contrast medium is still most widely used. Following the intravenous (IV) bolus injection of an extracellular gadolinium-based contrast agents, dynamic imaging (using volumetric T1-weighted GRE) is performed for lesion characterization, lesion detection, evaluating tumor response to systemic therapy and detecting recurrence after locoregional therapy.
Liver-specific (or hepatobiliary) MR contrast agents are available and have specific roles in the management of focal liver lesions. These include gadobenate dimeglumine (MultiHance®, Bracco) and gadoxetic acid (Primovist® or Eovist®, Bayer Healthcare). Liver-specific MR contrast agents are also usually administered IV as a bolus, as with nonspecific gadolinium chelates for dynamic imaging. However, imaging is also performed at a delayed liver-specific or hepatobiliary phase, the timing of this differs according to the contrast agent. These liver-specific agents are taken up into hepatocytes to varying extent (gadobenate dimeglumine 4–5%; gadoxetic acid ~50%), resulting in avid T1 enhancement of the liver parenchyma in the hepatobiliary phase, which is performed at 20 min for gadoxetic acid and about 1–2 h for gadobenate dimeglumine after contrast administration. Liver-specific contrast agents have been shown to improve the detection of liver metastases [21,22,23,24], especially when used in combination with diffusion-weighted MR imaging.
Key Points
-
Standard MRI protocol should include at least T1-weighted GRE DIXON, T2-weighted TSE (with or without fatsat), DWI, and dynamic post-contrast T1-weighted sequences.
-
Liver-specific contrast agents are recommended for detection of potentially resectable colorectal cancer liver metastases.
-
Liver-specific contrast agents are helpful for characterization of hepatocellular lesions.
7.4 Benign Hepatic Lesions
7.4.1 Cysts
Simple hepatic cysts are common, occurring in 5–14% of the general population. As they are usually asymptomatic, they are detected incidentally on US, CT, or MR imaging. On CT, hepatic cysts are well circumscribed and typically show attenuation values similar to water (0–15HU) although smaller cysts may show higher attenuation values due to partial volume effects. Cysts should not show mural thickening, nodularity, or contrast enhancement. Small cysts (≤3 mm in size) may pose a diagnostic challenge in the cancer patient on CT as they are too small to be fully characterized and stability on follow-up imaging is important to reassure. Nonetheless, the vast majority (>90%) of small hypodense liver lesions even in the oncology patient are benign. On MR imaging examinations, cysts are well-defined, homogeneous lesions that appear hypointense on T1-weighted images (unless hemorrhagic) and markedly hyperintense on T2-weighted images. Their marked hyperintensity on T2-weighted imaging (in comparison to solid lesions) provides greater confidence towards the diagnosis of small cysts on MRI.
7.4.2 Hemangioma
Hemangioma is the most common benign liver tumor. On US, liver hemangioma appears circumscribed, well-defined, and hyperechoic. Small hemangiomas usually appear homogeneous but larger hemangiomas (>4 cm) can show a heterogeneous appearance.
On CT, hemangiomas are well-defined hypodense masses. They are hypointense on T1-weighted and markedly hyperintense on T2-weighted imaging, sometimes with a lobular contour. Hyperintensity on T2-weighted MRI (especially on single-shot T2 TSE) helps to differentiate hemangiomas from other solid neoplasms [25, 26]. At a relatively long T2 echo time (140 ms or longer), a homogeneously bright lesion is characteristic of a benign lesion, such as a cyst or hemangioma. Exceptions (that can be quite bright on heavily T2-weighted sequences) include cystic or mucinous metastases, gastrointestinal stromal tumor (GIST), and neuroendocrine tumor metastases.
Hemangiomas show three distinctive patterns of enhancement at CT/MRI (Type I to III) [27]. Characteristically, there is enhancement that closely follows the enhancement of blood pool elsewhere [28]. Small lesions (up to ~2 cm) may show immediate and complete enhancement in the arterial phase, with sustained enhancement in the venous and delayed phases (type I, “flash filling” hemangioma) [29] (Fig. 7.3). On delayed imaging, the enhancement usually fades to a similar extent as the blood pool. The most common enhancement pattern is peripheral nodular discontinuous enhancement, with progressive fill-in over time (type II). Larger lesions (>5 cm) or lesions with central thrombosis/fibrosis may lack central fill-in (type III) (Fig. 7.4). Dynamic extracellular gadolinium chelate-enhanced MRI is superior to contrast-enhanced CT for characterization of small and slow-flow hemangioma, which start to show typical enhancement only in the delayed phase. When evaluated using liver-specific contrast agents, the appearance of hemangiomas in the dynamic arterial and venous phases is similar to that with extracellular gadolinium chelates. However, in the delayed phase (at 3 min post contrast), there may be “pseudowashout” (hypointensity) due to early hepatocellular enhancement of liver parenchyma (Fig. 7.5). In the hepatobiliary phase, hemangiomas may appear hypointense to the parenchyma, thus mimicking liver metastases. In this instance, DWI may help to differentiate between hemangioma and other solid lesions, as the apparent diffusion coefficient (ADC) of uncomplicated hemangiomas is significantly higher (typically >1.70 × 10⁻³ s/mm2) than in malignant solid lesions [30, 31].


Hemangioma type 1 with liver-specific MR contrast agent. A 45-year-old woman with incident lesion (arrows) in right lobe of liver. This appears (a) as high signal intensity on T2-weighted imaging, (b) as low signal intensity on T1-weighted imaging and (c–e) shows uniform enhancement on dynamic T1-weighted contrast-enhanced imaging, isointense to the arterial signal at all phases. The lesion appears (f) hypointense in the hepatobiliary phase of gadoxetic acid-enhanced MRI

Liver hemangioma with type 3 enhancement using extracellular gadolinium chelate. (a) Fat-suppressed T2-weighted image shows a high signal intensity lesion in the posterior right lobe typical for a hemangioma (arrow). Fat-suppressed contrast-enhanced T1-weighted image in the (b) arterial and (c) delayed phases of contrast enhancement, show initial nodular peripheral enhancement with progressive centripetal filling (arrows)

Hemangioma type 3: liver-specific MR contrast agent. (a) T2-weighted TSE shows a large lobulated lesion of very high signal intensity. (b–d) Dynamic gadoxetic acid-enhanced imaging shows peripheral nodular enhancement in the arterial (b) and venous phases (c). In the hepatobiliary phase (d) there is hypointensity of the lesion due to lack of hepatocellular uptake in the lesion and marked enhancement of surrounding liver parenchyma. Please note there is some enhancement of the lesion because of vascular/extracellular pooling of contrast
7.4.3 Focal Nodular Hyperplasia (FNH)
FNH is the second most common benign tumor, usually found in young women. It is a non-neoplastic lesion that can cause confusion when it is incidentally detected during imaging. At US the lesion is usually isoechoic or slightly hypoechoic [32] to liver, but it may appear hypoechoic in patients with diffuse hepatic steatosis. Typically, FNH demonstrates a lobular contour, which is quite uncommon in malignant lesions. A central scar is present in about 67% of larger lesions, and about 33% of smaller lesions [33]. The central scar in FNH is usually hyperintense on T2-weighted images, with a comma-shaped or spoke-wheel appearance. This scar can be differentiated from fibrolamellar HCC, where a central scar is predominantly of low signal intensity on T2-weighted MRI due to fibrosis. Color/power Doppler US may show blood flow within the scar [34].
FNH is isodense or minimally hypodense on unenhanced and equilibrium-phase post-contrast CT and may be only suspected because of the presence of mass effect on adjacent vessels. On unenhanced T1- and T2-weighted MR images, FNH return signal intensity similar to hepatic parenchyma, but is usually slightly different on either T1-weighted or T2-weighted images. Due to the prominent arterial vascular supply, FNH demonstrates marked homogenous enhancement during the arterial phase of contrast-enhanced CT/MR imaging, which becomes rapidly isodense/isointense to liver parenchyma in the portal venous phase [33]. The comma-shaped or spoke-wheel central scar often showed delayed enhancement (Fig. 7.6) because of its vascular component [32]. Another key feature is that the scar in FNH is usually T2-weighted hyperintense in appearance compared with the heterogenous, low SI appearance encountered in fibrolamellar HCC.

FNH found incidentally (arrows). (a) Pre-contrast T1-weighted image shows an isointense lesion with a central hypointense scar, which shows minimal mass effect upon adjacent vasculature. (b) Arterial-phase T1-weighted contrast-enhanced image shows hypervascularity of the lesion. (c) T1-weighted delayed phase imaging after contrast shows that the lesion is now predominantly isointense to the liver, but with late enhancement of the (vascular) central scar. The enhancement pattern is typical for FNH. (d, e) Hepatobiliary phase imaging of FNH in 2 other patients: (d) homogenous uptake of the liver-specific MR contrast agent, the spoke-wheel central scar is typically not enhanced. (e) Ring-like contrast uptake by the lesion in the left lobe with large hypointensity due to a large central scar
Using liver-specific MR contrast agents, FNH frequently shows enhancement on delayed images after administration of hepatobiliary contrast agents (gadoxetic acid or gadobenate dimeglumine) because of the presence of normal biliary ductules within the lesion and the expression of OATP receptors (Fig. 7.6). However, the uptake of hepatobiliary contrast agents within FNH may be rarely heterogenous or absent [35]. The central scar is spared in the hepatobiliary phase, and a more ring-like enhancement in the hepatobiliary phase due to a very prominent non-enhancing scar can be seen (Fig. 7.6) [36]. Nonetheless, a recent meta-analysis showed that lesion T1 isointensity or hyperintensity at delayed hepatobiliary phase MRI has a high sensitivity (91–100%) and specificity (87–100%) for diagnosing FNH [35]. This feature can be helpful for differentiating FNH from hypervascular metastases or hepatic adenomas (HCA) and hepatocellular carcinomas (HCC) (which rarely take up liver-specific agents) [29, 37]. However, it should be noted that some HCAs (particularly inflammatory HCA) and HCC can appear isointense or hyperintense at delayed imaging after hepatobiliary contrast media administration. While differentiating FNH from variants of HCA remains challenging, characterization should never be based on the hepatobiliary phase appearance alone. Regarding HCC, the presence of contrast washout (i.e., lesion hypointensity compared to liver parenchyma) in the portal venous or transitional phase of dynamic contrast enhancement can be used to distinguish between HCC (that shows contrast uptake in the hepatobiliary phase) and FHN nodules. The majority of FNH tend to remain static in size although FNH may increase in size on follow-up oral contraceptives do not appear to stimulate FNH growth [38, 39].
Key Points
-
FNH are usually (near) isointense on T1-weighted and T2-weighted images, with homogenous arterial-phase hyperenhancement.
-
The central scar (seen in most FNH >3 cm) is hypoattenuating/hypointense in the early contrast phases, with delayed-phase enhancement.
-
After liver-specific CM, FNH is almost always homogenously isointense/hyperintense in the hepatobiliary phase, with an hypointense central scar.
7.4.4 Hepatocellular Adenoma
Hepatocellular adenomas (HCA) are uncommon liver tumors, which occur more often in women of reproductive age. There is an association with oral contraceptives. Other risk factors include anabolic steroid usage, glycogen storage disease type, and obesity. Histologically, HCA is composed of cells resembling normal hepatocytes but lacking bile ducts, which distinguishes them from FNH [39].
In the last two decades, considerable progress has been made in the diagnosis of HCA, by establishment of molecular and immunohistological classification of HCA subtypes [40]. The molecular classification categorizes HCA into the following six sub-groups: HNF1A inactivated HCA (H-HCA), inflammatory HCA (I-HCA), beta-catenin activated HCA (b-HCA), sonic hedgehog HCA (shHCA), and unclassified HCA (UHCA) [41, 42]. The most common complications of HCA are bleeding and malignant transformation.
The imaging features of HCA are heterogeneous and varied and depend on the subtype. HCA are often hypervascular and may appear heterogenous due to the presence of fat, necrosis, or hemorrhage [39, 43]. T1-weighted chemical shift or DIXON imaging is useful for detecting intratumoral fat, while the presence of high T1-signal before contrast administration will raise the suspicion of spontaneous hemorrhage. The reader should be familiar with the differential diagnoses of fat containing focal liver lesions on MRI, which include focal fat infiltration, HCA (particularly the HNF1A inactivating subtype), hepatocellular carcinoma (usually well-differentiated), angiomyolipoma, lipoma, teratoma and liver metastases from fat containing malignancies (e.g. liposarcomas). The presence of intratumoral fat helps to narrow the differential diagnosis of a hypervascular lesion, as hemangioma can be excluded and metastases and FNH rarely contain fat.
On dynamic contrast-enhanced CT or MR, adenomas usually show marked arterial-phase enhancement, with rapid transition to either iso- or hypoattenuating/intense to hepatic parenchyma on portal venous phase imaging. Our understanding of the molecular aberrations associated with HCA has improved our understanding of HCA subtypes, which is linked to risk factors, histological features, clinical presentation, and imaging appearances [44, 45].
What is important for radiologists [46]? Inactivating mutations of hepatocyte nuclear factor 1 alpha (HNF1A) are observed in approximately 30% of HCA. HNF1A-inactivated HCA usually contains fat as evidenced by diffuse and homogenous signal loss on chemical shift T1-weighted imaging (Fig. 7.7). They return variable T2 signal. At contrast-enhanced T1-weighted MRI, they are hypervascular, often with contrast washout in the portal venous or delayed phase. They are typically hypointense on hepatobiliary-phase MRI using liver-specific contrast medium. HNF1A-inactivated HCAs have a very low risk of malignant transformation.

Adenoma (HNF1A subtype). (a) T1-weighted in-phase GRE image demonstrates a very large mass in a young woman. The mass is inhomogenous and shows bright spots. (b) There is typical signal intensity drop on the opposed-phase image indicative of intratumoral fat. (c) T2-weighted TSE image shows moderate hyperintensity. (d) On gadoxetic acid-enhanced image (hepatobiliary phase), there is little to no enhancement
Inflammatory HCA accounts for 40–50% of HCA cases. Obesity and a history of oral contraceptives intake are risk factors for their development. Inflammatory HCA appear strongly hyperintense on T2-weighted MRI, which may be diffuse or rim-like in the periphery of the lesion (atoll sign). Intralesional fat is uncommon, when present is often patchy or heterogeneous. On contrast-enhanced imaging, there is usually intense arterial enhancement, with persistent enhancement on delayed-phase imaging (Figs. 7.8 and 7.9). Although the majority of inflammatory HCA are hypointense on hepatobiliary phase using liver-specific contrast media, about 30% may appear iso- or hyperintense. Inflammatory HCA may also harbor activating mutations of b-catenin in exon 3 and are therefore at risk of malignant transformation.

Adenoma: inflammatory type. (a) T2-weighted TSE shows a large circumscribed mildly hyperintense mass in the left hepatic lobe (arrow) with an incidental right adrenal adenoma (*). (b) On opposed-phase T1-weighted GE image, the mass (arrow) is mildly hypointense. Note signal loss in the adrenal adenoma indicating intratumoral fat. (c) Pre-contrast and (d) portal venous phase post-contrast T1-weighted GRE show mild internal enhancement of the lesion (arrows)
Adenoma: inflammatory type. (a–c) Arterial (a) venous (b) phase CT show strong and progressive contrast enhancement of the lesion, which retains enhancement in the delayed phase (c), typical for peliotic changes in inflammatory adenoma
Mutations of catenin b1 (CTNNB1) are seen in 10–15% of HCA. These are associated with a higher risk of malignant transformation. These variants of HCA do not have typical imaging features and may be difficult to differentiate from HCC or FNH. HCA with mutations of catenin b1 (b-catenin-HCA) may show gadoxetic acid uptake in the hepatobiliary phase of MRI in up to 80% of patients [47].
Activation of sonic hedgehog pathway occurs in approximately 5% of HCA. As these are relatively uncommon, the spectrum of imaging features associated with these is yet to be fully described. Nonetheless, these lesions have a higher propensity to undergo spontaneous hemorrhage. About 7% of HCA remains unclassified. These do not have typical clinical or imaging appearances. Overall, the imaging features at MRI, including their appearances are helpful in distinguishing between FNH and HCA. Early studies also reported on the high value of liver-specific MR contrast agent for differentiation between FNH and adenoma (with FNH being predominantly iso-hyperintense in the hepatobiliary phase and HCA most often hypointense). [48, 42]. A recent meta-analysis on the value of hepatobiliary phase gadoxetic acid-enhanced MRI showed that HA subtypes other than H-HCA demonstrated proportions of iso- to hyperintensity on hepatobiliary phases images ranging from 11% to 59% [49]. Radiologists should thus recognize the low specificity hepatobiliary phase iso-hyperintensity for differentiating FNH from HCA subtypes other than H-HCA [49]. Of note is that diffusion-weighted MRI has little value in helping to distinguish between HCA and FNH or HCC because of the substantial overlap in the ADC values.
Key Points
-
Adenomas are uncommon benign tumors, most often in women. Risk factors include oral contraceptives, anabolic steroid usage, glycogen storage disease type, and obesity.
-
Several subtypes, with distinctive molecular and immunohistological features have been identified (e.g., HNF1A-inactivated HCA, inflammatory HCA, beta-catenin activated HCA, sonic hedgehog HCA, and unclassified HCA), with distinctive risk profiles (bleeding and malignant degeneration).
-
Imaging features are heterogenous vary depending on subtype, but arterial-phase hypervascularity is common.
7.4.5 Biliary Hamartomas (von Meyenburg Complex)
Bile duct hamartomas are congenital malformations of the ductal plate without connections to the bile ducts. They are usually incidentally discovered at abdominal imaging. Although of no clinical significance, they can mimic disseminated small liver metastases in the patient with cancer. Biliary hamartomas are typically small (5–10 mm in size) and diffusely spread in both lobes of the liver. On ultrasound, they appear as small hyperechoic or hypoechoic lesions and can demonstrate ringing artifacts (comet tail appearance). On CT, they appear as small cystic lesions of round, oval, or irregular shape without contrast enhancement although thin rim enhancement may sometimes be present, thus mimicking hypovascular liver metastases [43]. When enhancement is present, it is usually very thin (≤2 mm) and observed only on equilibrium-phase images, related to the fibrous component of the lesions [50]. On MRI, biliary hamartomas appear as low signal intensity on T1-weighted imaging, and high signal intensity on T2-weighted imaging (Fig. 7.10). They are best observed on maximum intensity projections MRCP sequences as high signal intensity foci without connection to or associated abnormalities of the intra-hepatic ducts. Occasionally, bile duct hamartomas can be very large, up to 20 cm, and be symptomatic from internal hemorrhage or pressure on adjacent structures [51]. Differential diagnosis of biliary hamartomas includes peribiliary cysts (predominantly perihilar distribution in patients with liver parenchymal disease), polycystic disease, and Caroli’s disease (cysts communicate with bile ducts and are associated with bile duct abnormalities).

Biliary hamartomas (von Meyenburg complexes). A middle-aged man was referred to MRI following an equivocal ultrasound examination. There are multiple foci of high T2-weighted signal (of variable size and shape) spread throughout the liver, suggestive of biliary hamartomas
7.4.6 Hepatic Abscess and Echinococcus
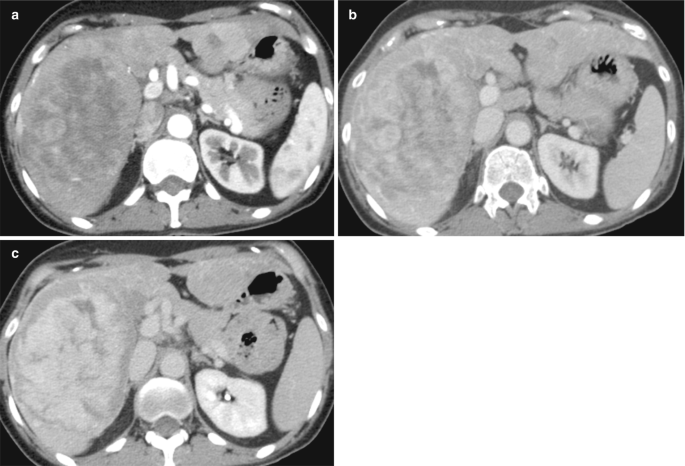
The appearances of hepatic abscesses on imaging depend on etiology (cholangitic abscesses tend to be small and scattered adjacent to the biliary tree; hematogenous distribution via the hepatic artery or via the portal vein in appendicitis or diverticulitis tends to lead to larger lesions diffusely spread in the liver). US reveals a cystic lesion with internal echoes. On CT, hepatic abscesses are hypodense lesions with capsules that may show enhancement (Fig. 7.11); clustering may be noted when multiple abscesses are present [52]. CT appearance of hepatic abscess is nonspecific and can be mimicked by cystic or necrotic metastases. Hence, appropriate clinical and laboratory corroboration is vital towards making the right radiological diagnosis. However, the distribution of abscesses in the liver may hint at the etiology (Fig. 7.11). Though present in only a small minority of cases, central gas is highly specific for abscess. On MR imaging, hepatic abscesses are hypointense relative to liver parenchyma on T1-weighted images and markedly hyperintense on T2-weighted images, often surrounded by an area of slight T2 hyperintensity representing perilesional edema, which may also show increased enhancement after contrast administration. On DWI, there is marked diffusion restriction, best seen as hypointensity on the ADC map.


Abscesses. (a) Typical large subcapsular (postoperative) abscess with an air-fluid level and a reactive pleural effusion. (b, c) Hematogenous abscesses in another patient with fever and right upper quadrant pain. T1-weighted contrast-enhanced images in the (b) arterial and (c) portal venous phase demonstrate multiple ring-enhancing lesions in both lobes of the liver. In the arterial phase, there is also associated increased parenchyma enhancement surrounding many of the lesions. The appearance is consistent with multiple septic abscesses. (d) Cholangitis abscess: T2-weighted MRI shows a solitary heterogeneous high signal lesion in the right hepatic lobe with (e) impeded diffusion at DWI (b750) with higher signal centrally. (f) T1-weighted contrast-enhanced image shows a serpiginous and thick rim enhancement pattern in keeping with a hepatic abscess
Amebic liver abscess is nonspecific. It usually appears as a solitary, hypodense lesion, with an enhancing wall that may be smooth or nodular and is often associated with an incomplete rim of edema. Like any bacterial abscess, lesions are hypointense on T1-weighted images and heterogeneously hyperintense on T2-weighted images [53].
On CT scan, involvement of liver by echinococcus granulosus (hydatid cyst) can manifest as unilocular or multilocular cysts with thin or thick walls and calcifications, usually with smaller daughter cysts with/without septations at the margin of or inside the mother cyst (i.e., this appearance is quite different from a “usual” multi-cystic tumor). On MR imaging, diagnostic features are the presence of a hypointense (i.e., densely fibrotic or even calcified) rim on T1-weighted and T2-weighted images and a multiloculated appearance.
7.5 Malignant Primary Tumors
7.5.1 Hepatocellular Carcinoma
HCC is the most common primary liver cancer, with the highest incidence in Asia and the Mediterranean. In European countries, HCC is found mostly in patients with chronic liver disease (e.g., liver cirrhosis due to HBV or HCV, alcohol abuse, metabolic syndrome or hemochromatosis, or due to chronic hepatitis B infection). At histopathology, HCC is characterized by abnormal hepatocytes arranged in trabecular and sinusoidal patterns. Lesions may be solitary, multifocal, or diffusely infiltrating.
There are wide varying appearances of HCC on imaging. An early HCC within at-risk population is typically small (<3 cm) and has a homogenous appearance. By contrast, late presentation disease (including tumor in non-cirrhotic patients) is characterized by more advanced disease, presenting as a larger heterogeneous lesion. US is frequently used for disease screening and surveillance of cirrhosis patients. The appearance of HCC on US is variable, with iso-, hypo-, or hyper-echogenicity (increased echogenicity is often due to intratumoral fat). Smaller lesions are typically homogeneous and larger lesions heterogeneous. A surrounding fibrous capsule is often present and characteristic for HCC, appearing as a hypoechoic rim surrounding the lesion.
On unenhanced CT images, most HCCs are hypo- or isodense (the latter particularly if small). The presence of intratumoral fat can lower CT attenuation and is suggestive of primary hepatocellular tumors in the appropriate clinical settings. Due to their altered and predominant arterial supply, HCCs enhance avidly in the arterial phase of contrast enhancement, becoming iso- or hypodense with the liver parenchyma in the portal venous phase of enhancement. Delayed-phase images show most HCC lesions as hypodense compared with surrounding liver. The washout of contrast in these tumors is a diagnostic characteristic of HCC (Fig. 7.12). Small HCCs may have a nodule-in-nodule appearance on CT and MR images, especially when the disease develops within a regenerative or dysplastic nodule (Fig. 7.13). At MR imaging, such a nodule can exhibit higher signal intensity on T2-weighted images and display hypervascularity on arterial-phase images.

HCC: Quadruple-phasic CT for detection and characterization. (a) Non-contrast CT shows liver cirrhosis and splenomegaly. In segment 4 a lesion is only faintly seen. (b) In the late arterial phase, a hypervascular HCC is depicted in segment 4 (arrow). (c) In the portal venous phase, the lesion is not visible. (d) Delayed phase scan reveals wash-out of the lesion, which is now hypoattenuating (arrow). The combination of arterial hypervascularity and wash-out is specific for HCC in the context of liver cirrhosis or chronic hepatitis B infection

HCC with nodule-in-nodule appearance. (a) Unenhanced CT show a siderotic (hyperattenuating) large nodule, which contains a low-density (non-siderotic) focus (arrow). (b) On T1-weighted GRE opposed-phase image, the marginal nodule shows low signal intensity (arrow). (c) The large nodule shows siderosis on T2-weighted TSE images, but the marginal focus displays higher SI. (d) Dynamic gadolinium-enhanced T1-weighted GRE images show (d) arterial hypervascularity of the malignant focus (arrow)
Multi-phase imaging after contrast administration on CT helps to optimize the detection and characterization of HCC. Late arterial-phase imaging is the most sensitive for detecting small lesions [6, 54, 55]. A venous phase is always necessary for tumor detection/characterization and assessment of venous structures (Fig. 7.12), as well as other abdominal organs. The delayed-phase imaging (e.g., at 2–3 min) can occasionally help to detect a lesion that may be missed [56]. Much more important it can help to make a firm diagnosis of HCC by showing typical lesion contrast washout, if it had not been present in the portal venous phase [57]. Unenhanced images are important for identifying hyperdense siderotic nodules and for detecting hypodense intratumoral fat. Unenhanced images are also useful for tumor follow-up after chemoembolization or after tumor ablation. For these reasons, a three- to four-phasic MDCT protocol is utilized at most centers to evaluate HCC.
The reliance on focal hypervascularity in the arterial phase can lead to false-positive diagnosis of HCC [58]. Transient focal enhancement of liver parenchyma during arterial phase, also termed transient hepatic attenuation differences (THAD), can lead to a false diagnosis of HCC. In cirrhotic patients, transient focal enhancement is often related to arterial-portal shunting, resulting in early focal areas of portal venous distribution enhancement in the liver. THAD are usually peripherally located in the liver, appear wedge shaped and may be poorly circumscribed. Subcapsular lesions that do not exhibit mass effect or a round nature should be carefully evaluated before suggesting the diagnosis of HCC. THAD are not associated with lesion hypodensity in the portal venous or delayed phases of contrast enhancement. The combination of hyperdensity on arterial-phase images combined with washout to hypodensity on venous- or delayed-phase images, although not sensitive (33%), is highly specific (100%) for the diagnosis of HCC [59] (Fig. 7.12). However, a small proportion of HCC is isoattenuating or hypoattenuating compared with the liver, which can be difficult to diagnose.
The typical MR imaging features of larger HCC include a fibrous capsule, intratumoral septa, daughter nodules, and tumor thrombus (Fig. 7.14) [60]. These lesions are often heterogeneous in appearances (mosaic architecture) on both CT and MR [61]. Whereas most large HCC are hyperintense on T2-weighted images, smaller lesions, but some even measuring 3–4 cm, can appear isointense or hypointense. On T1-weighted images, HCC shows variable signal intensity relative to hepatic parenchyma. A tumor capsule may be seen on T1-weighted and less commonly, as hypointensity on T2-weighted imaging.

HCC in the right lobe with tumor thrombus. (a) Late arterial and (b) portal venous phase T1-weighted GRE show inhomogenous enhancement and expansion of the portal vein. There is inhomogenous enhancement of the right lobe, but no definite tumor is seen. (c) DWI shows a solid mass in the entire intrahepatic portal vein and part of the tumor in the right lobe. (d) In another patient with a large HCC in the right lobe, tumor extension into the right hepatic vein (arrow) and the inferior vena cava are seen
Dynamic extracellular gadolinium-enhanced imaging in HCC parallels the features described for CT, with characteristic early peak contrast enhancement and delayed-phase tumor contrast washout of the nodular solid components; as well as T1 enhancement of the capsule. Liver-specific MR contrast agents (gadoxetic acid; Primovist, Bayer Healthcare or gadobenate dimeglumine, MultiHance, Bracco) can be administered to provide arterial, portal venous, and equilibrium-phase imaging, but has the added advantage of revealing additional characteristics at the delayed hepatobiliary phase of contrast enhancement. HCC typically do not show uptake of liver-specific contrast medium in the hepatobiliary phase, which can add confidence towards the detection and characterization of HCC (Fig. 7.15) [62]. It has been shown that using gadoxetic acid-enhanced MRI can improve the detection of small or early HCCs, as it is superior for detecting HCC measuring up to 2 cm in size compared with CT [63]. In addition, sub-centimeter lesions detected by gadoxetic acid-enhanced MRI are likely to be or can transform to become HCC within a short interval [64]. Hence, several evolving guidelines for the imaging evaluation of HCC are incorporating the role of liver-specific contrast media for the diagnosis of sub-centimeter HCC. However, there is currently a lack of standardization across HCC guidelines on the target populations for surveillance, diagnosis, staging, or monitoring; the imaging modalities and imaging criteria to be applied; or recommended treatment [65].

HCC: MRI with liver-specific contrast agent (gadoxetic acid). (a) Axial T1-weighted GRE shows an encapsulated slightly hyperintense mass in the dome of the liver. (b) Gadoxetic acid-enhanced image shows strong enhancement in the arterial phase. (c) In the hepatobiliary phase the lesion shows hypointensity due to lack of hepatocellular uptake
It is important to recognize the pitfalls of using liver-specific contrast media for HCC evaluation. Benign regenerating nodules may appear hypointense at the hepatobiliary phase of contrast enhancement although the majority appears isointense of the liver [66]. In addition, some well-differentiated or moderately differentiated HCC may appear isointense or hyperintense due to higher levels of OATP1B3 and MRP3 receptor expression. For this reason, the use of ancillary imaging features at MRI can improve the confidence of HCC diagnosis. These include mild to high T2 signal intensity and impeded diffusion on high b-value DWI. The use of liver-specific contrast agents may also help towards the identification of isoenhancing or hypoenhancing HCC that do not show typical arterial-phase hyperenhancement. With regard to the use of diffusion-weighted MRI for HCC evaluation, a higher b-value (e.g., 800 s/mm2) DWI may help in the identification of disease, particularly if the suspected nodule also demonstrates typical vascularity pattern at contrast-enhanced MRI. Higher grade/poorly differentiated HCC are more likely to show impeded diffusion and lower ADC values compared with well-differentiated HCC.
To summarize, many MR characteristics are often as associated with HCC (arterial-phase hyperenhancement, portal venous or delayed-phase washout, lack of liver-specific MR contrast agent uptake on hepatobiliary phase images, moderate T2 hyperintensity, and restricted diffusion on high-b-value DWI). However, for each of these findings, there is only ~60–80% sensitivity, and benign lesions can also show these findings, depending on finding, contrast agent used, and series reported [66, 67]. Furthermore, depending on the guidelines (EASL, AASLD, APASL, JSH, or KLCA-NCC) applied, this can lead to different diagnostic accuracies for the diagnoses of HCC [66]. To overcome the problems with inconsistent terminology and different imaging criteria, the American College of Radiology developed the Liver Imaging Reporting and Data System (LI-RADS®), with a standardized lexicon of terminology. The LIRADS CT/MRI guideline has been revised several times (now in its v2018) [68]. This guideline is applicable in adult patients (≥18 years) with liver cirrhosis or chronic hepatitis B. In general, focal liver lesions (called “observations” are categorized as LR-1 through LR-5, depending on the probability of HCC. For probably or definitely malignant lesions not necessarily HCC, the category of LR-M is appropriate, and LR-TIV for malignant tumors extending into the veins (Fig. 7.14). LI-RADS® uses major and ancillary imaging features to categorize observations. The validity of these imaging features has been proven in several study.
Key Points
-
Risk factors for HCC include liver cirrhosis (of various etiologies) and chronic hepatitis B infection.
-
The key imaging features at contrast-enhanced MDCT and MRI are arterial-phase hyperenhancement and washout (to hypoattenuation/hypointensity) in the portal venous phase and/or the 3-min delayed phase.
-
The CT/MRI LI-RADS® v2018 Guideline by the American College of Radiology is an excellent tool, which provides standard terminology, an imaging feature lexicon, and a diagnostic algorithm to classify focal lesions (“observations”) in patients at risk for HCC.
7.5.2 Fibrolamellar HCC
Fibrolamellar HCC (FL-HCC) typically affects young patients without chronic liver disease On CT, FL-HCC appears as a large, hypervascular mass with a central scar and calcifications in up to 70% of cases [69, 70]. It often shows aggressive features: vascular invasion, biliary obstruction, satellite lesions, and lymph node metastases [71]. On MR imaging, FL-HCC are typically hypointense on T1-weighted and hyperintense on T2-weighted images, with T1-weighted and T2-weighted hypointense central scar (Fig. 7.16). This is in contrast to the scar of FNH, which is most often hyperintense on T2-weighted images. The fibrous central zone FL-HCC may show delayed retention of CT and extracellular gadolinium MR contrast agents. In contrast to FNH, the contrast enhancement in FL-HCC is usually heterogeneous compared with the homogenous enhancement pattern of FNH.

Fibrolamellar HCC. (a) Arterial-phase MDCT shows heterogeneously enhancing mass in left lobe (arrows) with low attenuation central fibrous scar with calcifications (arrowheads). (b) T2-weighted MRI shows large left lobe mass (arrows) with heterogeneous appearance and mild to moderately increased signal intensity. Fibrous central scar is of very low signal intensity (arrowheads)
7.5.3 Cholangiocellular Carcinoma
Cholangiocellular carcinoma (CCC) is the second most common primary malignancy of the liver. Intrahepatic CCC originates from the intralobular bile ducts (in contrast to hilar CCC, which arises from a main hepatic duct or from the bifurcation) (Fig. 7.17). Intrahepatic CCC often presents late as a large mass [72]. According to the growth characteristics, CCC is classified as mass forming, periductal infiltrating, or intraductal growing, with the mass-forming type being most common in intrahepatic CCC [72]. At CT and MR imaging, lesions tend to be hypodense at unenhanced CT and hypointense on T1-weighted images, with peripheral enhancement at dynamic contrast-enhanced studies [73]. Delayed-phase CT/MR imaging (after 5–15 min) may show enhancement homogeneously or in the center of the lesion due to its rich fibrous stroma, which is suggestive of the diagnosis of CCC (Fig. 7.18) [74]. CCC shows a target appearance on DWI, with the central fibrotic stroma often shows signal suppression on diffusion-weighted MRI compared with the cellular rim and return relatively high ADC value. More recently, the intrahepatic CCC can also be classified into the “large duct type” or the “small duct type” depending on the cell of origin, which are associated with different imaging appearances. Large duct type tumor has a worse prognosis and are found to be more likely to show infiltrative contours, diffuse biliary dilatation, vascular invasion, and absence of arterial enhancement [75]. Periductal infiltrative CCC causes early segmental dilatation of bile ducts in a stage when the tumor itself may be difficult to discern [73]. In addition, there are morphologic features that can suggest the diagnosis of CCC. Peripheral lesions often demonstrate overlying capsular retraction due to their scirrhous, fibrous matrix. Dilated intrahepatic bile ducts proximal to an intrahepatic CCC can also provide clues to the diagnosis, as biliary obstruction is unusual with intrahepatic metastases (with the exception of colorectal cancer [76].

Hilar cholangiocarcinoma in a man with jaundice. (a) MRCP (maximum intensity projection) shows dilated right and left intrahepatic ducts, which can be traced to their confluence (arrow). The common bile duct and pancreatic duct are not dilated. (b) Delayed post-contrast coronal CT reformation shows enhancing soft tissue at the confluence of the right and left hepatic ducts typical of perihilar cholangiocarcinoma

Peripheral cholangiocarcinoma: contrast enhancement characteristics in 2 patients. (a) Contrast-enhanced CT in the arterial, portal venous, and delayed phases demonstrate thick irregular rim enhancement (arrows) with delayed central enhancement due to the fibrotic matrix (small arrow). (b) Gadoxetic-acid-enhanced MRI in the arterial, portal venous, and hepatobiliary phases show a mass with satellite nodules and thick irregular rim enhancement (arrows), progressing over time. In the hepatobiliary phase there is central retention of contrast material (asterisk) due to fibrous matrix, which should not be confused with hepatocellular uptake of a hepatocellular lesion. In CCC, quite often peripheral wash-out of contrast is seen in late phases (small arrow)
7.6 Rare Primary Liver Tumors
7.6.1 Biliary Cystadenoma/Cystadenocarcinomas
These tumors present a similar appearance and morphology as their mucinous counterparts in the pancreas and occur usually in women. Even when benign, these tumors have a propensity for malignant degeneration, and any such tumor should be considered potentially malignant. They appear as unilocular or septated cystic masses, with the typical anechoic and hypoechoic US appearance and near water-like attenuation contents on CT. For differentiation between simple cyst and cystadenoma, the assessment of septations is helpful: in cystadenoma, the septa usually arise from a smooth cyst wall, whereas in simple cysts the septa there are indentations of the cyst wall at the origin of the septa [77]. The presence of papillary excrescences, soft-tissue nodularity or septations are associated with a higher risk of malignancy in cystadenoma [78]. The cystic areas show variable signal intensity at T1-weighted MRI, including being hyperintense to liver related to its proteinaceous content. Coarse calcifications may be observed at US and CT in both cystadenoma and cystadenocarcinoma and is not a sign of benignity.
7.6.2 Hepatic Angiosarcoma
Hepatic angiosarcoma is a rare tumor. There is a strong association with prior exposure to carcinogens such as vinyl chloride and Thorotrast, as well as in patients with hemochromatosis. However, in the majority, the tumor is idiopathic. Pathologically, angiosarcoma presents as large, solitary masses or with multiple tumor nodules with blurred lesion margins [79]. The imaging appearance of angiosarcoma is often nonspecific, appearing hypodense on unenhanced CT, hypointense on T1-weighted MR imaging, and mildly hyperintense on T2-weighted imaging (although if prominent sinusoidal vascular spaces are present, these can appear of homogeneous and very high T2-weighted signal intensity). Following iodine or gadolinium-based contrast administration, most lesions show nonspecific heterogeneous enhancement or even centripetal enhancement. Potentially problematic are those tumors with prominent sinusoidal vascular spaces, because they can mimic the appearance of benign hemangioma on CT and MRI. The high T2-weighted MR signal in such lesions further compounds this problem. In most such cases, however, careful evaluation will show that the tumoral enhancement does not follow characteristics of blood pool at all phases, or that there are other features, such as multiple lesions, that makes the diagnosis of hemangioma unlikely [80, 81].
7.6.3 Epithelioid Hemangioendothelioma
Epithelioid hemangioendothelioma (EHE) is a rare tumor of vascular origin, not to be confused with infantile hemangioendothelioma, which is a very different tumor. These hepatic tumors are characterized by multiple, peripherally located lesions that progressively become confluent masses (Fig. 7.19). In addition to the unusual peripheral liver distribution, a key characteristic feature is the presence of overlying capsular retraction, due to the presence of fibrosis and scarring [82]. The CT attenuation or MR signal intensity characteristics are nonspecific, although occasional tumoral calcifications may be seen. Contrast enhancement with CT or MR gadolinium chelates often shows a central zone of decreased enhancement with marked rim enhancement (Fig. 7.19) [79]: The reverse pattern has also been observed with a central area of increased enhancement and peripheral decreased enhancement. Concentric zones of marked enhancement have also been reported. A visible branch of the portal or hepatic vein terminating at the periphery of these lesions (lollipop sign) has also been described, although this is not pathognomonic of the disease [83]. Lesions often become confluent and may grow large enough to replace nearly the entire liver parenchyma.
Epithelioid hemangioendothelioma. (a) Fat-suppressed T2-weighted TSE shows multiple subcapsular hyperintense lesions, some showing biphasic pattern with central higher T2 signal core compared with the periphery. (b) Portal venous phase fat-suppressed T1-weighted MRI shows mild enhancement in the periphery of these overall hypointense lesions. (c, d) Contrast-enhanced MDCT in the arterial and portal venous phases typically shows multiple subcapsular lesions in both lobes
7.7 Hepatic Metastases
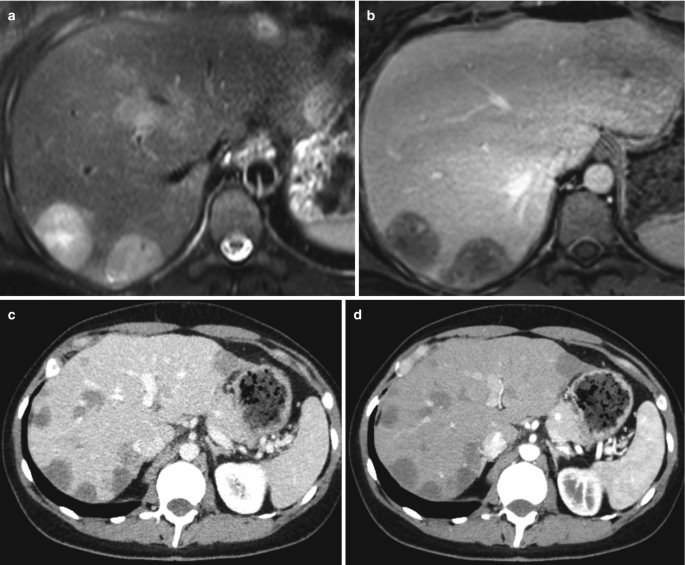
At US, liver metastases can appear hypoechoic, isoechoic, or hyperechoic. On dynamic contrast-enhanced CT, most metastases appear hypovascular and hypodense relative to liver parenchyma on the portal venous phase (Fig. 7.20). Hypervascular metastases are most commonly seen in renal cell carcinoma, neuroendocrine tumors, sarcomas, and breast tumor patients (Fig. 7.20). These tumors are best seen in the arterial phase and may become isodense and difficult to detect at the later phases of contrast enhancement. At MR, metastases are usually hypointense on T1-weighted and moderately hyperintense on T2-weighted images [84]. Peritumoral edema makes lesions appear larger on T2-weighted images and is highly suggestive of a malignant mass [85]. High signal intensity on T1-weighted sequences is typical for melanoma metastases due to the paramagnetic nature of melanin. It can also be seen in and around metastases after tumor ablation due to coagulation necrosis. Some lesions may have a central area of hyperintensity (target sign) on T2-weighted images, which corresponds to central necrosis. DWI with high b-values (e.g., 600–800) is very helpful for detecting small liver metastases, which may otherwise escape detection (Fig. 7.21). On dynamic contrast-enhanced MR imaging, metastases demonstrate enhancement characteristics similar to those described for CT. Metastases may demonstrate a hypointense rim compared with the center of the lesion on delayed images (peripheral washout sign), which is highly specific for malignancy. It has been shown in colorectal cancer, that the combination of using DWI, together with liver-specific contrast media-enhanced MRI results in the highest diagnostic accuracy for the detection of liver metastases (Fig. 7.22) [86]. The role of liver-specific MR contrast agents in patients with suspected liver metastases is still under discussion. However, liver-specific MR contrast agents are undoubtedly the preferred imaging method for pre-surgical or pre-interventional planning for liver metastases [65].

Metastases. (a) Contrast-enhanced MDCT in the arterial phase demonstrates several predominantly hypervascular liver metastases of neuroendocrine cancer of the pancreas. (b) Contrast-enhanced MDCT in the venous phase shows typical hypovascular colorectal metastases

Value of diffusion-weighted MRI for detection of small metastases. (a) T2-weighted MRI and (b) Gadoxetic acid-enhanced T1-weighted MRI (hepatobiliary phase) shows no apparent lesions within the liver. (c) DWI (b750 image) clearly shows a small metastasis in the left hepatic lobe (arrow). The lesion was also not visualized on a contemporaneous FDG PET/CT examination

Colorectal liver metastases at gadoxetic acid-enhanced MRI. (a) Unenhanced T1-weighted MRI shows two hypointense lesions in segments 6/7 and 4. (b) T2-weighted TSE image shows the lesions to be moderately hyperintense. (c) Gadoxetic acid-enhanced MRI in the hepatobiliary phase shows two additional small subcapsular metastases (arrows) not seen on unenhanced MRI or MDCT (not shown)
Key Points
-
Liver metastases of extrahepatic primaries are much more common than primary cancers of the liver.
-
Most metastases (of adenocarcinoma or squamous cell cancer origin) are hypovascular.
-
Renal cell cancer, neuroendocrine tumors, sarcomas, melanoma, and occasionally breast cancer may seed hypervascular metastases.
-
At MRI the combination of DWI and liver-specific MR contrast agents yields the best results regarding detection of metastases.
7.8 Differential Diagnosis of Focal Liver Lesions
The approach to characterizing a focal liver lesion seen on MDCT begins with determining its density. If the lesion shows near water attenuation, is homogenous in character, and has sharp margins, then a cyst should be considered and can be confirmed with US in almost all cases. However, the radiologist should be familiar with the imaging features of other cystic lesions that can mimic simple cysts. When evaluating solid focal liver lesions, disease characterization is largely reliant on observing the rate and pattern of contrast enhancement. If a lesion shows peripheral and nodular enhancement, with the density of enhancing portions showing the same general levels of blood vessels in the arterial, venous, and delayed phases, a hemangioma can be confidently diagnosed. Arterially hypervascular enhancing lesions include FNH, HCA, HCC, and metastases from neuroendocrine tumors, melanoma, renal cell carcinoma, and breast cancer. In general, HCC is considered in a setting of cirrhosis or chronic liver disease. The CT/MRI LI-RADS® guideline of the American College of Radiology has undergone several revisions since its release in 2011 [87,88,89]. It provides standard terminology, an imaging feature lexicon, and a validated classification system for focal lesions found in patients at risk for HCC (adults with cirrhosis or chronic hepatitis B). LI-RADS terminology should be implemented in clinical practice to improve communication between radiologists and referring hepatologists, oncologists, and surgeons.
FNH is most likely in young women with a non-cirrhotic liver and if the lesion is homogeneous and near isodense/isointense on unenhanced CT/MR imaging with a central T2-weighted hyperintense scar. By comparison, thick, irregular, heterogeneous enhancement or the presence of peripheral washout at the delayed phase suggests a malignant mass, such as metastases, CCC, or even HCC. In particular, delayed enhancement is a feature of CC due to is fibrotic stroma.
Liver-specific MR contrast has been shown to improve the characterization of FNH and HCA. They are recommended in the preoperative assessment of patients with potentially resectable liver metastases (from colorectal cancer). DWI is also now routinely performed in liver imaging. Its main clinical benefit is the detection of focal liver lesions, which may be missed on conventional and contrast-enhanced imaging sequences. Quantitative ADC measurements can support the characterization of focal liver lesions, with higher ADC values favoring benign lesions. However, the use of ADC value should be made considering all other imaging findings because of the significant overlap of ADC values between benign and malignant lesions.
7.9 Concluding Remarks
Contrast-enhanced liver MDCT for detection and characterization of focal masses should be at least bi-phasic. A triple-phasic contrast-enhanced protocol is recommended in the LI-RADS® guideline for HCC detection and characterization in high-risk patients. The MRI protocol should routinely include T1-weighted GRE DIXON, T2-weighted TSE (with or without fatsat), DWI, and dynamic-contrast-enhanced pulse sequences. Liver-specific MR contrast agents are recommended for evaluation of patients with potentially resectable colorectal liver metastases. Liver-specific MR contrast agents are also helpful for characterization of hepatocellular lesions (especially FNH vs. adenoma).
Take-Home Messages
-
Contrast-enhanced liver MDCT for detection and characterization of focal masses should be at least bi-phasic. A triple-phasic contrast-enhanced protocol is recommended in the LI-RADS® guideline for HCC detection and characterization in high-risk patients.
-
MRI protocol should routinely include T1-weighted GRE DIXON, T2-weighted TSE (with or without fatsat), DWI, and dynamic-contrast-enhanced pulse sequences.
-
Liver-specific MR contrast agents are recommended for evaluation of patients with potentially resectable colorectal liver metastases.
-
Liver-specific MR contrast agents are helpful for characterization of FNH and adenoma.
References
Laghi A, Multidetector CT (64 Slices) of the liver: examination techniques. Eur Radiol. 2007;17:675–83.
Weg N, Scheer MR, Gabor MP. Liver lesions: improved detection with dual-detector-array CT and routine 2.5-mm thin collimation. Radiology. 1998;209:417–26.
Ichikawa T, Nakajima H, Nanbu A, Hori M, Araki T. Effect of injection rate of contrast material on CT of hepatocellular carcinoma. AJR Am J Roentgenol. 2006;186:1413–8.
Foley WD, Hoffmann RG, Quiroz FA, Kahn CE Jr, Perret RS. Hepatic helical CT: contrast material injection protocol. Radiology. 1994;192:367–71.
Kim T, Murakami T, Takahashi S, Tsuda K, Tomoda K, Narumi Y, et al. Effects of injection rates of contrast material on arterial phase hepatic CT. AJR Am J Roentgenol. 1998;171:429–32.
Schima W, Hammerstingl R, Catalano C, Marti-Bonmati L, Rummeny EJ, Montero FT, et al. Quadruple-phase MDCT of the liver in patients with suspected hepatocellular carcinoma: effect of contrast material flow rate. AJR Am J Roentgenol. 2006;186:1571–9.
Sultana S, Awai K, Nakayama Y, Nakaura T, Liu D, Hatemura M, et al. Hypervascular hepatocellular carcinomas: bolus tracking with a 40-detector CT scanner to time arterial phase imaging. Radiology. 2007;243:140–7.
Stiller W. Basics of iterative reconstruction methods in computed tomography: a vendor-independent overview. Eur J Radiol. 2018;109:147–54.
Singh S, Kalra MK, Hsieh J, Licato PE, Do S, Pien HH, et al. Abdominal CT: comparison of adaptive statistical iterative and filtered back projection reconstruction techniques. Radiology. 2010;257:373–83.
May MS, Wüst W, Brand M, Stahl C, Allmendinger T, Schmidt B, et al. Dose reduction in abdominal computed tomography: intraindividual comparison of image quality of full-dose standard and half-dose iterative reconstructions with dual-source computed tomography. Investig Radiol. 2011;46:465–70.
Gonzalez-Guindalini FD, Ferreira Botelho MP, Töre HG, Ahn RW, Gordon LI, Yaghmai V. MDCT of chest, abdomen, and pelvis using attenuation-based automated tube voltage selection in combination with iterative reconstruction: an intrapatient study of radiation dose and image quality. AJR Am J Roentgenol. 2013;201:1075–82.
Fuentes-Orrego JM, Hayano K, Kambadakone AR, Hahn PF, Sahani DV. Dose-modified 256-MDCT of the abdomen using low tube current and hybrid iterative reconstruction. Acad Radiol. 2013;20:1405–12.
Altenbernd J, Heusner TA, Ringelstein A, Ladd SC, Forsting M, Antoch G. Dual-energy-CT of hypervascular liver lesions in patients with HCC: investigation of image quality and sensitivity. Eur Radiol. 2011;21:738–43.
Luo XF, Xie XQ, Cheng S, Yang Y, Yan J, Zhang H, et al. Dual-energy CT for patients suspected of having liver iron overload: can virtual iron content imaging accurately quantify liver iron content? Radiology. 2015;277:95–103.
Lee MH, Kim YK, Park MJ, Hwang J, Kim SH, Lee WJ, et al. Gadoxetic acid-enhanced fat suppressed three-dimensional T1-weighted MRI using a multiecho Dixon technique at 3 tesla: emphasis on image quality and hepatocellular carcinoma detection. J Magn Reson Imaging. 2013;38:401–10.
Chandarana H, Block KT, Winfeld MJ, Lala SV, Mazori D, Giuffrida E, et al. Free-breathing contrast-enhanced T1-weighted gradient-echo imaging with radial k-space sampling for paediatric abdominopelvic MRI. Eur Radiol. 2014;24:320–6.
Padhani AR, Liu G, Koh DM, Chenevert TL, Thoeny HC, Takahara T, et al. Diffusion-weighted magnetic resonance imaging as a cancer biomarker: consensus and recommendations. Neoplasia. 2009;11:102–25.
Koh DM, Brown G, Riddell AM, Scurr E, Collins DJ, Allen SD, et al. Detection of colorectal hepatic metastases using MnDPDP MR imaging and diffusion-weighted imaging (DWI) alone and in combination. Eur Radiol. 2008;18:903–10.
Holzapfel K, Reiser-Erkan C, Fingerle AA, Erkan M, Eiber MJ, Rummeny EJ, et al. Comparison of diffusion-weighted MR imaging and multidetector-row CT in the detection of liver metastases in patients operated for pancreatic cancer. Abdom Imaging. 2011;36:179–84.
Vandecaveye V, De Keyzer F, Verslype C, Op de Beeck K, Komuta M, Topal B, et al. Diffusion-weighted MRI provides additional value to conventional dynamic contrast-enhanced MRI for detection of hepatocellular carcinoma. Eur Radiol. 2009;19:2456–66.
Oudkerk M, Torres CG, Song B, König M, Grimm J, Fernandez-Cuadrado J, et al. Characterization of liver lesions with mangafodipir trisodium-enhanced MR imaging: multicenter study comparing MR and dual-phase spiral CT. Radiology. 2002;223:517–24.
Scharitzer M, Schima W, Schober E, Reimer P, Helmberger TK, Holzknecht N, et al. Characterization of hepatocellular tumors: value of mangafodipir-enhanced magnetic resonance imaging. J Comput Assist Tomogr. 2005;29:181–90.
Ward J, Robinson PJ, Guthrie JA, Downing S, Wilson D, Lodge JP, et al. Liver metastases in candidates for hepatic resection: comparison of helical CT and gadolinium- and SPIO-enhanced MR imaging. Radiology. 2005;237:170–80.
Hammerstingl R, Huppertz A, Breuer J, Balzer T, Blakeborough A, Carter R, et al. Diagnostic efficacy of gadoxetic acid (Primovist)-enhanced MRI and spiral CT for a therapeutic strategy: comparison with intraoperative and histopathologic findings in focal liver lesions. Eur Radiol. 2008;18:457–67.
Schima W, Saini S, Echeverri JA, Hahn PF, Harisinghani M, Mueller PR. Focal liver lesions: characterization with conventional spin-echo versus fast spin-echo T2-weighted MR imaging. Radiology. 1997;202:389–93.
Farraher SW, Jara H, Chang KJ, Ozonoff A, Soto JA. Differentiation of hepatocellular carcinoma and hepatic metastasis from cysts and hemangiomas with calculated T2 relaxation times and the T1/T2 relaxation times ratio. J Magn Reson Imaging. 2006;24:1333–41.
Semelka RC, Brown ED, Ascher SM, Patt RH, Bagley AS, Li W, et al. Hepatic hemangiomas: a multi-institutional study of appearance on T2-weighted and serial gadolinium-enhanced gradient-echo MR images. Radiology. 1994;192:401–6.
Oto A, Kulkarni K, Nishikawa R, Baron RL. Contrast enhancement of hepatic hemangiomas on multiphase MDCT: can we diagnose hepatic hemangiomas by comparing enhancement with blood pool? AJR Am J Roentgenol. 2010;195:381–6.
Ba-Ssalamah A, Uffmann M, Saini S, Bastati N, Herold C, Schima W. Clinical value of MRI liver-specific contrast agents: a tailored examination for a confident non-invasive diagnosis of focal liver lesions. Eur Radiol. 2009;19:342–57.
Taouli B, Koh DM. Diffusion-weighted MR imaging of the liver. Radiology. 2010;254:47–66.
Vossen JA, Buijs M, Liapi E, Eng J, Bluemke DA, Kamel IR. Receiver operating characteristic analysis of diffusion-weighted magnetic resonance imaging in differentiating hepatic hemangioma from other hypervascular liver lesions. J Comput Assist Tomogr. 2008;32:750–6.
Kehagias D, Moulopoulos L, Antoniou A, Hatziioannou A, Smyrniotis V, Trakadas S, et al. Focal nodular hyperplasia: imaging findings. Eur Radiol. 2001;11:202–12.
Brancatelli G, Federle MP, Grazioli L, Blachar A, Peterson MS, Thaete L. Focal nodular hyperplasia: CT findings with emphasis on multiphasic helical CT in 78 patients. Radiology. 2001;219:61–8.
Uggowitzer MM, Kugler C, Mischinger HJ, Gröll R, Ruppert-Kohlmayr A, Preidler KW, et al. Echo-enhanced doppler sonography of focal nodular hyperplasia of the liver. J Ultrasound Med. 1999;18:445–51; quiz 53–4.
McInnes MD, Hibbert RM, Inácio JR, Schieda N. Focal nodular hyperplasia and hepatocellular adenoma: accuracy of gadoxetic acid-enhanced mr imaging—a systematic review. Radiology. 2015;277:413–23.
Fujiwara H, Sekine S, Onaya H, Shimada K, Mikata R, Arai Y. Ring-like enhancement of focal nodular hyperplasia with hepatobiliary-phase Gd-EOB-DTPA-enhanced magnetic resonance imaging: radiological-pathological correlation. Jpn J Radiol. 2011;29:739–43.
Purysko AS, Remer EM, Coppa CP, Obuchowski NA, Schneider E, Veniero JC. Characteristics and distinguishing features of hepatocellular adenoma and focal nodular hyperplasia on gadoxetate disodium-enhanced MRI. AJR Am J Roentgenol. 2012;198:115–23.
Leconte I, Van Beers BE, Lacrosse M, Sempoux C, Jamart J, Materne R, et al. Focal nodular hyperplasia: natural course observed with CT and MRI. J Comput Assist Tomogr. 2000;24:61–6.
Mathieu D, Kobeiter H, Maison P, Rahmouni A, Cherqui D, Zafrani ES, et al. Oral contraceptive use and focal nodular hyperplasia of the liver. Gastroenterology. 2000;118:560–4.
Bioulac-Sage P, Gouw ASH, Balabaud C, Sempoux C. Hepatocellular adenoma: what we know, what we do not know, and why it matters. Histopathology. 2022;80:878–97.
Blanc JF, Frulio N, Chiche L, Sempoux C, Annet L, Hubert C, et al. Hepatocellular adenoma management: call for shared guidelines and multidisciplinary approach. Clin Res Hepatol Gastroenterol. 2015;39:180–7.
Nault JC, Paradis V, Cherqui D, Vilgrain V, Zucman-Rossi J. Molecular classification of hepatocellular adenoma in clinical practice. J Hepatol. 2017;67:1074–83.
Prasad SR, Sahani DV, Mino-Kenudson M, Narra VR, Menias C, Wang HL, et al. Benign hepatic neoplasms: an update on cross-sectional imaging spectrum. J Comput Assist Tomogr. 2008;32:829–40.
Katabathina VS, Menias CO, Shanbhogue AK, Jagirdar J, Paspulati RM, Prasad SR. Genetics and imaging of hepatocellular adenomas: 2011 update. Radiographics. 2011;31:1529–43.
van Aalten SM, Thomeer MG, Terkivatan T, Dwarkasing RS, Verheij J, de Man RA, et al. Hepatocellular adenomas: correlation of MR imaging findings with pathologic subtype classification. Radiology. 2011;261:172–81.
Wong VK, Fung AW, Elsayes KM. Magnetic resonance imaging of hepatic adenoma subtypes. Clin Liver Dis (Hoboken). 2021;17:113–8.
Katabathina VS, Khanna L, Surabhi VR, Minervini M, Shanbhogue K, Dasyam AK, et al. Morphomolecular classification update on hepatocellular adenoma, hepatocellular carcinoma, and intrahepatic cholangiocarcinoma. Radiographics. 2022;42:1338–57.
Grazioli L, Bondioni MP, Haradome H, Motosugi U, Tinti R, Frittoli B, et al. Hepatocellular adenoma and focal nodular hyperplasia: value of gadoxetic acid-enhanced MR imaging in differential diagnosis. Radiology. 2012;262:520–9.
Kim TH, Woo S, Ebrahimzadeh S, McLnnes MDF, Gerst SR, Do RK. Hepatic adenoma subtypes on hepatobiliary phase of Gadoxetic acid-enhanced MRI: systematic review and meta-analysis. AJR Am J Roentgenol. 2022;
Semelka RC, Hussain SM, Marcos HB, Woosley JT. Biliary hamartomas: solitary and multiple lesions shown on current MR techniques including gadolinium enhancement. J Magn Reson Imaging. 1999;10:196–201.
Martin DR, Kalb B, Sarmiento JM, Heffron TG, Coban I, Adsay NV. Giant and complicated variants of cystic bile duct hamartomas of the liver: MRI findings and pathological correlations. J Magn Reson Imaging. 2010;31:903–11.
Jeffrey RB Jr, Tolentino CS, Chang FC, Federle MP. CT of small pyogenic hepatic abscesses: the cluster sign. AJR Am J Roentgenol. 1988;151:487–9.
Barreda R, Ros PR. Diagnostic imaging of liver abscess. Crit Rev Diagn Imaging. 1992;33:29–58.
Laghi A, Iannaccone R, Rossi P, Carbone I, Ferrari R, Mangiapane F, et al. Hepatocellular carcinoma: detection with triple-phase multi-detector row helical CT in patients with chronic hepatitis. Radiology. 2003;226:543–9.
Ichikawa T, Kitamura T, Nakajima H, Sou H, Tsukamoto T, Ikenaga S, et al. Hypervascular hepatocellular carcinoma: can double arterial phase imaging with multidetector CT improve tumor depiction in the cirrhotic liver? AJR Am J Roentgenol. 2002;179:751–8.
Monzawa S, Ichikawa T, Nakajima H, Kitanaka Y, Omata K, Araki T. Dynamic CT for detecting small hepatocellular carcinoma: usefulness of delayed phase imaging. AJR Am J Roentgenol. 2007;188:147–53.
Iannaccone R, Laghi A, Catalano C, Rossi P, Mangiapane F, Murakami T, et al. Hepatocellular carcinoma: role of unenhanced and delayed phase multi-detector row helical CT in patients with cirrhosis. Radiology. 2005;234:460–7.
Baron RL, Brancatelli G. Computed tomographic imaging of hepatocellular carcinoma. Gastroenterology. 2004;127:S133–43.
Forner A, Vilana R, Ayuso C, Bianchi L, Solé M, Ayuso JR, et al. Diagnosis of hepatic nodules 20 mm or smaller in cirrhosis: prospective validation of the noninvasive diagnostic criteria for hepatocellular carcinoma. Hepatology. 2008;47:97–104.
Tublin ME, Dodd GD 3rd, Baron RL. Benign and malignant portal vein thrombosis: differentiation by CT characteristics. AJR Am J Roentgenol. 1997;168:719–23.
Stevens WR, Gulino SP, Batts KP, Stephens DH, Johnson CD. Mosaic pattern of hepatocellular carcinoma: histologic basis for a characteristic CT appearance. J Comput Assist Tomogr. 1996;20:337–42.
Kim TK, Lee KH, Jang HJ, Haider MA, Jacks LM, Menezes RJ, et al. Analysis of gadobenate dimeglumine-enhanced MR findings for characterizing small (1-2-cm) hepatic nodules in patients at high risk for hepatocellular carcinoma. Radiology. 2011;259:730–8.
Choi JW, Lee JM, Kim SJ, Yoon JH, Baek JH, Han JK, et al. Hepatocellular carcinoma: imaging patterns on gadoxetic acid-enhanced MR images and their value as an imaging biomarker. Radiology. 2013;267:776–86.
Chen L, Zhang L, Bao J, Zhang J, Li C, Xia Y, et al. Comparison of MRI with liver-specific contrast agents and multidetector row CT for the detection of hepatocellular carcinoma: a meta-analysis of 15 direct comparative studies. Gut. 2013;62:1520–1.
Koh DM, Ba-Ssalamah A, Brancatelli G, Fananapazir G, Fiel MI, Goshima S, et al. Consensus report from the 9(th) international forum for liver magnetic resonance imaging: applications of gadoxetic acid-enhanced imaging. Eur Radiol. 2021;31:5615–28.
Song KD, Kim SH, Lim HK, Jung SH, Sohn I, Kim HS. Subcentimeter hypervascular nodule with typical imaging findings of hepatocellular carcinoma in patients with history of hepatocellular carcinoma: natural course on serial gadoxetic acid-enhanced MRI and diffusion-weighted imaging. Eur Radiol. 2015;25:2789–96.
Lee MH, Kim SH, Park MJ, Park CK, Rhim H. Gadoxetic acid-enhanced hepatobiliary phase MRI and high-b-value diffusion-weighted imaging to distinguish well-differentiated hepatocellular carcinomas from benign nodules in patients with chronic liver disease. AJR Am J Roentgenol. 2011;197:W868–75.
Liver Reporting & Data System (LI-RADS®) https://www.acr.org/Clinical-Resources/Reporting-and-Data-Systems/LI-RADS. Accessed 2022-10-15.
Ichikawa T, Federle MP, Grazioli L, Madariaga J, Nalesnik M, Marsh W. Fibrolamellar hepatocellular carcinoma: imaging and pathologic findings in 31 recent cases. Radiology. 1999;213:352–61.
Ichikawa T, Federle MP, Grazioli L, Marsh W. Fibrolamellar hepatocellular carcinoma: pre- and posttherapy evaluation with CT and MR imaging. Radiology. 2000;217:145–51.
Yoon JK, Choi JY, Rhee H, Park YN. MRI features of histologic subtypes of hepatocellular carcinoma: correlation with histologic, genetic, and molecular biologic classification. Eur Radiol. 2022;32:5119–33.
Lim JH. Cholangiocarcinoma: morphologic classification according to growth pattern and imaging findings. AJR Am J Roentgenol. 2003;181(3):819–27.
Han JK, Choi BI, Kim AY, An SK, Lee JW, Kim TK, et al. Cholangiocarcinoma: pictorial essay of CT and cholangiographic findings. Radiographics. 2002;22:173–87.
Jhaveri KS, Halankar J, Aguirre D, Haider M, Lockwood G, Guindi M, et al. Intrahepatic bile duct dilatation due to liver metastases from colorectal carcinoma. AJR Am J Roentgenol. 2009;193:752–6.
Park S, Lee Y, Kim H, Yu MH, Lee ES, Yoon JH, et al. Subtype classification of intrahepatic cholangiocarcinoma using liver MR imaging features and its prognostic value. Liver Cancer. 2022;11:233–46.
Lee WJ, Lim HK, Jang KM, Kim SH, Lee SJ, Lim JH, et al. Radiologic spectrum of cholangiocarcinoma: emphasis on unusual manifestations and differential diagnoses. Radiographics. 2001;21 Spec No:S97–s116.
McIntyre CA, Girshman J, Goldman DA, Gonen M, Soares KC, Wei AC, et al. Differentiation of mucinous cysts and simple cysts of the liver using preoperative imaging. Abdom Radiol (NY). 2022;47:1333–40.
Buetow PC, Buck JL, Pantongrag-Brown L, Ros PR, Devaney K, Goodman ZD, et al. Biliary cystadenoma and cystadenocarcinoma: clinical-imaging-pathologic correlations with emphasis on the importance of ovarian stroma. Radiology. 1995;196:805–10.
Liu Z, Yi L, Chen J, Li R, Liang K, Chen X, et al. Comparison of the clinical and MRI features of patients with hepatic hemangioma, epithelioid hemangioendothelioma, or angiosarcoma. BMC Med Imaging. 2020;20:71.
Peterson MS, Baron RL, Rankin SC. Hepatic angiosarcoma: findings on multiphasic contrast-enhanced helical CT do not mimic hepatic hemangioma. AJR Am J Roentgenol. 2000;175:165–70.
Koyama T, Fletcher JG, Johnson CD, Kuo MS, Notohara K, Burgart LJ. Primary hepatic angiosarcoma: findings at CT and MR imaging. Radiology. 2002;222(3):667–73.
Miller WJ, Dodd GD 3rd, Federle MP, Baron RL. Epithelioid hemangioendothelioma of the liver: imaging findings with pathologic correlation. AJR Am J Roentgenol. 1992;159:53–7.
Alomari AI. The lollipop sign: a new cross-sectional sign of hepatic epithelioid hemangioendothelioma. Eur J Radiol. 2006;59:460–4.
Schima W, Kulinna C, Langenberger H, Ba-Ssalamah A. Liver metastases of colorectal cancer: US, CT or MR? Cancer Imaging. 2005, 5 Spec No A:S149–56.
Vilgrain V, Esvan M, Ronot M, Caumont-Prim A, Aubé C, Chatellier G. A meta-analysis of diffusion-weighted and gadoxetic acid-enhanced MR imaging for the detection of liver metastases. Eur Radiol. 2016;26:4595–615.
Lee MJ, Saini S, Compton CC, Malt RA. MR demonstration of edema adjacent to a liver metastasis: pathologic correlation. AJR Am J Roentgenol. 1991;157:499–501.
Elsayes KM, Kielar AZ, Agrons MM, et al. Liver imaging reporting and data system: an expert consensus statement. J Hepatocell Carcinoma. 2017;4:29–39.
Schima W, Heiken J. LI-RADS v2017 for liver nodules: how we read and report. Cancer Imaging. 2018;18:14.
Kielar AZ, Chernyak V, Bashir MR, et al. An update for LI-RADS: Version 2018. Why so soon after version 2017? J Magn Reson Imaging. 2019(50):1990–1.
Author information
Authors and Affiliations
Corresponding author
Editor information
Editors and Affiliations
Rights and permissions
Open Access This chapter is licensed under the terms of the Creative Commons Attribution 4.0 International License (http://creativecommons.org/licenses/by/4.0/), which permits use, sharing, adaptation, distribution and reproduction in any medium or format, as long as you give appropriate credit to the original author(s) and the source, provide a link to the Creative Commons license and indicate if changes were made.
The images or other third party material in this chapter are included in the chapter's Creative Commons license, unless indicated otherwise in a credit line to the material. If material is not included in the chapter's Creative Commons license and your intended use is not permitted by statutory regulation or exceeds the permitted use, you will need to obtain permission directly from the copyright holder.
Copyright information
© 2023 The Author(s)
About this chapter

Cite this chapter
Schima, W., Koh, DM. (2023). Focal Liver Lesions. In: Hodler, J., Kubik-Huch, R.A., Roos, J.E., von Schulthess, G.K. (eds) Diseases of the Abdomen and Pelvis 2023-2026. IDKD Springer Series. Springer, Cham. https://doi.org/10.1007/978-3-031-27355-1_7
Download citation
DOI: https://doi.org/10.1007/978-3-031-27355-1_7
Published:
Publisher Name: Springer, Cham
Print ISBN: 978-3-031-27354-4
Online ISBN: 978-3-031-27355-1
eBook Packages: MedicineMedicine (R0)