
Abstract
GHG emissions are usually the result of several simultaneous processes. Furthermore, some gases such as N2 are very difficult to quantify and require special techniques. Therefore, in this chapter, the focus is on stable isotope methods. Both natural abundance techniques and enrichment techniques are used. Especially in the last decade, a number of methodological advances have been made. Thus, this chapter provides an overview and description of a number of current state-of-the-art techniques, especially techniques using the stable isotope 15N. Basic principles and recent advances of the 15N gas flux method are presented to quantify N2 fluxes, but also the latest isotopologue and isotopomer methods to identify pathways for N2O production. The second part of the chapter is devoted to 15N tracing techniques, the theoretical background and recent methodological advances. A range of different methods is presented from analytical to numerical tools to identify and quantify pathway-specific N2O emissions. While this chapter is chiefly concerned with gaseous N emissions, a lot of the techniques can also be applied to other gases such as methane (CH4), as outlined in Sect. 5.3.
You have full access to this open access chapter, Download chapter PDF
Keywords
7.1 Introduction
In this chapter, we are presenting techniques utilising the stable isotope 15N to better understand the N cycle but more importantly to determine GHG gas fluxes that cannot be quantified or are difficult to quantify with any non-isotopic technique. The stable isotope 15N was discovered in the 1920s (Naudé 1929a, b) and the advantage of using this isotope in agriculture, for the determination of the N use efficiency has been recognised and applied since 1943 (Norman and Werkman 1943). Also, microbiologists have utilised the new possibilities that 15N can offer, to quantify the turnover rates of individual processes in the N cycle (Hiltbold et al. 1951) based on dilution principles (Kirkham and Bartholomew 1954). Moreover, 15N allowed for the first time the development of techniques to quantify the loss of N2 against a huge atmospheric N2 background (Hauck et al. 1958). Also, the identification which of the processes contributing to total N2O emissions (Butterbach-Bahl et al. 2013) is unthinkable without the use of advanced 15N tracing techniques (Müller et al. 2014). With the development of new and advanced analytical techniques, it is now possible to also use information on the position of the 15N (i.e. central, alpha and terminal, beta position) in N2O, i.e. the isotopomers (of one isotopologue), providing information on the origin without the addition of 15N labelled fertiliser. Note, isotopologues are molecules that differ in their isotopic composition, isotopomers are molecules with the same isotopic atoms but differing in their position, and isotopocules is the generic term for both isotopologues and isotopomers. There is a wealth of information that we can obtain from using diverse isotopic approaches based on 15N or 18O labelling but also on natural abundance techniques that take advantage of the different metabolism with which for instance N2O is produced. Thus, 15N provides us with a toolbox to identify emission pathways and in turn provides information on effective mitigation techniques.
7.2 15N Gas Flux Method (15N GFM) to Identify N2O and N2 Fluxes from Denitrification
7.2.1 Background
N2O reduction to N2 is the last step of microbial denitrification, i.e. anoxic reduction of nitrate (NO3−) to dinitrogen (N2) with the intermediates NO2−, NO and N2O (Firestone and Davidson 1989; Knowles 1982). Commonly applied non-isotopic techniques enable us to quantitatively analyse only the intermediate product of this process including NO and N2O, but not the final product, N2, a non-greenhouse gas. The challenge to quantify denitrification rates is largely related to the difficulty in measuring N2 production due to its spatial and temporal heterogeneity and the high N2-background of the atmosphere (Groffman et al. 2006). There are three principal ways to overcome this problem: (i) adding NO3− with high 15N enrichment and monitoring 15N labelled denitrification products (15N gas flux method, 15N GFM) (e.g. (Siegel et al. 1982)); (ii) adding acetylene to block N2O reductase quantitatively and estimating total denitrification from N2O production (acetylene inhibition technique, AIT) (Felber et al. 2012); (iii) measuring denitrification gases during incubation of soils in absence of atmospheric N2 using gas-tight containers and an artificial helium/oxygen atmosphere (HeO2 method; (Butterbach-Bahl et al. 2002; Scholefield et al. 1997; Senbayram et al. 2018)). Each of the methods to quantify denitrification rates in soils has various limitations with respect to potential analytical bias, applicability at different experimental scales and the necessity of expensive instrumentation that is not available for routine studies. Today the AIT is considered unsuitable to quantify N2 fluxes under natural atmosphere, since its main limitation among several others is the catalytic decomposition of NO in presence of O2 (Bollmann and Conrad 1997), resulting in unpredictable underestimation of gross N2O production (Nadeem et al. 2012). The 15N gas flux method requires homogenous 15N-labelling of the soil (Mulvaney and Vandenheuvel 1988) and under natural atmosphere, it is not sensitive enough to detect small N2 fluxes (Lewicka-Szczebak et al. 2013). Direct measurement of N2 fluxes using the HeO2 method is not subject to the problems associated with 15N-based methods (Butterbach-Bahl et al. 2013) but the need for sophisticated gas-tight incubation systems limits its use. When applying 15N GFM in the laboratory, sensitivity can be augmented by incubation under an N2-depleted atmosphere (Lewicka-Szczebak et al. 2017; Meyer et al. 2010; Spott et al. 2006). In the following, the basic principle, limitations, bias and application examples are presented and discussed.
7.2.2 Principles of the 15N Gas Flux Method
The 15N gas flux method consists of quantifying N2 and or N2O emitted from 15N-labelled NO3− applied to soil in order to quantify fluxes from canonical denitrification (Mulvaney and Vandenheuvel 1988; Stevens et al. 1993), where N2 and N2O are formed from the combination of two NO precursor molecules. Under certain preconditions, it is also possible to identify the production of hybrid N2 or N2O (i.e. molecules formed from the combination of N atoms from one source of oxidised N, e.g. NO2−), and another source of reduced N (e.g. NH3 or NH2OH) via anaerobic ammonia oxidation (annamox) or co-denitrification (Laughlin and Stevens 2002; Spott and Stange 2007; Spott et al. 2011). To quantify canonical denitrification, experimental soil is amended with NO3− highly enriched with 15N. The 15N gases evolved are collected in closed chambers and 15N emission is calculated from the abundance of N2 and N2O isotopologues in the chamber gas. 15N enrichment of N2 in the gas samples are typically close to natural abundance because the amount of N emitted from the 15N-labelled soil is small compared to the atmospheric background. Precise techniques of isotope analysis are, therefore, necessary.
7.2.2.1 The Non-random Distribution of Atoms in the N2 Molecule
The 15N gas flux method is based on the assumption that within N2 or N2O from a single source of a given 15N abundance, the N2O isotopologues of a distinct number of 15N substitutions follow a random (binomial) distribution, as given by the terms in (Eq. 7.1):
where p is the atom fraction of 14N, q the atom fraction of 15N and p + q is equal to unity (Hauck et al. 1958).
If N2O or N2 from two different N pools, one background pool of natural 15N abundance (0.3663 atom %) and the second enriched in 15N are mixed, the distribution deviates from the binomial pattern. Given the distribution of N2 or N2O isotopologues emitted from the first (background) N pool (abg) including non-labelled N2 and N2O (derived from the atmosphere and possibly non-labelled N2O from non-labelled N sources in soil) and the resulting mixture (am), the 15N abundance in the 15N-labelled second pool (ap) and the fraction of N2O or N2 originating from that labelled pool (fp) can be determined (e.g. Bergsma et al. 2001; Spott et al. 2006). To calculate fp values, the nitrogen isotope ratios 29R(29N2/28N2) and 30R(30N2/28N2) are used. In case of N2, the three isotopologues 14N14N and 14N15N and 15N15N are detected. For N2O, one option is to directly analyse intact N2O molecules, consisting of N and oxygen (O) and analysing molecular masses 44, 45 and 46. It has to be taken into account that these molecular masses include not only N- but also O-substituted isotopocules and thus the following 6 species: 14N14N16O with mass-to-charge (m/z) 44, 14N14N18O (m/z 46), the isotopomers 14N15N16O and 15N14N16O (both m/z 45), 14N14N17O (m/z 45) and 15N15N16O) (m/z 46). To calculate 15N pool-derived N2O, 29R and 30R of the N2O–N is calculated taking into account the natural abundance of 17O- or 18O-substituted isotopocules (14N14N18O and 14N14N17O) due to their mass overlap with the 15N-substituted isotopocules (Bergsma et al. 2001). Alternatively, N2O can be reduced to N2 prior to IRMS analysis (Lewicka-Szczebak et al. 2013), thereby allowing direct determination of 29R and 30R of N2O–N.
There are various calculation procedures that have evolved over time (Hauck et al. 1958; Mulvaney 1984; Arah 1992; Nielsen 1992, Well et al. 1998; Spott et al. 2006). In Eqs. 7.2 and 7.3 we show one example (Spott et al. 2006), where the fraction of N2 or N2O evolved from the 15N-labelled NO3− pool (fp) is calculated:
where \( a_{m} \) is the 15N abundance of the total gas mixture
and abg is the 15N abundance of atmospheric background N2.
The 15N abundance of the 15N-labelled nitrate pool undergoing denitrification is
where \( ^{30} x_{m} \) is the measured fraction of m/z 30 in the total gas mixture:
The same calculations can be used for N2 and N2O, resulting in respective values for fractions of pool-derived N (fp_N2; fp_N2O) and for the respective 15N abundances of the active N pools (ap_N2; ap_N2O).
If only m/z = 28 and m/z = 29 are determined during isotope analysis of N2, then emission of 15N2 is underestimated (Hauck et al. 1958). The extent of underestimation is related to the 15N atom fraction of the NO3− pool from which N2 is emitted (Well et al. 1998) and fp can thus be calculated if the 15N enrichment of the denitrified N pool is known (Mulvaney 1984):
where lower case sa and bg denote sample and background (typically ambient air), respectively. An alternative equation yielding fp from 29R that is more complex, but also more precise, is given by Spott et al. (2006).
In many studies, a 15N atom fraction of 0.99 was selected for the 15N enrichment of applied NO3− (15aNO3) in order to maximise 30R (see Fig. 7.1), thus yielding better 30R signals. However, there are also reasons to keep 15aNO3 between about 0.6 and 0.4, since 30R is only detectable with high fluxes due to a typical high IRMS background signal at m/z 30 (see next section), so that fp has to be calculated from 29R only using Eq. 7.6. But fp calculated from Eq. 7.6 with a given 29R is relatively insensitive to changes in ap between 0.4 and 0.6 since the nominator yields, e.g. for ap between 0.4 and 0.6, values between 0.48 and 0.5. Hence, uncertainty in the estimation of ap within that range causes minor uncertainty in calculated fp (Well and Myrold 1999).

Abundance of 28N2, 29N2 und 30N2 in air, in soil-emitted N2 evolved from NO3− with 50 atom% 15N, and in a 1:1000-mixture without and with randomisation of isotopologues by N2 dissociation, respectively
To illustrate how the combination of denitrification rates (i.e. fp) and homogenous or non-homogenous 15N enrichment of the soil NO3− pool affect instrumental raw data as well as calculated fp and ap values, some theoretical data are shown (Table 7.1). Three cases are represented, (1) the soil is homogenously labelled with 15N, (2) non-labelled soil-derived NO3− dilutes the labelled pool to a different extent in the 0 to 10 and 10 to 20 cm layers, but N2 and N2O production rates in both layers are equal and (3) like case (2) except that production rates of both layers differ. It can be seen that only case (1) calculated using Eq. 7.4 yields results identical to ideal ap and fp. Equation 7.6 gives deviating results when used with 15aNO3 as this value differs from ap. In the case of (2) and (3), all calculations lead to some deviation due to the non-homogeneity in label distribution. Moreover, isotope ratios show that even at the high denitrification rate assumed (case 2, 542 g N ha−1 20 cm−1 d−1), the increase in 29R (29Rm–29Ra) and 30R (30Rm–30Ra) was 9.2 × 10⁻⁶ and 3 × 10⁻⁶, respectively, and thus only about one order of magnitude above typical instrumental precision (see Table 7.2).
7.2.3 Identifying the Formation of Hybrid N2 and/or N2O
When N2 and N2O are formed from denitrification, both N atoms are derived from the 15N labelled pool, and in hybrid N2 or N2O only one N atom comes from the labelled pool (N oxides, i.e. NO2−) and the other one comes from non-labelled reduced N (e.g. NH3, NH2OH or organic N). Hence, the contribution of hybrid processes is reflected by an increase in 29R only, while denitrification increases both 29R and 30R (Clough et al. 2001). Laughlin and Stevens (2002) derived equations to calculate the fraction of hybrid and non-hybrid N2, assuming that the measured 15N atom fraction of NO3− also reflected the enrichment of the NO2− that contributed one N atom to the hybrid molecules, and that the 15N abundance of the non-labelled sources (atmospheric N and non-labelled reduced N) were identical. An extended approach was developed allowing to take into account different 15N enrichment for all contributing sources, i.e. different values for atmospheric and reduced N (Spott and Stange 2007; Spott et al. 2011). Spott et al. (2011) used those equations to calculate co-denitrification in a soil slurry but pointed out that the approach would be subject to possible bias due to difficulty and inaccuracy when determining the 15N enrichment of the nitrite (NO2−) pool contributing to the hybrid formation. For N2O mixtures consisting of N2O from only two sources, i.e. hybrid and non-hybrid N2O, the authors, therefore, suggest to use the indicator value Rbinom to assess the contribution of hybrid N2O. Rbinom reflects the fact that N2 or N2O isotopocules of each non-hybrid source contributing to a gas mixture are following a random (binomial) distribution, whereas this is not the case for the hybrid N2O. Rbinom values >1 indicate a significant hybrid contribution. While fluxes excluding hybrid N2O would always yield Rbinom ≤ 1, respective Rbinom values would not exclude the possibility of some hybrid contribution. Hence, Rbinom can only prove the existence (but not the absence) of hybrid fluxes. The limitation of this approach is that it does not work in the presence of additional sources, e.g. if there is N2O from unlabelled sources including atmospheric N2O. Thus, Rbinom does not work for N2 because there is always a high background of atmospheric N2. To our knowledge, systematic and quantitative studies on hybrid fluxes from soils, including quantification of average pool enrichment and its homogeneity or non-homogeneity, and estimation of resulting uncertainties, have not yet been accomplished.
7.2.4 Analysis of N2 and N2O Isotopologues
Precise quantification of N2 and N2O isotopocules requires isotope ratio mass spectrometry (IRMS) where 29R and 30R are obtained from ion current ratios detected at Faraday collectors tuned for m/z 28, 29 and 30 (e.g. Lewicka-Szczebak et al. 2013). A double collector IRMS was used before multi-collector IRMS became available. Double collector IRMS required two measurements with the IRMS so that either 29N2 or 30N2 is positioned on the first collector (Siegel et al. 1982). Emission spectroscopy has also been used in the past to detect 28N2, 29N2 and 30N2 (Kjeldby et al. 1987), but its relatively low precision enabled only detection of large N2 fluxes. While dual inlet IRMS had been used with manual measurement of samples in glass containers that were sealed (Well et al. 1993) or isolated by stopcocks (Siegel et al. 1982), continuous flow IRMS enables automated injection of samples from septum capped vials since the 1990s (Stevens et al. 1993). Recently, further progress was obtained by automated analysis of N2, N2+N2O and N2O in one run, including N2O reduction to N2 (Lewicka-Szczebak et al. 2013). The latter enables the analysis of N2O-N at m/z 28, 29 and 30, thus excluding the need to conduct 17O and 18O corrections, yielding better precision, since O corrections are biased to some extent by natural variation of 17O and 18O (Deppe et al. 2017).
While quantification of 29R is quite robust, 30R is affected by the mass overlap of 30N2 with the most abundant isotopocule of NO (14N16O), since NO+ is formed at the hot filament in the ion source of the IRMS (Brand et al. 2009, Siegel et al. 1982) due to the omnipresence of oxygen traces. NO+ formation can be quantified by the ratio between ideal and measured 30R of standard gases, giving values of 0.15 to 0.06 for atmospheric N2 analysed in the instrumentation proposed by Lewicka-Szczebak et al. (2013). NO+ formation can be minimised by removal of all O sources (O2, H2O) from the samples and also from the carrier and reference gases. In some types of IRMS the NO+ background is too high and associated with extreme tailing of the m/z 30 peak. This makes it impossible to quantify 30R (Well et al. 1993). To overcome this limitation, a procedure to quantify 30R indirectly from 29R was developed where 29R had to be analysed twice, (i) in samples where the non-random distribution of N2 isotopocules was randomised by the temporary splitting up of N2 molecules during a gas discharge (see change in 29R due to randomisation in Fig. 7.1). Discharge was actuated using a microwaves source, initially offline in sealed glass tubes, later with online continuous flow IRMS, where the discharge occurred in the gas circuit connecting and IMRS (Well and Meyer 1998). An overview of the IRMS precision for 29R and 30R in N2 standard gases is given in Table 7.2, showing that repeatability for 29R varied significantly between instruments, but 30R is comparable. However, it is also evident that during the last 35 years (Siegel et al. 1982) there has been no substantial improvement in the measurement precision.
7.2.5 Detection Limit for ap and fp
Because fp is calculated from two quantities, 29R and 30R, and the relationship between them depends on the 15N enrichment of the active N pool (ap, see Fig. 7.1), the limit of detection (LOD) for fp at given repeatability of 29R and 30R is variable. LOD for fp was thus determined for varying conditions using equations from Spott et al. (2006) using Monte Carlo modelling assuming a normal distribution of 29R and 30R errors (Standard deviation of repeated analysis of standard gas samples). The MS-Excel function norm.inv was used to create the normal distribution of values but allowing only a maximum deviation of 3 standard deviations, otherwise unrealistic outlier of 29R or 30R yield unrealistically high uncertainty. Different scenarios were tested (fp = 1 to 100 ppm; ap = 0.055 to 0.75 using repeatability for 29R and 30R of the first IRMS listed in Table 7.1). LOD is obtained for two cases: 1. Both 29R and 30R are taken into account to calculate both ap and fp; 2. fp is calculated using only 29R (using Eq. 7.4 in (Spott et al. 2006)) and ap is estimated either from soil extract analysis or from ap of N2O (e.g. Stevens and Laughlin 2002). Note that ap of N2O is usually much more reliable than ap of N2 since fp of N2O is typically large (often between 0.1 and 1) due to the fact that, in contrast to N2, N2O is an atmospheric trace gas. Conversely, fp of N2 is typically very small (usually <10−5 in ambient atmosphere).
The first calculation is preferable because ap of N2 and N2O can be different (see Fig. 7.3) and ap of N2O can only be obtained if N2O can be directly measured by IRMS, which is only the case if concentrations are high enough (about 0.3 to 3 ppm necessary, depending on 15N enrichment of N2O). Since incubation under N2-depleted atmosphere improves fp sensitivity, LOD is also given for an artificial gas mixture containing 2% N2.
LOD results are as follows (Table 7.3): with high fp (i.e. ≥10 ppm) and high ap (i.e. ≥0.5) and ideal IRMS performance (Table 7.2) both calculations yield precise results. Under N2-depleted atmosphere, LOD is excellent (2 to 7 ppb N2, last columns). With lowering of ap, LOD gets worse if ap has to be calculated using 30R. But without using 30R and assuming an ideal ap value or estimating ap of N2 from direct determination of ap of N2O, LOD of fp is still excellent. This is because with decreasing ap, abundance of 15N15N (30N2), and thus 30R, decreases exponentially whereas the decrease of 29R (29N2) is much slower (see Fig. 7.2).

Abundance of 28N2, 29N2 and 30N2 in N2 evolved from the 15N–labelled NO3– depending on ap (Siegel et al. 1982)
7.2.6 Limitations of the 15N Gas Flux Method (15N GFM)
The following factors limit the applicability of the 15N GFM
7.2.6.1 Inaccurate Definition of the Soil Volume Represented by Denitrification Measurements and Incomplete Recovery of Denitrification Gases
The denitrifying soil volume is clearly defined if soil cores are entirely labelled with 15N and are incubated in closed systems. However, in situ measurement of denitrification in surface soils or subsoils with approaches other than the core methods do not include complete enclosure of the investigated soil. It is not possible to control the application of 15NO3− accurately. Consequently, the soil volume represented by the detected denitrification gases is not exactly defined, and calculated denitrification rates are associated with uncertainty. Partial enclosure of the investigated soil is typically achieved by driving cylinders into surface soils. This option reduces the problem to a certain extent. Moreover, measuring the spatial distribution of the 15N label at the end of experiments (Well and Myrold 2002) helps to constrain the soil volume contributing to soil N2 fluxes that can be “seen” by 15N analysis of headspace gases.
An additional problem of open systems is the difficulty to determine the direction and strength of diffusional gas transport. When chamber methods are used to determine denitrification of surface soils, a significant fraction of the denitrification gases produced in the 15N-labelled soil diffuses into the subsoil and is thus not recovered in the chambers. Principally, this can be solved by modelling diffusion of 15N labelled gaseous denitrification products (see Sect. 7.2.7).
7.2.6.2 The Problem of Non-homogenous 15N Enrichment of the NO −3 Pool
An overview of techniques to supply 15N-labelled NO3– to the soil is given in Table 7.4. The 15N GFM is based on the assumption of an isotopically homogenous NO3– pool. Because this condition is rarely achieved in soils, underestimation of denitrification rates up to 30% can result (Arah 1992; Mulvaney and VandenHeuvel 1988). An initial homogeneity can be obtained by intensive mixing of the soil, but this is a massive disturbance with huge potential effects on N processes including denitrification dynamics and is only adequate to simulate soil tillage with similar disturbance. But even with initially ideal tracer distribution, non-homogeneity inevitably develops over time, since N transformations including nitrification, denitrification and immobilisation are never homogenous in structured soil where aerobic and anaerobic domains coexist and organic matter fractions of varying reactivity are unevenly distributed. Injection of 15N tracer solution (Wu et al. 2012) increases moisture and inevitably produces non-homogeneity with maximum label concentration at the injection spots. Saturation and drainage (Nõmmik 1956) or soil water displacement by irrigation of lysimeters (Well et al. 1993) leads to an interim increase in moisture and causes loss of DOC. Labelling with gaseous NO2 was not a suitable way to achieve high and homogenous enrichment of soil NO3− (Stark and Hart 1996). Consequently, non-homogeneity of the label distribution is probably the main source of bias of the 15N GFM. Often 15N tracer has been applied to the surface similar to conventional fertilisation (Baily et al. 2012). However, in this case, only fertiliser derived fluxes are detected initially, while during ongoing diffusion and leaching of NO3−, the 15N labelled NO3− pool rapidly changes its dimensions and thus non-homogeneity complicates the interpretation of results.
Possible causes and consequences of non-homogenous distribution of the 15N-label and denitrification /nitrification dynamics is illustrated using two conceptual models (Well et al. 2015). The first model shows how ap of N2 and N2O can differ due to non-homogeneity in 15N enrichment and also non-homogeneity in N2 and N2O production rates (Fig. 7.3). Even if equal amounts of 15N tracer solution could be applied to each soil layer, 15N enrichment of NO3− would be variable due to the different dilution of the label via soil-derived NO3−. Additionally, production rates of N2 and N2O and their ratio are typically spatially variable, which results in differing ap values for N2 and N2O (Fig. 7.4). The development of spatial heterogeneity in 15N enrichment and the consequences arising from the fact that nitrification and denitrification typically occur in different soil niches is shown with the second conceptual model (Fig. 7.4) that had been used to explain observations (Deppe et al. 2017). In that study, the soil had been mixed with 15N labelled NO3− and non-labelled NH4+ and isotopic values of initial NO3− and final NO3− and N2O had been compared. Results showed that ap of N2O was similar to initial enrichment of soil NO3− (13 atom% 15N), but final NO3− enrichment of the bulk soil was much lower (about 3 atom% 15N) whereas ap of N2O did not change significantly. This was postulated to result from the dilution of the label only in aerobic domains where nitrification occurred, whereas in anaerobic microsites there was no nitrification, and hence no dilution of the label. But the undiluted microsites produced all or most of the N2O whereas there was negligible N2O flux from aerobic domains. While this discrepancy between 15N enrichment of NO3− in the bulk soil and ap of N2O was certainly extreme in that study, similar process dynamics can be expected in many cases. Such non-homogeneity in label distribution and its dilution as well as N2 and N2O production leads to uncertainties in calculation of fp (see Table 7.1). But these examples also show that comparison of ap of N2 and ap of N2O can be used to identify heterogeneity in labelling and thus stress the importance of using analytical methods including 29R and 30R of N2 and N2O-N (Lewicka-Szczebak et al. 2013). Moreover, it shows that calculating fp based on 15N enrichment of bulk NO3− from soil extraction (Eq. 7.6) can lead to severe bias, since the 15N enrichment of the active pool can strongly deviate from the bulk pool. Moreover, an advantage of the non-random distribution approach with N2 and N2O is that non-homogeneity is indicated by discrepancies between ap of N2, ap of N2O and 15aNO3, which is quite useful (Lewicka-Szczebak and Well 2020). But it also shows that hybrid fluxes are difficult to identify if label distribution is non-homogenous.

Model 1 to explain why N2 and N2O from denitrification can originate from different effective 15N pools: In the lower pool with a higher 15N enrichment, N2 fluxes dominate over N2O,whereas the opposite is the case for the shallow pool with lower enrichment. Hence, emitted N2 is more enriched compared to emitted N2O

Model 2 to explain possible non-homogeneity in 15N-labelling of NO3− in NH4+-fertilised soil (Deppe et al. 2017). Colours represent enrichment (blue = nat abundance, red = max. 15N enrichment). a. Initial enrichment of NO3− results from mixing of soil NO3− and added 15N-NO3−. b. Initial homogenous distribution of labelled NO3− and non-labelled NH4+ in the soil matrix. c. In anaerobic microsites, nitrification is inhibited and the NO3− pool of initial 15N enrichment is denitrified and produces N2O of identical enrichment. In aerobic domains, nitrification of non-labelled NH4+ produces non-labelled NO3−, thus diluting the initial labelled NO3− pool and emitting unlabelled N2O. Note that the 15N enrichment of NO3− undergoing denitrification is larger than the average 15N enrichment of extracted NO3− and of emitted N2O
Further limitations of the 15N GFM have been reviewed previously (Aulakh et al. 1991; Groffman et al. 2006; Sgouridis et al. 2016). They include enhancement of denitrification by NO3− application in unfertilised systems, gas entrapment in very wet or fully water-saturated soils or sediment, and limited residence time of applied 15NO3−-N due to plant uptake and leaching.
7.2.6.3 Combining the 15N GFM with Modelling of Gross N Transformation
The current model to analyse data for the 15N GFM cannot be used to solve situations that include multiple labelled pools and heterogeneity of process activity and thus yield variable results in terms of flux quantification. Therefore, more complex models are needed to fill this gap. A 15N tracing model had been developed to analyse N2O dynamics in terrestrial ecosystems, which builds on previous tracing models for the quantification of the main mineral N transformations and soil nitrite (NO2−) dynamics (Müller et al. 2014). This model is thus a first step in taking more complex dynamics into account. Extending this approach to model heterogeneity of processes and pools might be a promising way to solve current limitations of the 15N GFM. For more information on the tracing technique see Sect. 7.5 of this chapter.
7.2.7 Evaluation of the 15N GFM
While quantification of N2 and N2O fluxes from distinct N pools remains a challenge after several decades of method development and improvement, this is even more the case for robust evaluation of methods, as this requires that the reference method is quantitative and is applied under the same conditions as the tested method. From that perspective, all previous tests included some uncertainties to our knowledge and were thus not fully able to evaluate the 15N GFM. There have been several comparisons between 15N GFM and AIT with controversial results, i.e. reporting general agreement (Aulakh et al. 1991) and severe underestimation by AIT (Arah et al. 1993; Sgouridis et al. 2016). Aulakh et al. (1991) compared 15N GFM and AIT in the field and found that 15N fertiliser derived N2 + N2O fluxes were comparable to total N2O fluxes in presence of acetylene (C2H2), suggesting that both methods were in general agreement. However, in all comparisons, 15N fertiliser was surface applied, so only the soil volume reached by the fertiliser contributed to the surface flux, unlike the AIT, were a larger soil volume was reached by the gaseous acetylene supplied by perforated pipes or buried calcium carbide. Hence comparisons did not reflect equal parts of the soil profile. Interestingly, in most comparisons denitrification was enhanced by soil compaction or glucose amendment, to achieve detectable 15N2 fluxes against the atmospheric N2 background. Sgouridis et al. (2016) compared closed chamber 15N GFM using needle injection to distribute K15NO3− evenly with the AIT “soil core” variant finding 3 to 5 times higher rates with 15N GFM. Kulkarni et al. (2014) conducted an extensive comparison of the HeO2 method using small cores (5 cm diameter × 5 cm height, incubated under HeO2 in the lab) with in situ measurement using the 15N GFM where KNO3− with 99 atom% was sprayed on the soil surface. Authors discussed difficulties to compare measurements in view of O2 manipulation in the lab and uneven label distribution in the field as well as variable moisture and temperature conditions in the field, and also that there are N2 fluxes from sources other than NO3− (Butterbach-Bahl et al. 2013). What is still needed for a quantitative evaluation of the 15N GFM is to incubate 15N-labelled soil in a HeO2 setup to allow direct comparison of GC- and IRMS based N2 fluxes.
If 15N GFM is conducted under conditions maximising sensitivity and minimising bias, it can be used to evaluate other methods as for example the N2O isotopocule approach to determine N2O reduction (Lewicka-Szczebak et al. 2017, Buchen et al. 2018) (see Sect. 7.3).
7.2.8 Lab and Field Experiments
Initial application of 15N GFM in lab incubations was carried out in closed vessels (Melin and Nõmmik 1983; Siegel et al. 1982). Recently, some studies used N2-depleted atmosphere to increase sensitivity in soil incubations (Lewicka-Szczebak et al. 2017; Schorpp et al. 2016) achieving sensitivities for pool-derived N2 of approximately 50 ppb which is thus comparable to GC sensitivity for N2O and two order of magnitude more sensitive compared to 15N GFM under ambient atmosphere. Important to note is that this also improves precision for quantifying ap and thus yields more precise estimates for the dilution of the denitrified pool by soil-derived NO3−.
A key feature of 15N GFM is in situ measurement of denitrification and today it must be considered the only available field method, since AIT has been found unsuitable (Felber et al. 2012; Nadeem et al. 2012; Sgouridis et al. 2016). But 15N GFM has been used far less compared to the AIT probably due to its low sensitivity and high effort and expense to keep high 15N labelling in the field for extended periods, and also because of the multiple sources of bias. 15N GFM has thus been primarily used for soil types and/or conditions with high denitrification potential, e.g. due to abundant organic C (e.g. in organic soils or after soil compaction Arah et al. 1993). Typically, experiments covered only certain phases of the year. Maybe the most extensive study (including an extensive review of past in situ measurements) was by Sgouridis et al. (2016) who conducted 15N GFM in 4 sites monthly during about 18 months. But it has recently been found that during field application of the 15N GFM, denitrification is severely underestimated because a large fraction of the labelled N2 and N2O produced is not emitted from into the soil surface but diffuses to the subsoil or accumulates in pore space (Well et al. 2019a). This was confirmed experimentally and production–diffusion modelling showed that under typical experimental conditions, denitrification rates would be underestimated by more than 50%. It was concluded that field surface fluxes of 15N-labelled N2 and N2O have been severely underestimated in the past, but that diffusion modelling can be used to correct data. Moreover, to overcome the poor sensitivity of in situ 15N GFM, a new procedure was developed to conduct the 15N gas flux method using artificial N2‐depleted atmosphere also for field application (Well et al. 2019b), giving a sensitivity for N2 + N2O fluxes up to 80‐fold better compared to the conventional 15N GFM under ambient atmosphere. Consequently, recent methodical improvements are promising to yield good progress in the study of denitrification control at the field scale. 15N GFM has been used extensively with water saturated cores of aquatic sediments, e.g. Enrich-Prast et al. (2015), where sensitivity is less critical due to the possibility to measure 15N-labelled N2 dissolved in pore water where atmospheric N2 background is small.
7.2.8.1 In Situ Measurement in Subsoil and Groundwater
Some modifications of the 15N GFM for subsurface applications had been proposed and applied. For water saturated subsoil of hydromorphic soils or deeper groundwater, the “push–pull” type experimental setup (Istok et al. 1997) was combined with 15N tracing (Addy et al. 2002; Well et al. 2003; Well and Myrold 1999), where 15N tracer solution is injected in groundwater wells and groundwater samples are subsequently extracted over time and analysed for 15N labelled N2 and N2O. Similar to using 15N GFM in water saturated sediment in the lab (see above, Enrich-Prast et al. 2015), this approach is quite sensitive since produced N2 mixes with the small N2 background of N2 dissolved in groundwater. The 15N push–pull approach has been compared to slurry incubations of aquifer samples in the lab (Eschenbach et al. 2015; Well et al. 2005) finding good agreement between both approaches. It has also been successfully applied for deeper groundwater up to 90 m depth (Eschenbach et al. 2015).
In the unsaturated zone, subsoil denitrification has been quantified in situ from the steady-state 15N2 + 15N2O concentration within a defined 15N-labelled soil volume (Well and Myrold 2002). Diffusion-reaction modelling has been used to quantify rates by fitting measured and modelled fp values, but accuracy of this approach was limited by the difficulty to quantify the volume of 15N-labelled soil, its gas diffusivity and its distribution in 15N enrichment.
7.2.9 Conclusions and Outlook
The 15N GFM is a powerful approach to quantify soil denitrification and its N2O/(N2 + N2O) mole ratio, to distinguish N2O fluxes derived from NO3− and other N sources and, under certain conditions, also to identify the formation of hybrid N2 and N2O fluxes. It is applicable in the lab as well as in the field. But it is based on a variety of assumptions and prerequisites that are not always easy or possible to validate or to fulfil. Therefore, and because of its high expense for isotope tracers, IRMS analysis and demanding experimental setups, it has until now rarely been used routinely to study denitrification. Moreover, systematic evaluation using independent methods, e.g. using the HeO2 method, is still pending. Progress has been made in automated IRMS approaches that can be established using commercially available devices with some custom-made modifications. While sensitivity was clearly improved in the lab by incubation under N2 depleted atmosphere, this has not yet been fully realised for field conditions. These are good reasons to intensify the use of 15N GFM in future N cycle research, since despite large efforts during preceding decades, the magnitude of denitrification is still the big unknown of the N cycle (Butterbach-Bahl et al. 2013; Müller and Clough 2014).
7.3 Isotopocule Techniques to Identify Pathway-Specific N2O Emissions
7.3.1 Introduction
N2O isotopocules are the chemically identical N2O molecules but differing either in the atomic mass due to a substitution of one atom with heavy isotope 15N or 18O (isotopologues: 14N14N16O; 15N14N16O; 14N14N18O), or in the location of 15N substitution (isotopomers: 14N15N16O; 15N14N16O) (Toyoda et al. 2017). Thus, the asymmetric NNO molecule has in total twelve distinct isotopocules, representing all possible combinations of the N isotopes 14N and 15N and the oxygen isotopes 16O, 17O and 18O and providing a wealth of interpretation perspectives. Most commonly the three isotopic characteristics (δ18O, δ15Nα and δ15Nβ) are measured, reporting the relative differences of isotope ratios of the four most abundant N2O isotopocules 14N14N18O/ 14N14N16O (δ18O), 14N15N16O/ 14N14N16O (δ15Nα) and 15N14N16O/ 14N14N16O (δ15Nβ) in relation to a measurement standard defined on an international isotope ratio scale, Air-N2 for 15N/14N and Vienna Standard Mean Ocean Water (VSMOW) for 18O/16O. The average of δ15Nα and δ15Nβ is referred to as δ15Nbulk and the difference between δ15Nα and δ15Nβ (i.e. δ15Nα–δ15Nβ) is called δ15N-site preference (δ15NSP), or commonly as SP (Toyoda and Yoshida 1999).
Natural abundance isotopic signatures can be used as an alternative approach to 15N tracing to constrain N2O transformations in the environment. Variations in stable isotope abundances are due to the fact that for many biotic and abiotic processes, the reaction rates differ between isotopic species, e.g. reduction of 15NO2− versus 14NO2−, leading to a so-called isotopic fractionation. As the isotopic fractionation is distinct for certain reaction pathways, isotopic signatures of particular production pathways and reduction fractionation factors determined in laboratory pure culture studies can be used to differentiate processes from each other. Distinct process information is provided by the difference in 15N substitution between the central and terminal position within the N2O molecule (SP), which is independent of the precursor’s isotopic composition and characteristic of specific reaction mechanisms or enzymatic pathways. The most common interpretation strategy used to date is the dual isotope plot, also known as “mapping” approach, presenting the relationship between two isotopic parameters–commonly δ18O/ δ15Nbulk, δ15NSP/ δ15Nbulk or δ15NSP/ δ18O. From such figures, estimates can be made about trends, probable dominance of particular pathways, or reduction progress (Toyoda and Yoshida 1999; Lewicka et al. 2017; Koba et al. 2009; Ibraim et al. 2019) (Fig. 7.5).
N2O isotopocules at natural abundance levels can be analysed by isotope ratio mass spectrometry (IRMS) (Toyoda and Yoshida 1999) and more recently mid-infrared (MIR) laser spectroscopic techniques.
With N2O isotopic analysis, the qualitative information can be added to the quantitative information gained from the concentration measurements. This is to naturally occurring differences between N2O from various origins as a result of isotopic fractionation, which causes enrichment or depletion of the reaction product in heavy isotope. Typically, for biochemical reactions we deal with the product depleted in heavy isotopes, but different biochemical pathways show characteristic isotope fractionation, which results in larger or smaller isotope effects (ε, difference between substrate and product (Eq. 7.7)), including also possible inverse isotope effects (product enriched in heavy isotopes, negative ε).
Isotope effect is often expressed as Δ values, representing the difference between δ values of product and substrate. The values of ε should be used for a particular chemical reaction or physical transformation and describe the characteristic isotopic fractionation for this process (so-called intrinsic isotope effects), whereas Δ values may also be applied to describe an isotopic change between initial substrate and the final product, which may be due to a chain of following reactions and diffusion. This is the case e.g. for denitrification where we can mostly only determine the overall observed isotope effect between NO3− and N2O (also called apparent or net isotope effect, Δ15NbulkN2O/NO3−) but without insight into intermediate products (NO2−, NO) we cannot determine the ε values of individual reduction steps.
Due to distinct isotopic fractionation for various biochemical reactions, the N2O isotopic studies have been often used to distinguish between different N2O production pathways, e.g., nitrification and denitrification (Cardenas et al. 2017; Deppe et al. 2017; Köster et al. 2015; Toyoda et al. 2011; Wolf et al. 2015), or between different microorganisms involved in N2O production, e.g. fungal and bacterial denitrification (Kato et al. 2013; Schorpp et al. 2016; Zou et al. 2014). Moreover, also N2O reduction can be potentially monitored by N2O isotopic data. The possible reduction of N2O to N2 during denitrification is associated with isotopic fractionation, which changes the isotopic signature of the residual N2O. Therefore, isotopic analyses of residual N2O can be used to estimate the magnitude of its reduction and thereby the N2 production (Kato et al. 2013; Lewicka-Szczebak et al. 2017; Toyoda et al. 2011). Comprehensive reviews on the use of N2O isotopocules to estimate N2O dynamics are given by Ostrom and Ostrom (2011), Decock and Six (2013), Toyoda et al. (2017) and Yu et al. (2020). The main problem in the interpretation of isotopocule analysis of emitted N2O is the parallel production, possibly from various pathways, and consumption due to reduction to N2.
7.3.2 Principles
For a proper interpretation of the analysed isotopic values of emitted N2O, both the possible production pathways and consumption due to N2O reduction to N2 must be taken into account.
To be able to identify potential production pathways, we need the basic data of the characteristic isotopic signatures for particular pathways, so called endmember values. These are obtained from the pure culture studies, where specific microorganisms are incubated separately and N2O is collected and analysed. Numerous pure culture studies are summarised in detail in the recent review papers (Denk et al. 2017; Toyoda et al. 2017). N2O isotopic signatures for specific pathways were also determined in controlled incubation of the whole soil by applying conditions favouring specific pathways. Such experiments were also summarised before (Denk et al. 2017; Toyoda et al. 2017). Here we present an overview of the most common pathways including results from pure culture studies and controlled soil incubations with some necessary critical selection explained below (after (Denk et al. 2017; Lewicka-Szczebak et al. 2017; Toyoda et al. 2017, Yu et al., 2020)). For each isotopic signature (δ15Nsp, δ18O, and δ15Nbulk) the rules how to properly use endmember values are explained and for each N2O production process the range of values (minimal and maximal literature reported value), the mean (of all literature reported values) and the median (of all literature reported values) is given.
δ15Nbulk of the produced N2O depends on the precursor isotopic signature, i.e. on soil NO3− for denitrification and soil ammonium for nitrification. Therefore, to compare any results with literature endmember values we need to calculate the N isotopic signature of the N2O in relation to the precursor, i.e. Δ15NbulkN2O/NO3− for denitrification and Δ15NbulkNH4+ for nitrification. Some pure culture denitrification studies also reported the isotope effect between nitrite and N2O (Δ15NbulkN2O/NO3−), especially for fungal denitrification, but for field studies, we usually analyse soil NO3−. By calculating isotope effects between N2O and N precursors one should be aware that the reaction progress changes the isotopic signature of the precursor: the more substrate is consumed, the more 15N enriched gets its residual pool. Therefore, the precursor N isotopic signature at the beginning and at the end of an experiment may differ depending on the reaction progress. Moreover, the δ15N of the measurable bulk N pools (by soil extraction) may deviate from the δ15N of the active N2O producing pools if the fractionating processes are heterogeneously distributed. This is especially the case in unsaturated soils where NO3− in anoxic microsites is denitrified and thus progressively enriched in 15N, while in aerobic domains nitrification adds NO3− at a lower 15Nbulk NO3− enrichment. Substantial deviation between bulk soil and active pool enrichment has been recently shown in tracer studies in the laboratory (Deppe et al. 2017) and in the field (Buchen et al. 2016). This indicates that the interpretation based on δ15Nbulk values is very complex and requires a good understanding of N transformation processes in the soil (see also Sect. 7.5).
The following endmember values can be considered:
-
heterotrophic bacterial denitrification: Δ15NbulkN2O/NO3- determined in pure culture studies from −37 to −10‰, mean −25‰, median −23‰ (Barford et al. 1999; Granger et al. 2008; Sutka et al. 2006; Toyoda et al. 2005). The controlled soil incubation experiments targeted for bacterial denitrification (the sole contribution from bacterial Denitrification was confirmed by δ15NSP values and 15N tracing) show much lower values from −52.8 to −39.2‰ (Lewicka-Szczebak et al. 2014).
-
nitrifier denitrification: Δ15NbulkNH4+ from −60.7 to −53.1‰, mean −56.9‰ (Frame and Casciotti 2010);
-
nitrification: Δ15NbulkNH4+ from −64 to −47‰, mean −57‰, median −57‰ (Mandernack et al. 2009; Sutka et al. 2006; Yoshida 1988);
-
fungal denitrification: Δ15NbulkN2O/NO3– from −46 to −31‰, mean −38‰, median −38‰ (Rohe et al. 2014). The study of Maeda et al. (2015) provides only data of the produced δ15Nbulk and not the isotope effect, therefore is not summarised here.
δ15Nsp of the produced N2O is independent of the precursor isotopic signature. Hence, unlike δ15Nbulk, the endmember values are identical in δ15Nsp of the produced N2O. Therefore, the measured N2O δ15Nsp values can be directly compared with the following endmember values:
-
heterotrophic bacterial denitrification: determined in pure culture studies from −7.5 to +3.7‰, mean −1.9‰, median −1.9‰ (Sutka et al. 2006; Toyoda et al. 2005). The values obtained in the controlled soil incubation experiments targeted for bacterial denitrification from −4.7 to +1.7‰ fit within the range given by pure culture studies (Lewicka-Szczebak et al. 2014);
-
nitrifier denitrification: from −13.6 to +1.9‰, mean −5.9‰, median −5.9‰ (Frame and Casciotti 2010; Sutka et al. 2006);
-
fungal denitrification: from 27.2 to 39.9‰, mean 33.5‰, median 33.6‰ (Maeda et al. 2015; Rohe et al. 2014, 2017; Sutka et al. 2008). A recent study indicated also a lower δ15Nsp value for one individual fungal species, which was disregarded here due to its very low N2O production: C. funicola showed δ15Nsp of 21.9‰ but less than 100 times lower N2O production with nitrite compared to other species, and no N2O production with NO3− (Rohe et al. 2014). Similarly, from the study of Maeda et al. (2015), only the values of strains with higher N2O production were accepted for this summary (>10 mg N2O-N g−1 biomass).
-
nitrification: from 32.0 to 38.7‰, mean 35.0‰, median 34.6‰ (Frame and Casciotti 2010; Heil et al. 2014; Sutka et al. 2006).
δ18O depends on the isotopic signature of several possible precursors: NO3−, NO2−, H2O and O2. For oxic processes like nitrification the incorporation of O2 is important (Snider et al. 2011) whereas for anoxic processes the O of the substrate or of soil water can be incorporated in N2O. Theoretically, during nitrification (hydroxylamine oxidation) O in N2O originates from O2 and during denitrification O from NO3− should be transferred to N2O. But this is additionally complicated by the exchange of O atoms between soil water and denitrification intermediates (Kool et al. 2007). The extent of this exchange differs for various bacterial and fungal species (Rohe et al. 2017), but it has been shown recently that for soil incubations it is rather high (Lewicka-Szczebak et al. 2016). Therefore, soil water isotopic signatures show the largest impact on the final δ18O values of N2O, hence it was suggested to present the results as Δ18ON2O/H2O if dealt with denitrification (Lewicka-Szczebak et al. 2016). However, in pure culture studies, this rule works for fungal denitrification but not very well for bacterial denitrification where NO3− plays an important role as a precursor for O atoms in N2O (Rohe et al. 2017). Because of different patterns for different processes, we present a summary of the measured, uncorrected δ18O values and additionally for denitrification we also show Δ18ON2O/H2O values.
-
heterotrophic bacterial denitrification based on controlled soil incubations: from 4.8 to 18.4‰, mean 10.4‰, median 10.2‰ (Lewicka-Szczebak et al. 2016, 2014). For heterotrophic bacterial denitrification, it is more reasonable to use the values of the controlled soil incubations (from 4.8 to 18.4‰) because pure culture studies show a large range of possible values (from 7.3 to 46.5‰ (Rohe et al. 2017; Sutka et al. 2006; Toyoda et al. 2005)) due to variable O-exchange with ambient water depending on the bacterial strain, whereas soil incubations indicated that this exchange is high (Kool et al. 2007; Snider et al. 2013) and the isotope effect between water and formed N2O quite stable (Lewicka-Szczebak et al. 2016). The values calculated versus soil water (Δ18ON2O/H2O) show a much narrower range from 16.7 to 23.3‰, mean 19.2‰, median 19.0‰ (Lewicka-Szczebak et al. 2016, 2014).
-
nitrifier denitrification was determined in two pure culture studies (Frame and Casciotti 2010; Sutka et al. 2006). Frame and Casciotti (2010) provide the value in relation to nitrite δ18ON2O/NO2 of −8.4 ± 1.4‰. However, δ18O of N2O originating from nitrifier denitrification is mostly governed by δ18OH2O due to reaction stoichiometry and additional O-exchange between water and nitrification intermediates (Frame and Casciotti 2010; Kool et al. 2010), and hence it is reasonable to express the isotope effect in relation to water, similarly as for bacterial denitrification. Based on the values presented in supplementary materials of Frame and Casciotti (2010) this value can be recalculated in relation to water giving the range of δ18ON2O/H2O from 12.4 to 19.4‰ (Frame and Casciotti 2010). Sutka et al. (Sutka et al. 2006) provide a raw δ18ON2O of 10.8 ± 0.5‰. Assuming the probable δ18OH2O between −8 and −4‰, the calculated δ18ON2O/H2O between 14.3 and 19.3‰ fits well within the defined range from (Frame and Casciotti 2010).
-
fungal denitrification from 31.2 to 45.7‰, mean 36.8‰, median 36.6‰ (Maeda et al. 2015; Rohe et al. 2014, 2017; Sutka et al. 2008). The values calculated versus soil water (Δ18ON2O/H2O) range from 42.0 to 55.1‰, mean 47.2‰, median 46.9‰ (Rohe et al. 2014, 2017; Sutka et al. 2008). The study of Maeda et al. (2015) provide only data of the produced δ18O without the O isotope signature of water, therefore the Δ18ON2O/H2O values cannot be given.
-
nitrification determined in nitrifier cultures incubated with NH3 reported the δ18ON2O values close to atmospheric oxygen of 23.5 ± 1.3‰ (Sutka et al. 2006). Frame and Casciotti (2010) determined a slight isotope effect resulting in δ18ON2O/O2 of −2.9‰. Hence, for this process, the δ18ON2O range of 23.5 ± 3‰ can be accepted (Frame and Casciotti 2010; Sutka et al. 2006). For the plots in Fig. 7.5, the δ18ON2O values are shown, which were determined in experiments utilising the air δ18OO2 of 23.5‰. For each case study where deviations from the typical O2 value are known (e.g. due to consumption in water column), these values should be expressed relative to the actually measured δ18OO2.
The most common way of identifying various N2O producing pathways is a graphical presentation of the measured values together with the literature endmember values. From the graphs, we can often identify the dominant pathway. To obtain more precise quantitative information, the contribution of a pathway (A) can be calculated based on the measured N2O isotopic signature (δN2O) using the isotope mass balance:
It must be noted that for this calculation (Eq. 7.8), the δN2O value may not be changed due to N2O reduction. This is only fulfilled if reduction is inhibited, measured to be negligible or included in calculations as described below. Using one isotope signature (δ15Nbulk, δ15Nspor δ18O), we are able to determine the mixing ratios of two pathways. Applying more isotopic signatures can theoretically enable quantification of more pathways. However, the results are not very exact due to the sometimes wide ranges of possible isotopic values for different pathways and overlapping of these ranges for more pathways. For both, δ15Nsp and δ18O, the ranges for heterotrophic bacterial denitrification and nitrifier denitrification. Additional interpretation of δ15Nbulk can further help but is often problematic due to lacking information on precursor isotope values (Lewicka-Szczebak and Well 2020). To increase precision of such calculations, controlled soil incubations with the soil under study may help to determine more narrow ranges of endmember values characteristic for the particular soil (Lewicka-Szczebak et al. 2017).
But besides the mixing processes also isotopic fractionation during N2O reduction changes the final isotopic value of the residual N2O. During N2O reduction to N2 (the last step of bacterial denitrification) preferentially the N-O bonds between light isotopes (14N and 16O) are broken and as a result the residual unreduced N2O is enriched in 15Nα and 18O. In consequence, δ15Nsp, δ18O and δ15Nbulk values of residual N2O increase with progressing reduction. The magnitude of the shift towards higher values depends on the amount of reduced N2O and the isotopic fractionation factor associated with the N2O reduction. Hence, if we know the fractionation factor and the δ value of initially produced N2O before reduction (δ0), we can calculate the amount of reduced N2O and thereby determine the magnitude of N2 flux based on the measured δ value of the residual N2O after reduction (δr). This is calculated according to the following isotopic fractionation Eqs. 7.9 to 7.11 by applying Rayleigh model that is valid for closed systems, either in its exact form (Mariotti et al. 1981):
or in simplified, approximated form:
where δr is the residual N2O isotopic signature, after reduction, δo is the initial N2O isotopic signature, before reduction, εN2-N2O is the isotopic fractionation factor associated with N2O reduction and rN2O is the residual unreduced N2O fraction (rN2O = yN2O/(yN2 + yN2O); (y: mole fraction))
The application of the closed system model has been confirmed by several studies (Köster et al. 2015; Lewicka-Szczebak et al. 2017, 2014). However, it was also suggested that an isotopic fractionation model for open systems could be suitable (Decock and Six 2013), which is associated with smaller apparent isotope effects during N2O reduction:
To be able to determine rN2O from N2O isotopic values of individual samples according to the above equations, isotopic fractionation factor associated with N2O reduction to N2 (εN2-N2O) must be known. They were determined in numerous studies in controlled soil incubations (Jinuntuya-Nortman et al. 2008; Lewicka-Szczebak et al. 2014; Menyailo and Hungate 2006; Ostrom et al. 2007; Well and Flessa 2009) and the following ranges were obtained:
-
ε15NbulkN2-N2O from −11.0 to −1.8‰ with a mean of −7.1‰ and median −7.0‰
-
ε15NspN2-N2O from −8.2 to −2.9‰ with a mean of −5.9‰ and median −6.0‰
-
ε18ON2-N2O values from −25.1 to −5.1‰ with a mean of −15.4‰ and median −15.9‰
In the summary, we disregarded one study which provided an inverse isotope effect for ε15NbulkN2-N2O and ε18ON2-N2O (Lewicka-Szczebak et al. 2014). These values might have been a result of untypical reduction conditions in the experiment or an experimental artefact (Denk et al. 2017), therefore, they are neglected here. From the study of Lewicka-Szczebak et al. (2015) only the data of moderate reduction (from Pool1) were summarised here, because it was shown that by very intensive reduction the results can be strongly affected by N2O diffusion. This depends on the balance between diffusive and enzymatic fractionation during N2O reduction (Lewicka-Szczebak et al. 2014). By nearly complete N2O reduction, we observe a relatively large impact of diffusive N2O fractionation, resulting in residual N2O more depleted in heavy isotopes, hence the apparent isotope effects are significantly lower, i.e. −2.7‰, −1.5‰, and −2.0‰ for ε15NbulkN2-N2O, ε15NspN2-N2O, and ε18ON2-N2O, respectively (Lewicka-Szczebak et al. 2015).
It is often problematic to separate the impact on the final N2O isotopic values by the mixing endmember for the produced N2O and by the isotopic fractionation due to N2O reduction. The interpretations and calculations based on N2O isotopic studies are difficult when we deal with the simultaneous variations in rN2O and δ0 values. Usually, to calculate rN2O a stable δ0 is assumed (Lewicka-Szczebak et al. 2015) and to precisely determine temporal changes in δ0, we need independent data on rN2O (Köster et al. 2015). In field studies, both rN2O and δ0 cannot be determined precisely, but the possible ranges for each parameter can be given (Zou et al. 2014).
It is often attempted to distinguish between mixing and fractionation processes by using the changes in the isotopic signatures and their relations: δ15Nsp/δ18O, δ15Nsp/δ15Nbulk, δ18O/δ15Nbulk. These relations differ for the N2O reduction process and for mixing processes due to differences in the respective isotope effects. From literature data on N2O reduction fractionation factors (Jinuntuya-Nortman et al. 2008; Lewicka-Szczebak et al. 2014; Menyailo and Hungate 2006; Ostrom et al. 2007; Well and Flessa 2009) the following ratios are determined:
-
ε15NspN2-N2O/ε18ON2-N2O from 0.23 to 0.98 with a mean of 0.45 and median 0.36
-
ε15NspN2-N2O/ ε15NbulkN2-N2O from 0.51 to 2.78 with a mean of 0.96 and median 0.77
-
ε18ON2-N2O/ ε15NbulkN2-N2O values from 1.02 to 3.83 with a mean of 2.21 and median 2.25.
Although the range of possible εN2-N2O variations is quite large, it has been shown recently that the mean values and typical ε15NspN2-N2O/ ε18ON2-N2O ratios are well applicable for oxic or anoxic conditions unless N2O reduction is almost complete, i.e. the ratio N2O/(N2 + N2O) < 0.1, meaning more than 90% of N2O was reduced (Lewicka-Szczebak et al. 2015).
For comparison, here are the relations between isotopic signatures of emitted N2O resulting from mixing processes calculated based on literature ranges for mixing endmembers given above. Because of the overlapping endmember ranges, we cannot distinguish between all individual pathways, and we determine the slopes of mixing lines between selected endmember values (Figs. 7.5 and 7.6) as follows:

Scheme of the δ15Nsp/ δ18O mapping approach to simultaneously estimate the possible range of N2O reduction and the admixture of nitrification. The endmember values are shown according to the citations provided in the text. Note that δ5N values are given in relation to N substrate, which should be determined for the particular study (here 0‰ for both NO3− and NH4+ was assumed). Here the mixing of bacterial denitrification and nitrification is considered. The method can be applied for other selected processes (Zou et al. 2014)

Scheme of the δ15Nsp/ δ18O mapping approach to simultaneously estimate the magnitude of N2O reduction and the admixture of fungal denitrification (or nitrification). The endmember values are shown according to the citations provided in the text. Note that δ18O values are given in relation to water and to air oxygen (for nitrification). Here the mixing of bacterial denitrification and fungal denitrification is considered. The method can be applied for other selected processes
-
mixing between heterotrophic bacterial denitrification and nitrification:
-
δ15NSP/ δ18O from −10.5 to 4.8 with a mean of 6.1;
-
δ15NSP/ δ15Nbulk from −4.6 to −0.5 with a mean of −1.2;
-
δ18O/ δ15Nbulk from −1.0 to 0.1 with a mean of −0.1.
-
-
mixing between heterotrophic bacterial denitrification and fungal denitrification:
-
δ15NSP/ δ18O from 1.1 to 1.4 with a mean of 1.3;
-
δ15NSP/ δ15Nbulk from −3.9 to 7.9 with a mean of −2.7;
-
δ18O/ δ15Nbulk from −2.8 to 6.4 with a mean of −2.2.
-
Fungal denitrification cannot be distinguished from relations including δ15Nbulk because of the overlapping range with bacterial denitrification (see Fig. 7.5). Anyway, relations including δ15Nbulk are difficult to use due to dependence of this isotope value on the precursor, which differ for nitrification and denitrification. Here the relationships must be determined with isotope effect for δ15Nbulk, i.e. using Δ15Nbulk(N2O/NH +4 ) for nitrification and Δ15Nbulk( N2O/NO −3 ) for denitrification (see x-axis in Fig. 7.5). Often the isotopic signatures of the precursors are not known, which make the interpretation of δ15Nbulk values rather ambiguous. Nevertheless, some studies apply the δ15Nsp/ δ15Nbulk isotope maps for distinction of mixing and fractionation processes, but for such isotope maps, systematic changes in δ15Nbulk induced by systematic changes in the N isotopic composition of one of the precursors NH4+ or NO3− could be misinterpreted as reduction events (Well et al. 2012; Wolf et al. 2015). Hence, the careful monitoring of precursor isotopic signatures is needed (Zou et al. 2014).
A δ15Nsp/ δ15Nbulk isotope mapping approach allowing for assessment of minimal and maximal reduced N2O fraction and nitrification and denitrification mixing ratios was proposed by Zou et al. (2014) (Fig. 7.5). Such an approach is most often used for distinguishing between nitrification and bacterial denitrification only. However, other cases have also been analysed (Zou et al. 2014). The calculation method presented (Fig. 7.5) assumes first mixing of N2O from different endmembers and afterwards its partial reduction. Two mixing lines are defined–for the minimum and maximum values for both endmembers as well as two reduction lines–with maximal and minimal slope. From the intercept 1 the maximal denitrification contribution is determined whereas from the intercept 2 the minimal one. Based on the difference between the sample point and intercept 1 or 2 the reduction contribution, respectively, maximal and minimal, is also determined. However, it must be noted that in case of significant admixture of fungal denitrification or nitrifier denitrification the results may be biased.
The application of δ15Nsp/ δ18O isotope mapping approach may be easier since δ15Nsp and δ18O values are more stable in time (Lewicka-Szczebak et al. 2017; Wu et al. 2019), and δ18O values show narrower endmember ranges when compared to δ15N values. The distinction of mixing and fractionation processes is based on the different slopes of the mixing lines and the reduction line (Fig. 7.6).
Isotopic values of the samples analysed are typically located between these two, reduction and mixing, lines. Here we defined only one mixing line for the median values of bacterial and fungal denitrification and one reduction line with a mean slope. From sample’s, location, we can estimate the impact of fractionation associated with N2O reduction and admixture of N2O originating from fungal denitrification. We can deal with two scenarios:
-
(i)
Scenario 1: the N2O emitted due to bacterial denitrification is first reduced (point move along reduction line up to the intercept 1 with dashed mixing line) and then mixed with the second endmember (point move along dashed mixing line to the measured sample point).
-
(ii)
Scenario 2: the N2O from two endmembers is first mixed (point move along mixing line up to the intercept 2 with dashed reduction line) and only afterwards the mixed N2O is reduced (point move along dashed reduction line to the measured sample point).
While both scenarios yield identical results for the admixture of N2O from fungal denitrification, the resulting reduction shift, and hence the calculated rN2O value, is higher when using Scenario 2. It is still not clear which scenario is more realistic. The uncertainty analysis of this method has been recently presented by Wu et al. (2019) and this approach has been successfully applied in the field case studies (Buchen et al. 2018; Ibraim et al. 2019; Verhoeven et al. 2019). However, after the appearance of those publications, it has been found that other δ18O values should be applied for nitrification (Yu et al., 2020). This summary reports the most current choice of endmember ranges, which differ from those presented recently (Buchen et al. 2018; Ibraim et al. 2019; Lewicka-Szczebak et al. 2017; Verhoeven et al. 2019; Wu et al. 2019).
7.3.3 Analysis of N2O Isotopocules by IRMS
The most common method for N2O isotopocule analysis is isotope ratio mass spectrometry (IRMS). In order to perform N2O isotopic analysis the gas samples need to be purified, and N2O must be separated and pre-concentrated. First, water and CO2 are removed by chemical traps, and then N2O is concentrated with liquid N traps. Afterwards, the gases are separated with gas chromatography and finally introduced in the isotope ratio mass spectrometer.
In the mass spectrometer, N2O isotopocule values are determined by measuring m/z 44, 45 and 46 of the intact N2O+ ions as well as m/z 30 and 31 of NO+ fragment ions. This allows the determination of average δ15N (δ15Nbulk), δ15Nα (δ15N of the central N position of the N2O molecule), and δ18O (Toyoda and Yoshida 1999). δ15Nβ (δ15N of the peripheral N position of the N2O molecule) is calculated from δ15Nbulk = (δ15Nα + δ15Nβ) / 2 and 15N site preference (δ15Nsp) from δ15Nsp = δ15Nα–δ15Nβ. Since the IRMS approach was developed simultaneously by two groups (Brenninkmeijer and Röckmann 1999; Toyoda and Yoshida 1999), two different nomenclatures had been introduced for the two positions of N2O-N. Hence, in some studies, the peripheral (β) position is referred to as 1- and the central (α) as 2-position (Brenninkmeijer and Röckmann 1999). The scrambling factor resulting from the exchange of 15N atoms on the ion source must be taken into account. The magnitude of the scrambling factor should be determined individually for each mass spectrometer (Röckmann et al. 2003). Also, 17O-correction should be taken into account, because 17O substitution is indistinguishable from 15N, therefore typical terrestrial 17O content (0.528) is assumed (Kaiser and Röckmann 2008).
Up to now, there are still no internationally agreed gaseous N2O reference materials for N2O isotopocule analyses. Usually, the laboratories calibrated pure N2O gas for isotopocule analyses in the laboratory of the Tokyo Institute of Technology according to the method of Toyoda and Yoshida (1999). Recently, the first interlaboratory comparison has been performed and now the standards from this study (REF1, REF2) are available for the laboratories and allow the performing of two-point calibration for δ15Nsp values (Mohn et al. 2014). This intercalibration study has shown that the two-point calibration method is necessary to obtain accurate δ15Nsp values. Recently, two N2O standards had been tested in a further interlaboratory comparison (Ostrom et al. 2018) and is available from United States Geological Survey (USGS).
The sample volume needed for the N2O isotopocule depends on the concentration and is about 100 ml for ambient N2O concentration samples (about 300 ppb) and about 10 ml for N2O concentration of above two ppm.
7.3.4 Laser Spectroscopic Analysis of N2O Isotopomers to Differentiate Pathways
The invention and availability of non-cryogenic light sources in the mid-infrared (MIR) spectral range (Brewer et al. 2019) coupled with different detection schemes such as direct absorption quantum cascade laser absorption spectroscopy (QCLAS) (Mohn et al. 2010, Mohn et al. 2012, Wächter et al. 2008), cavity ring down spectroscopy (CRDS) (Erler et al. 2015) and off-axis integrated-cavity-output spectroscopy (OA-ICOS) (Wassenaar et al. 2018) has provided sensitive and field-deployable laser spectroscopic analysers for N2O isotopocule analysis. These instruments can analyse the N2O isotopic composition in gaseous mixtures (e.g. ambient air) in a flow-through mode, providing real-time data with minimal or no sample pre-treatment, which is highly attractive to better resolve the temporal complexity of N2O production and consumption processes. Most importantly, MIR laser spectroscopy is selective for 17O, 18O and position-specific 15N substitution due to the existence of characteristic rotational-vibrational spectra (Gordon et al. 2017).
Therefore, laser spectroscopy has the potential to open a new field of research in the N2O biogeochemical cycle, but, applications remain challenging and are still scarce for the following main reasons: (1) laser spectrometers as any analytical instrument are subject to drift effects, in particular under fluctuating environmental conditions, limiting their performance (Werle et al. 1993); (2) changes in N2O concentration affect N2O isotope results when using the δ-calibration approach (Griffith 2018); (3) laser spectroscopic results are affected by mole fraction changes of atmospheric background gases (N2, O2, and Ar), called gas matrix effects, due to the difference of pressure-broadening coefficients, and potentially by spectral interferences from other atmospheric constituents (H2O, CO2, CH4, and CO, etc.), called trace gas effects, depending on the wavelength region used in an instrument. Spectral interferences are particularly pronounced for N2O due to its low atmospheric abundance in comparison to other trace gases; (4) only since recently two pure N2O isotopocule reference materials (USGS51, USGS52) have been made available through the United States Geological Survey (USGS) (Ostrom et al. 2018), which was identified as a major reason limiting interlaboratory compatibility (Köster et al. 2013; Mohn et al. 2014, 2016).
In a recent study, the most common commercially available N2O isotope laser spectrometers were carefully characterised for their dependence on N2O concentration, gas matrix composition (O2, Ar) and spectral interferences caused by H2O, CO2, CH4 and CO to develop analyser-specific correction functions. In addition, the authors suggest a step-by-step workflow that should be followed (Fig. 7.7) by researchers to acquire trustworthy N2O isotopocule results using laser spectroscopy (Harris et al. 2020).

Workflow to acquire trustworthy N2O isotopocule results using laser spectroscopy (Harris et al. 2020)
7.3.5 Hands-on Approach to Use a CRDS Isotopic N2O Analyser
Introduction
As an example, the Picarro G5101-i analyser can be used to determine N2O concentration, 15Nbulk isotope ratios and isotopomer values (15Nα and 15Nβ) by continuous or discrete sample measurement. Small volume discrete samples (≤20 ml) can be measured using the SSIM (small sample isotope module) (see also Sect. 5.3.) peripheral unit in conjunction with the Picarro G5101-i analyser. The G5101-i analyzer is the predecessor of the current G5131-i analyzer which also measures δ18O in addition to δ15Nbulk, δ15Nα and δ15Nβ. The SSIM can also be used to dilute samples. Larger volume samples (e.g. Tedlar bags) can be measured by direct input into the G5101-i analyser or through the 16-port distribution manifold. The 16-port distribution manifold allows for partial automation of measurement and can be used in conjunction with the SSIM for smaller volume samples (see also Fig. 5.5 that illustrates the coupling of a 16-port manifold and a SSIM). The SSIM can also be used to dilute samples.
Principle
Samples are measured using mid-IR laser by CRDS (cavity ring down spectroscopy). Measurement precision increases with measurement time. Several options are available for delivery of N2O samples into the analyser and how long measurements take. Sample volume and the required precision of measurements should be considered to decide which operational set up is the most appropriate.
Apparatus
-
Picarro G5101-i isotopic N2O analyser and pump.
-
Picarro SSIM peripheral unit.
-
Picarro 16-port distribution manifold.
-
Gas-tight syringe.
-
Pressure regulators.
-
Stainless steel tubing.
-
Swagelock fittings.
-
Injector nut for SSIM.
Consumables
-
Zero Air.
-
N2O working standards.
-
Septa for injector nut on SSIM.
-
Septa capped vials for discrete gas samples.
-
Tedlar bags for larger volume gas samples.
-
Side port needles for sample injection to SSIM.
Sampling
For discrete gas samples follow a suitable sampling procedure as outlined by De Klein and Harvey (2012). Small volume samples (≤20 ml) should be stored in septum capped vials, ensuring to overpressure when filling to prevent inward contamination by ambient air. Vials can be stored in a cool dry place. Larger volume samples in Tedlar bags should be measured ASAP as storage reliability decreases greatly after 24–48 h.
Operational Procedure
-
To start the analyser, ensure the power switches are on for the pump, analyser and monitor. Turn the power switch at the rear of the analyser from O to I. NB: the power switch on the pump should always be in the on position, the pump will power up when the analyser is turned on. To turn on the analyser press the button on its front. Windows will load on the monitor and the analyser software will run through the system checks.
-
When the analyzer is in startup mode, monitor the liquid coolant at the back of the analyzer. You should observe little to no bubbles and the fluid should be flowing. If the bubbles have not disappeared after a few minutes or the liquid is not flowing, refer to the troubleshooting section in this document.
-
After the system checks are complete, the GUI (Graphical User Interface) will appear. It will begin by measuring the Cavity Pressure, DAS (Data Acquisition System, i.e. the analyser) temperature and Etalon temperature. Once the correct temperatures and pressures are reached a message will appear on the bottom of the GUI screen; e.g. “Pressure locked”, “Cool Box Temperature locked”, “Preparing to measure”, Measuring…”. The GUI will then begin to show the continuous N2O measurements in real time. It may take up to 1 h for the analyser to begin N2O measurements. Before measuring samples, allow the laser to stabilise for up to 24 h by measuring room air.
-
Continuous samples (e.g. incubation experiments) can be measured by directly connecting a piece of tubing from the sampling container to the inlet at the back of the analyser and segmenting the data into the respective time periods.
Discrete samples (≤20 ml)
-
To measure small volume discrete samples (≤20 ml) allow the laser to run continuously for 24 h to ensure that the laser has been given sufficient time to stabilise.
-
Before operating the SSIM check that the “Valve Seqeuncer MPV” is turned off. To do this click Shutdown on the GUI and select “Software Only”. Double click on the Picarro Utilities icon located on the desktop and double click on “Setup Tool”. Under the “Port Manager” tab check that the “Valve Sequencer MPV” is turned off. If necessary change this setting to off and close the Picarro Utilities folder.
-
Restart the GUI software by double clicking on the Picarro Switcher Mode icon located on the desktop and select the Isotopic N2O option followed by clicking Launch.
-
In the standard GUI mode, the H2O parameter is not available from the Data Key drop-down menus. This is necessary to check for pressure leaks in the system. To access this, log into the service GUI mode under the settings tab of the GUI. The password is “picarro”.
-
In the cylinder cabinet open the zero air (ZA) cylinder followed by opening the valve to the lab (do not open the exhaust valve–this will drain the ZA cylinder). Record the overall pressure remaining in the cylinder before and after each use. The pressure regulator in the cabinet should be set to 3.5 bar when the cylinder and line valve are open. This will drop to around 3 bar when the pressure regulators at the lab bench are opened.
-
At the lab bench, open the black valve at the first pressure regulator on the ZA line to the SSIM and adjust slowly to 1.5 bar. This will rise to 2 bar when it meets the resistance of the SSIM.
-
The second pressure regulator has been set to 3 psi (following Picarro’s recommendations), check to ensure this is the case and only adjust if necessary. Never allow the final pressure into the SSIM to go above 8 psi. The indicator on the valve may flicker during operation due to valve switching within the SSIM.
-
Connect the stainless steel tubing from the SSIM to the analyser. Finger tighten and then apply a ¼ turn using the adjustable spanner.
-
Connect the grey (valve switching controls) and black (pressure detector) cables from the analyser to the SSIM. This will power on the SSIM, indicated by the green light on the front of the unit.
-
NB Turn on the SSIM vacuum pump. This must be done before launching the SSIM software.
-
Launch the SSIM software by double clicking on the “SSIM Pressure Detector” icon. This locates the COM port (COM 7) of the analyser that the SSIM is connected to. Leave this software window open while using the SSIM.
-
Measure the Zero Grade Air only for 30 min before beginning sample analysis. This is to obtain the average N2O concentration, 15Nbulk, 15Nα and 15Nβ of the Zero Grade Air, necessary for correcting concentration dilution and isotope mixing.
-
Double click on the “SSIM Coordinator” from the desktop and select G5101-i. Configure the settings to suit the measurement procedure required. There are nine parameters (1–9) to be set.
-
1.
Multi-Port Valve: 1 = Use 16 Port Distribution Manifold; 2 = Don’t Use 16 Port Distribution Manifold. [Select 2 for SSIM only].
-
2.
If using Multi-Port Valve: Number of Sample Ports (between 1 and 8). [Select 1 for SSIM only].
-
3.
Number of Repeats per Sample (between 0 and 5). [Select 1].
-
4.
Number of Repeats per Standard (between 0 and 5). [Select 0].
-
5.
Standard Mode: 1 = Between Each Sample; 2 = Beginning and End. [Select 2].
-
6.
Measurement Mode: 1 = One Time; 2 = Continuous Loop. [Select 2].
-
7.
Measurement Speed: 1 = Standard, 2 = Fast. [Select 2] (Fast is approximately 10 min per sample/ Standard is approximately 15 min per sample).
-
8.
Sample Loading: 1 = Manual; 2 = Automatic; 3 = Syringe. [Select 3].
-
9.
Sample Dilution: 1 = No Dilution; 2 = Dilute Sample with ZA. [Select 2 for samples < 20 ml. Select 1 for samples >20 ml].
-
Click OK. Select G5101-i for reference standard.
-
SSIM pressure measurements should be available in the GUI data key drop-down tabs. Select this parameter to monitor SSIM pressure visually on the left side of the GUI.
-
Note: Under vacuum, the SSIM pressure should be ~8 Torr or below. When a sample is injected the max pressure is reached upon filling the cavity with sample/ ZA. The max pressure should read between 980 and 1000 Torr. If the pressure is too high down-regulate the second pressure regulator. If the pressure is too low up-regulate the second pressure regulator being very careful not to exceed 8 psi.
-
Overlay the SSIM Coordinator screen on to the bottom right corner of the GUI screen. This allows the user to monitor the parameters on the left side of the GUI while following the prompts of the SSIM Coordinator.
-
Follow the steps indicated on the SSIM Coordinator screen to process each sample.
-
The first prompt requires the operator to inject the sample syringe with the valve closed and to click “Resume” under “Control”. The SSIM coordinator will then run through several valve sequencing steps.
-
The next prompt to the operator is to open the syringe valve and to click “Resume” under “Control”. The SSIM coordinator will then run through several valve sequencing steps.
-
The operator will then be prompted to inject the sample. The sample will begin to draw itself in but the operator may be required to manually complete the injection depending on the sample volume. Once the sample is fully injected, close the syringe valve. Allow the SSIM pressure reading to settle and record this pressure value followed by clicking “Resume” under “Control”. NB–Always manually record the SSIM pressure as it settles after sample injection, and record the max SSIM pressure when the ZA dilution is carried out. This is used to work out the actual volume of a sample using the pressure vs volume calibration curve.
-
The SSIM coordinator will then begin the dilution process. NB–watch the SSIM pressure readings and record the maximum pressure reached during the dilution step.
-
The SSIM will then begin the sample measurement. At this stage, the syringe can be removed from the injector nut to prepare for the next sample injection.
-
Before each measurement day, complete a pressure vs volume calibration curve. Use room air injected at the following volumes: 0 ml, 5 ml, 10 ml, 15 ml and 20 ml. To complete the 0 ml point do not inject the syringe, instead allow the zero air to fill 20 ml (cavity volume) into the SSIM.
Note: The calibration curve should be almost perfectly linear with a R2 = 0.99 +. Deviations from the curve or lower R2 values may indicate a leak. Check the injector nut and septum, change septum if necessary. Check the ZA line connections from the SSIM unit to the analyser. Tighten loose connections if necessary by finger tightening + ¼ turn with an adjustable spanner. Never over tighten as this can lead to leaks.
-
To check the instrument precision and to avoid measurement drift, it is recommended that a room air/zero blank is run after every 10 samples. A reference standard or working standard may also be used if available.
-
To discontinue SSIM use and return to continuous measurement reverse the order of the SSIM setup steps. Close the SSIM Coordinator window. (Note: a system alarm will appear on the GUI, this is normal) Close the SSIM pressure detector window. Turn off the SSIM vacuum pump. Disconnect the grey and black cables from the SSIM. Disconnect the stainless steel tubing from the SSIM output. Close the black valve on the first pressure regulator at the lab bench and close this regulator by turning in the decrease direction. Close the valve and the ZA cylinder in the cylinder cabinet.
Note: A system alarm will probably appear on the top left of the GUI and a message stating “Pressure unlocked”. This results from the SSIM being disconnected. To resolve: click Shutdown and select “Stop Analyser Software Only”. Wait a couple of minutes and relaunch the analyser software by double clicking on the Picarro Switcher Mode icon on the desktop and selecting G5101-i Isotopic N2O and click launch. Monitor the system as it relaunches and wait until it begins measuring N2O parameters.
-
To turn off the instrument completely click shutdown on the GUI.
NB: Never leave the analyser measuring ZA overnight, this will lead to drift.
Expression of Results
-
N2O concentration is expressed as ppb.
-
δ 15Nbulk is expressed as permil (‰).
-
δ 15Nα is expressed as permil (‰).
-
δ 15Nβ is expressed as permil (‰).
Quality Assurance
-
Prior to taking gas samples in the field (i.e. from static chamber) ensure vials are properly sealed and that they have been flushed and evacuated three times.
-
Ensure samples are injected with slight overpressure (e.g. 20 ml into 12 ml vial) to avoid inward contamination that would dilute the sample concentration.
-
Ensure samples are stored in a cool dry place. Process samples as quickly as possible. Vials lose pressure over time. Avoid storing in direct sunlight.
-
The laser should be given sufficient time to stabilise. 24 h is recommended prior to measuring samples.
-
Before each measurement day, complete a pressure vs volume calibration curve as described above. Check for leaks based on any variation detected.
-
Ensure the septum in the injector nut is replaced approximately every 100 injections.
-
Use side bore needles to reduce the damage caused to the septum.
-
For acceptable precision and accuracy ensure that sample concentrations are within the stated operating range of the analyser (300–1500 ppb N2O).
-
Minimise moisture (H2O) in samples. Use drying tubes to introduce samples to the analyser if necessary.
-
Use a gas-tight syringe to inject discrete samples into the SSIM. If using a plastic syringe and with a three-way valve, replace when necessary due to wear and tear.
-
Never leave the analyser measuring ZA overnight. This will cause measurement drift.
Reporting of Results
Raw data files are automatically generated by the analyser and are stored on the instrument’s computer as a DataLog_User file. These raw data files can be found by following the file path: C:\UserData\DataLog_User\Year\Month\Day. An example of the file naming convention is JBDS5030-20170331-140739Z-DataLog_User. JBDS5030 refers to the instrument serial number. 20170331 is the Year, Month and Date the file was started. 140739 is the Hour, Minute and Second of when the file was started. There are a number of values available for the N2O parameters measured. The dry corrected values are the appropriate values to select for analysis.
When measuring discrete samples using the SSIM there is sufficient time between samples to record the real-time values on a separate spreadsheet that has been premade with sample reference numbers included.
Safety
-
When using syringes and needles for sampling and analysis, take extra care to avoid needle stick injuries.
-
Regularly check the pressure reading of the instrument and the pressure regulators on the ZA line.
-
Never handle pressurised gas cylinders without the appropriate safety training and certification.
-
If moving the instrument, always ensure it is shut down so that the cavity returns to ambient pressure and does not remain under vacuum.
-
There are a number of valve sequences during operation of the SSIM. Ensure to follow the prompts carefully to avoid loss of sample or pressure build ups.
-
Read and follow the information in the Risk Assessments for the Stable Isotope Analysis lab.
Trouble Shooting
-
Start-up:
If the chiller line contains large air bubbles this may stop the circulation of water in the line. This can lead to the baseplate temperature being exceeded which causes the analyser to enter safe mode (error message appears in GUI). This problem should be avoided by keeping the cooling agent LIQ-702 (propylene glycol) in the buffer tank (externally mounted on the chiller cover) topped up to 90% of its full volume with deionised water. To do this unscrew the black cover and use a wash bottle to add in fresh deionised water. This can be done while the analyser is running. If the error message does appear this may require the instrument to be shut down and for the chiller line be flushed following the instructions provided in the installation manual for the installation of the water buffer tank.
7.3.6 Accuracy, Precision and Bias
The analytical precision for IRMS measurements determined as standard deviation (1σ) of the internal standards for measurements of δ15Nbulk, δ18O and δ15Nsp is typically 0.1, 0.1 and 0.5‰, respectively. Commercially available laser spectrometers at ambient N2O concentrations offer a precision of 0.2 to 1 ‰ for δ15Nα, δ15Nβ and δ18O, which can be reduced to 0.1 ‰ at higher concentrations, or by using a preconcentration device. However, from the inter-comparison study, we see that the bias may be much larger, up to: for δ15Nbulk 0.8 and 2.8‰, and for δ15Nsp 4.3 and 3.7‰ for mass spectrometry and for laser spectroscopy, respectively (Mohn et al. 2014). But these potentially large errors can be minimised by a proper data calibration using two points standardisation with the reference gases that bracket the measurement range. Care must be also given when samples with high concentrations are diluted as the dilution matrix (typically Helium or N2) may apparently have an impact on the final result. The rule of identical treatment of standards and samples should be held, including identical dilution matrix and similar concentration range (Mohn et al. 2014).
Possible bias is also associated with calculations applied for data interpretation. Due to large ranges of literature data, the N2O source partitioning cannot be done precisely, but rather the ranges of possible results can be given. To increase precision of such methods controlled soil incubation can be applied to determine the soil specific endmember isotopic values or fractionation factors (Lewicka-Szczebak et al. 2017).
7.3.7 Examples of Laboratory Applications
Köster et al. (2015)
This experiment applied an N2O isotopocule approach combined with conventional N2O and N2 flux measurements to study microbial pathways after different organic fertiliser applications. The direct determination of emitted N2 was used to take isotope effects during N2O reduction to N2 into account. The measured isotope signatures were corrected for isotope effects during N2O reduction with Eq. 7.10 using previously determined fractionation factor ranges. Based on the corrected values the isotope mass balance equations (Eq. 7.8) for δ15Nsp and δ18O were applied. The ranges for different pathways contribution were given for δ15Nsp- and δ18O-based results and the common area for both was accepted as most probable. Two mixing scenarios were considered: bacterial denitrification and nitrification or bacterial and fungal denitrification. Although the range of possible results for endmembers contribution varied up to 30%, a clear increase in nitrification contribution with the incubation time has been documented.
Schorpp et al. (2016)
In this experiment, incubations with soil fauna were applied to check the impact on N2O and N2 emission of anecic earthworms and euedaphic collembola. Isotopocule approach was applied together with 15N tracing. Interpretation of the isotopocule results based on the δ18O-δ15Nsp isotope map, similar as presented in Fig. 7.6, including three possible mixing endmembers: bacterial and fungal denitrification and nitrification (hydroxylamine oxidation) and taking N2O reduction into account. Isotope data allowed concluding that the presence of collembolans shifted the process pathways towards bacterial denitrification although no change in N2O concentration could be noted.
Deppe et al. (2017)
In this incubation experiment high NH4+ concentrations in soil were established to check the supposed inhibition of nitrification. An isotopocule approach, together with 15N tracing and acetylene inhibition approach, was applied to gain insight into N2O production processes. Interpretation of the isotopocule results based on the δ18O-δ15Nsp isotope map, similar as presented in Fig. 7.6, including two mixing endmembers: denitrification and nitrification (hydroxylamine oxidation) and N2O reduction. This assumption of the mixing conditions appeared incorrect, since some data were located outside of the mixing and reduction lines. This indicated a substantial contribution of nitrifier denitrification and/or coupled nitrification-denitrification (10–40%) to total N2O production.
Cardenas et al. (2017)
Laboratory incubation was carried out at different saturation levels for a grassland soil and emissions of N2O and N2 were measured as well as the N2O isotopocules. Thanks to direct measurements of N2 flux, the extent of N2O reduction was known. Hence, the measured δ values were mathematically corrected to obtain the δ values of the produced N2O before reduction applying Eq. 7.9. An endmember mixing model (Eq. 7.8) was then used to calculate the percentage of bacterial N2O in the total N2O flux based on δ15Nsp and δ18O. To assess the uncertainty of this approach the ranges of possible endmembers isotopic signatures and reduction fractionation factors were taken into account. The variations of the bacterial N2O contribution due to assumed ranges of input values reached up to 40%. But still it allowed to distinguish the dominant pathways for different water saturation levels and indicated that only when the micropores become partially dry, the more aerobic soil conditions allow a higher contribution of nitrification. The dryer conditions in soil macropores did not result in significant changes in bacterial denitrification contribution.
7.3.8 Examples of Field Applications
Toyoda et al. (2011)
N2O emitted from agricultural soils planted with rice, wheat, soybean, and vegetables, and treated with synthetic (urea or ammonium) and organic (poultry manure) fertilisers was analysed. The observed isotopic values for Δ15N and δ15Nsp were compared with literature endmembers of nitrifying and denitrifying bacteria. A characteristic relationship between δ15Nbulk and δ15Nsp during N2O reduction by denitrifying bacteria was used to quantify N2O reduction. The relative fraction of N2O derived from nitrification and the approximate progress of N2O reduction were calculated by a Monte Carlo method. Different scenarios for pairs of mixing endmembers were tested (nitrification and denitrification; nitrification and nitrifier–denitrification; fungal denitrification and denitrification; fungal denitrification versus nitrifier–denitrification) but due to overlapping ranges for δ15Nsp values it was chosen to consider only the mixing between bacterial nitrification and denitrification. It was found that the contribution from nitrification was relatively high (40%–70%) in soils amended with synthetic ammonium fertiliser, while denitrification was dominant (50%–90%) in the same soils amended with poultry manure.
Kato et al. (2013)
In this study, field samples from static flux chambers located on alpine meadow, shrub and wetlands were collected and analysed. Interpretation of results based on the relationship between δ15Nbulk and δ15Nsp (similar as presented in Fig. 7.5). A mixing of two endmembers was assumed: bacterial and fungal denitrification and subsequent N2O reduction. Applying literature values for endmembers and fractionation during reduction the contribution of fungal denitrification (from 23 to 41%) and degree of reduced N2O (from 83 to 93%) was calculated. The calculations were performed with Monte Carlo simulations and the assessed uncertainty of the results ranged from 17 to 23% for contribution of mixing endmembers and from 10 to 19% for degree of reduced N2O.
Zou et al. (2014)
Soil gas was collected from a highly fertilised tea field at 10–50 cm depths using a silicone tube. δ15Nsp –Δ15Nbulk isotope maps (Fig. 7.5) were applied for interpretations. The precursor isotopic signatures were determined, and the endmember ranges have been recalculated according to the measured precursor values for bacterial and fungal denitrification, nitrification and nitrifier denitrification. For the N2O reduction two scenarios were taken into account: assuming reduction after mixing and applying closed system dynamics and assuming reduction preceding mixing and applying open system dynamics. Predictions of δ15Nsp values for different scenarios, reduction degrees and mixing ratios were presented and compared to the measured results. The study identified the bacterial denitrification as the dominant process and allowed for indication of the particular events when the contribution of nitrification or fungal denitrification increased pronouncedly.
Wolf et al. (2015).
N2O isotopic analyses were done directly from the atmospheric surface layer (at 2.2 m height) applying a laser spectrometer connected to an automated N2O pre-concentration unit. The isotopic signatures of soil-emitted N2O were derived using the Keeling plot approach, where δ values measured in the atmosphere surface layer are plotted versus the inverse of N2O mole fractions (for a background on Keeling plot analysis see Pataki et al 2003). The intercept of the linear regression line is interpreted as the isotopic composition of soil-emitted N2O. The interpretation of the results is based on isotope maps of δ15Nsp vs. δ15Nbulk and δ15Nsp vs. δ18O. These isotope maps allowed concluding that N2O was predominately formed by bacterial denitrification and that variations in isotopic composition may have been caused predominately by N2O reduction to N2. The study did not attempt to quantify the mixing ratios or N2O reduction. The high-frequency isotope data was combined with a biogeochemical model Landscape DNDC with a stable isotope model for nutrient cycles (SIMONE) to identify and address weaknesses in N cycling of the model (Denk et al. 2019).
7.3.9 Outlook
N2O isotopocule analyses provide a unique possibility to get insight into processes contributing to N2O production as well as to assess the magnitude of N2O reduction and thereby also N2 flux. However, the information is still rather indicative than strongly quantitative. The calculation methods presented allow estimates of ranges of possible mixing ratios and reduction contribution rather than precise numbers. However, such information is also quite precious hence often not attainable by any other methods. 15N tracing, which is often a more precise tool, is much more expensive and laborious, moreover applicable only on a very limited space and time scale, hence much more constrained in application potential.
A promising perspective is to apply the N2O isotopocule analyses in combination with other methods, like with 15N tracing (Deppe et al. 2017; Schorpp et al. 2016) (see also Sect. 7.5.) or with process modelling (Bai and Houlton 2009; Denk et al. 2017) which vastly increases the interpretation potential of such studies. Moreover, more quantitative estimates can be expected if the isotopocule approach is calibrated using controlled incubations where endmember values and isotopic fractionation factors are determined for specific conditions using independent estimates of contributing processes, e.g. by direct measurement of N2 production or 15N tracing (Lewicka-Szczebak et al. 2017; Wu et al. 2019). The most recent idea for interpretation of N2O isotope data is the application of a N2O isotopocule model which incorporates all three measured isotopic signatures (δ15Nbulk, δ15Nsp and δ18O) (Lewicka-Szczebak and Well 2020).
7.4 Dual Isotope Method for Distinguishing Among Sources of N2O
Various microbial processes can produce N2O (for a simplified overview, see Fig. 7.8). These may occur simultaneously in distinct soil microhabitats or take place temporally separated with fluctuating soil conditions. Often, only nitrification and denitrification are considered to be the main sources. However, the methods often applied cannot distinguish among all sources. For example, using 15N tracing with labelled ammonium or NO3− does not allow a distinction among N2O produced by nitrifiers either via hydroxylamine (termed here nitrification, N) or via nitrite reduction (nitrifier denitrification, ND), or by denitrifiers using NO3− produced by nitrifiers (nitrification-coupled denitrification, NcD). All N2O produced by these sources is summarised as ‘nitrification’ by authors using this method. No method based on 15N alone can so far separate the sources shown in Fig. 7.5. However, a distinction is important, as ND can under certain conditions produce all N2O derived from NH4+ and has been reported to cause up to 90% of total N2O emissions (Kool et al. 2010).

Overview of N2O producing processes carried out by nitrifiers and denitrifiers in soils. Shown is also the use of O2 versus H2O as source of oxygen. Please note that the distinction between nitrification-coupled denitrification and fertiliser denitrification is purely methodological, as the organisms and pathways are identical, but the source of NO3− differs. Within brackets, abbreviations of the pathways as used in the text are shown. DNRA: Dissimilatory NO3− reduction to NH3 (Wrage-Mönnig et al. 2018)
A distinction between ND and other sources of N2O is possible if 18O labelling is used in addition to 15N labelling (Kool et al. 2011). As seen in Fig. 7.8, nitrifiers use distinct sources of O2 for the oxidation of NH3 and the subsequent oxidations of NH2OH and NO2−. This is used in the dual isotope method, where 18O-labelled H2O is applied on top of 15N tracers. However, care has to be taken to account for O-exchange, which can occur between H2O and N oxides in all reactions of N oxides shown in Fig. 7.8. This is accomplished using the enrichment ratio retention (ERR) approach, where the enrichment ratio of 18O:15N of N2O is compared to that of NO3− in incubations with either 15N- or 18O-labelled NO3−. Then, we can differentiate among N2O produced by N, ND, NcD and fertiliser denitrification (FD).
The preparation of soil samples proceeds in a similar way as for other stable isotope methods. However, one has to keep in mind that water needs to be added as tracer, so that the water content during conditioning needs to be a bit less than intended for the incubation. So far, conditioning has been done at 40% water-filled pore space (of samples dried at 40°C), and incubation at 80%, but this is adaptable as long as the requirements for tracer additions are kept. Soil samples of 75–100 g have been incubated in glass jars of about 300 ml for 24–28 h. These ratios and times may be adapted, but care must be taken to ensure linear N2O production over the incubation period, as well as stable concentrations of substrates (including O2 and H2O). Much longer incubations are difficult, as the 18O enrichment of the soil H2O might change locally due to evaporation and addition of H2O. The occurrence of NO3− assimilation and DNRA needs to be checked (indicated by enrichment of NH4+ in incubations with 15N-NO3−) and accounted for if necessary, as in other 15N methods.
The treatments (TR) are established (Table 7.5) with proper replication (at least five times) after conditioning of the soil as needed. So far, added label has been enriched at 1.0 atom% for 18O and 40 atom% for 15N, but higher enrichments may be desirable to reduce the amount of substrates added, especially concerning the N-substrates in natural systems. Usually, 100 mg N kg−1 soil has been applied, half each as NO3− and as NH4+. When applying less NO3−, one has to consider that if NO3− becomes limiting, the underlying assumption of the method that only NO3− and no NO2− is used in NcD and FD becomes invalid. This would result in an underestimation of NcD and an overestimation of ND. Additional incubations with 18O-NO2− (which is currently not commercially available, though) or analysis of the 18O enrichment of the NO2− pool may help to overcome this.
Immediately after establishing the treatments, the jars are closed, and samples are taken for N2O content and isotopic signature as explained in Chap. 3 and above. At the end of the incubation, soil samples are taken for analysis of mineral N and its isotopic signature (the latter only in TR 3 and 4), as well as the soil moisture content to verify that this did not change during incubation. Consider that the label added with 18O-H2O is diluted when mixed with moist soil.
For quantifying the O-exchange between N oxides and 18O-H2O, the ERR approach is used. It is assumed that the O-exchange is similar for denitrifiers and nitrifiers. This need not be true, as O-exchange by nitrifiers has often been found to be less than in denitrifiers. Such a discrepancy would lead to an underestimation of the N2O produced by ND and NcD. No O-exchange is assumed to affect N2O derived from N. The ERR is calculated in Eqs. 7.12 to 7.17 as follows:
where 18O(YTRx) and 15N(YTRx) denote the 18O or 15N enrichment, respectively, of substance Y from treatment x. Without O-exchange, ERR is 100%. O-exchange (Oex) is then quantified as
Next, the percentage of N2O derived from NO3− \( \left( {{\text{N}}_{2} {\text{O}}_{{{\text{NO}}_{3}^{ - } }} } \right) \) and NH4+ \( \left( {{\text{N}}_{2} {\text{O}}_{{{\text{NH}}_{4}^{+} }} } \right) \) is calculated. \( {\text{N}}_{2} {\text{O}}_{{{\text{NO}}_{3}^{ - } }} \) is defined as N2O from FD, whereas N2ONH4+ comprises the other three sources.
If the 15N enrichment of N2O in TR4 does not exceed the 15N enrichment of NO3− in the same treatment, all \( {\text{N}}_{2} {\text{O}}_{{{\text{NH}}_{4}^{+} }} \) might have been derived from NcD (maximum contribution of \( {\text{NcD}},{\text{NcD}}_{\text{max} } = {\text{N}}_{2} {\text{O}}_{{{\text{NH}}_{4}^{+} }} \), implying that ND and N were equal to zero). If not, NcDmax is calculated as follows:
To distinguish among the other N2O producing pathways considered, the actual O incorporation from H2O into N2O (AOI) is determined from TR1:
This AOI may come from Oex quantified as shown above and the reaction stoichiometry of the different pathways as shown in Table 7.6.
A large AOI may thus be caused either by a larger contribution of pathways with a larger incorporation of 18O-H2O (ND or NcD) or by a larger Oex. For further evaluation, Oex is maximised, i.e. assumed to take place in the NH4+-derived pathways to the same extent as in FD (Scenario A) or minimised, i.e. assumed to be absent in nitrification pathways (Scenario B). Furthermore, in Scenario A, the contributions of N and NcD are maximised, while in Scenario B, ND is maximised. Under both scenarios, a theoretical O incorporation (TOI) is calculated and compared to the AOI.
Under Scenario A, the TOI (TOIA) is calculated (Eq. 7.18) as
This calculation comprises Oex occurring during D (\( {\text{N}}_{2} {\text{O}}_{{{\text{NO}}_{3}^{ - } }} \times {\text{O}}_{\text{ex}} \)) as well as from NcD stoichiometry (2/3 O from H2O) and Oex occurring during N to NO3− and NcD (for further explanation, see Appendix 1 in Kool et al. 2009). If TOIA ≥ AOI, no contribution by ND is necessary to explain the AOI. The minimal contribution of ND, NDmin, is then set to zero, and the maximum contribution of N, \( {\text{N}}_{\text{max} } = {\text{N}}_{2} {\text{O}}_{{{\text{NH}}_{4}^{+} }} {-}{\text{NcD}}_{\text{max} } \). If not, ND must have contributed to N2O production (NDmin > 0), which implies at the same time a maximum contribution of N, Nmax \( \left( {{\text{N}}_{\text{max} } < {\text{N}}_{2} {\text{O}}_{{{\text{NH}}_{4}^{+} }} {-}{\text{NcD}}_{\text{max} } } \right) \). In this case, we can calculate the contribution of NDmin (Eq. 7.19) as follows:
Nmax is then equal to \( {\text{N}}_{2} {\text{O}}_{{{\text{NH}}_{4}^{+} }} {-}{\text{NcD}}_{\text{max} } {-}{\text{ND}}_{\text{min} } \).
Under Scenario B, ND is maximised by assigning \( {\text{N}}_{2} {\text{O}}_{{{\text{NH}}_{4}^{+} }} \) to ND and assuming no Oex during this pathway, and in Eq. 7.20 TOIB is calculated as
If TOIB > AOI, not all \( {\text{N}}_{2} {\text{O}}_{{{\text{NH}}_{4}^{+} }} \) can have been derived from ND \( \left( {{\text{ND}}_{\text{max} } < {\text{N}}_{2} {\text{O}}_{{{\text{NH}}_{4}^{+} }} } \right) \). In that case, some N2O must have originated from N (i.e. the minimum contribution of N, Nmin > 0), which will lower the TOI. However, if TOIB ≤ AOI, all \( {\text{N}}_{2} {\text{O}}_{{{\text{NH}}_{4}^{+} }} \) may have come from ND \( \left( {{\text{ND}}_{\text{max} } = {\text{N}}_{2} {\text{O}}_{{{\text{NH}}_{4}^{+} }} } \right) \) and the contribution of Nmin was zero. A larger AOI (TOIB < AOI) may either come from a contribution of NcD or Oex during ND, which was assumed not to take place under this scenario. As both may equally well explain the numbers, NcDmin is set to zero in this case and Oex assumed to have occurred during ND.
If Nmin was found to be larger than zero, we can calculate NDmax from this scenario as follows (Eq. 7.21):
In that case, \( {\text{N}}_{\text{min} } = {\text{N}}_{2} {\text{O}}_{{{\text{NH}}_{4}^{+} }} {-}{\text{ND}}_{\text{max} } \).
Thus, in the dual isotope method, the contribution of NcD is always maximised, and consequently minimum and maximum contributions of N and ND are estimated based on Scenario A and B. Applying this method allows insight into these three potential sources of N2O plus fertiliser denitrification. However, in soils, further microbial processes can lead to N2O production. In the following, we will briefly discuss potential effects of nitrification by heterotrophs and archaea, fungal denitrification, as well as DNRA and co-denitrification.
If N2O of nitrification by heterotrophs and archaea is produced by the same sources and similar pathways as in autotrophic nitrifiers, this should not interfere with the calculations. The contribution of N would then comprise that of other nitrifiers. However, archaea have also been suggested to produce N2O in a pathway similar to ND (Jung et al. 2014). If so, this would be included in the contribution of ND. However, the pathway of N2O production by archaea is not clear yet and needs further study (Stieglmeier et al. 2014), the outcome of which will also affect the calculations presented here. In soils where fungal denitrification occurs, this is counted as FD using the dual isotope method, if the fungi use added NO3− as a source in a reaction similar to denitrification. Fungal denitrification may be quantified using the isotopomer method (Sect. 7.3), calling for a combination with the dual isotope method.
The occurrence of DNRA should be tested for as explained above. Should it lead to N2O production (Stevens et al. 1998), this would lead to an overestimation of N2O from FD. As DNRA may be important in soils (Rütting et al. 2011), this pathway should always be considered by checking for enriched NH4+ in incubations with added 15N-NO3−.
Co-denitrifiers combine NO3− or NO2− with other nitrogenous compounds to produce N2O or N2. The occurrence of such a process could be quantified using the triple labelling 15N tracing model (Müller et al. 2014) in combination with non-random 15N distribution (Laughlin and Stevens 2002). Incorporating this would be an improvement of the dual isotope method, as co-denitrification could interfere with the source estimations presented above.
The dual isotope method could be further developed by incorporating better rates of Oex for the pathways starting from NH4+. Despite potential for improvements, however, this method allows an estimation of the contributions of N, ND, NcD and FD to N2O production and should be applied to a range of soils to further our understanding of these sources of N2O and potential mitigation strategies.
7.5 Quantification of Gross N Transformation Rates and Process Specific N2O Pathways via 15N Tracing
7.5.1 Background
The N cycle is a conceptual model that illustrates where and in which form N is present in the environment and how N is transformed and exchanged between organic, mineral and gaseous N forms. Since the N cycle is a dynamic system not only the sizes of the different N pools, e.g. NH4+, NO3− or organic N but also the rates between the pools provide an understanding of the dynamic nature of this important elemental cycle in soils and aquatic systems (Ryabenko 2013). The most common and easiest approach to understand the dynamic nature of the N pools is the determination of net process rates, such as net mineralisation rates by calculating the difference in the size of the mineral N pool between two time points. If this rate is positive, we refer to a net mineralisation, if it is negative then we call it net immobilisation. Thus, a net rate always refers to the difference between the production and consumption of the N pools in question. It can easily be shown that different pairs of production and consumption rates will lead to exactly the same net result. Thus, the analyses of net rates do not provide a measure of the individual rates that are contributing to the observed net rate. The individual rates associated with the N pool in question are called gross transformation rates. However, the quantification of these individual rates is not trivial because they cannot be measured directly. The most commonly used method to quantify the gross rates is the isotopic dilution technique (Stark 2000). The principle of this technique relies on the 15N labelling of a certain N pool so that the gross rate entering this pool can be quantified by taking into account the change in pool size and 15N enrichment of at least two times after label addition (Fig. 7.9).

Illustration of the dilution technique by considering pool size and 15N abundance at two time points according to Kirkham and Bartholomew (1954)
The example in Fig. 7.9 shows that the pool size is decreasing which means that a net immobilisation of N occurred. However, the decline in 15N abundance of the pool N during the same period also shows that N at natural abundance or low 15N abundance must have entered the pool N. Thus, via visual inspection of the data we can say that N must have entered but also left the pool and that the rate leaving the pool must have been faster than the rate entering the pool. To quantify the individual rates requires a numerical analysis via a suitable N cycle model. Based on a simple two-pool N model, Kirkham and Bartholomew (1954) were the first to derive analytical equations that allowed the calculations of the two rates between two-time points, i.e. the gross mineralisation and immobilisation rates. The underlying assumptions are (i) 15N is homogeneously labelled and no preferential usage of either 15N or 14N occurs in the soil, (ii) immobilised N will not re-mineralise and (iii) N transformation rates follow zero-order kinetics (constant rates). The conceptual model of the Kirkham and Bartholomew approach and the equations derived for their model are illustrated in Fig. 7.10.
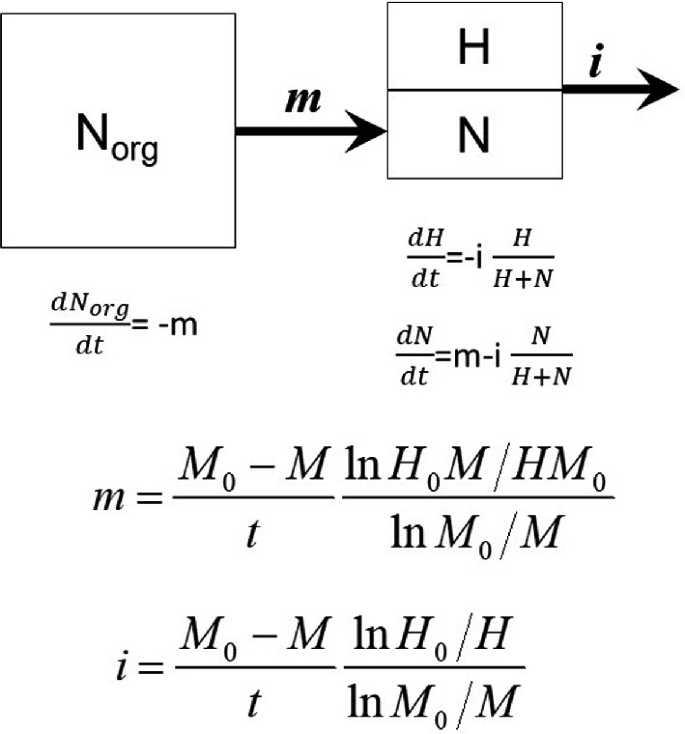
The conceptual model, the differential equations of the various pools and the closed-form analytical solutions for the individual gross rates (m and i) according to Kirkham and Bartholomew (1954). Note, Norg (assumed to contain only 14N) depicts the organic N pool which mineralises into mineral N (M) which consist of H (15N) and N (14N), M = H +N. The subscript 0 refers to the concentrations of the pools at time zero
Since Kirkham and Bartholomew’s pioneering work in the 1950s, analyses techniques have been developed which are based on more realistic conceptual N models. These include the division of the mineral N pool into NH4+ and NO3− pools with separate immobilisation rates, the consideration of more than one organic N pool and additional N loss rates such as ammonia volatilisation and denitrification (Myrold and Tiedje 1986). The dilution technique works well in simple systems where the inflow into a pool occurs via a single gross N transformation rate. However, in reality, often more than one pathway contributes to the buildup of a pool size. This can be illustrated by the NO3− pool in soil. Production of NO3− can occur via oxidation of NH4+ to NO3− (usually termed autotrophic nitrification), and via oxidation of organic N to NO3− (usually termed heterotrophic nitrification) (Fig. 7.11).

Conceptual model for nitrification
Following the principles of the dilution technique, the total gross rate of NO3− production can be quantified by labelling the NO3− pool and following the concentrations and 15N dilution of this pool over time. This total NO3− production rate includes both, autotrophic (oxidation of NH4+) and heterotrophic nitrification (oxidation of Norg). To separate the two processes, in addition to the 15NO3− label also the NH4+ pool should be labelled in a separate 15N labelling treatment. To keep the conditions in the two 15N labels the same, it is important to also apply NH4+ in the soil that has received the 15NO3− label while NO3− should be applied in the 15NH4+ treatment. Now, the 15N enrichment in the NO3− when only NH4+ has been labelled will provide a measure of autotrophic nitrification while heterotrophic nitrification can be calculated by difference: Nh = Ntot–Na where Ntot, Na and Nh refer to total, autotrophic and heterotrophic nitrification, respectively. In practice, to quantify Ntot the dilution of the 15N labelled NO3− pool (Fig. 7.10) can be used while Nh and Na can only be estimated via a simulation model that takes into account both nitrification rates (Barraclough and Puri 1995). A parameter optimisation technique can also be used to estimate Na or Nh (Myrold and Tiedje 1986). Thus, in modern 15N tracing applications dilution-enrichment principles will be taken into account which we refer to as tracing.
In models with several simultaneous N transformations, it is impossible to derive analytical solutions. Therefore, the development of 15N tracing models which use numerical solutions has become the state-of-the-art approach (Mary et al. 1998). These models rely on a set of differential equations for example of a simple system that describes the N cycle. Transformation rates between the various pools can be constant (zero-order kinetics) or are dependent on the pool size where the rate is originating from (first-order kinetics) or follow enzyme kinetics (i.e. Michaelis–Menten kinetics). While zero and first-order kinetics are described by one parameter, rates calculated via Michaelis–Menten kinetics are dependent on two parameters, i.e. the maximum velocity of the reaction rate and the half-saturation constant (Müller 2000). The determination of the parameters in such equation systems rely on parameter optimisation tools. A whole range of parameter optimisation tools are available and different algorithms have been used in 15N tracing models (Mary et al. 1998; Myrold and Tiedje 1986). More recently, parameter optimisation tools based on Bayesian probability have become more common because they allow the simultaneous optimisation of a large number of parameters (for more details see Müller et al. 2007). It should be noted that the sole purpose of tracing models is to quantify gross transformation rates and are therefore data analysis tools and should not be confused with simulation models.
In the following sections, current 15N tracing techniques are illustrated. This includes the description of experimental requirements to obtain suitable data sets and the subsequent model analysis. A number of 15N tracing models have been developed (e.g. FLUAZ, Mary et al. 1998), and here, the data analysis will be illustrated by the Ntrace model. This model is based on the tool presented by Müller et al. (2007) and has since been developed further to analyse data sets from a range of differently complex setups, including dynamics of nitrite, gaseous N emissions, soil–plant interactions, biochar, etc. An advantage of Ntrace is its flexibility to adapt to various conditions and models because it is programmed in MatLab with code that can easily be changed and amended.
7.5.2 Stable Isotope Tracing Technique
A stable isotope tracing study consists of two parts, an experimental study where one or more pools are isotopically labelled and a data analysis tool (e.g. Ntrace) to quantify individual gross transformation rates. The technique can be regarded as a calculation procedure to quantify gross rates which cannot be quantified via any other means. Thus, both the tracing experiment and the numerical tool are building an analysis unit and it is important that the experimental approach is taking into account the requirements of the numerical analysis and vice versa. What is also important is that the quality of the final results critically depends on the data quality and therefore on the careful execution of the experimental part of the tracing study. For instance, data with high uncertainties may also result in gross N rates that are associated with large errors.
7.5.3 Setup of Tracing Experiments
To be able to analyse experimental data with the Ntrace model, the experiment needs to be set up in a certain way. Based on the research questions both field and laboratory experiments can be carried out. The research question usually requires the setup of several treatments (e.g. effect of various soil amendments). To quantify the individual gross N transformation rates in each treatment usually a set of at least two 15N labels should be employed per treatment (i.e. 15N-labelled NH4+ and 15N-labelled NO3−, typically applied as NH4NO3 to ensure the application of equal quantities of each N species). However, often multiple labels are used (e.g. very common is a triple labelling approach with NH4NO3 where either NH4+, NO3− or both moieties are 15N labelled).
Ideally the 15N label should be applied without enhancing the concentration because this will also have an impact on the N transformations. Thus, in ecosystems that are not used to receive large N concentrations often a high 15N enrichment (e.g. 99 atom% 15N) is applied at a very low application rate. However, in agricultural soils which receive N in the form of fertiliser, this is less of a problem. The advantage of applying a reasonable, but not unrealistically high, N concentration is that it can more homogenously be applied to the soil. In most cases, a 15N enrichment of a few percent (e.g. 10 atom% 15N) is sufficient to determine gross rates. However, in situations where, for instance, the nitrite or gaseous N species such as N2O are analysed, the labelled N pool (e.g. NO3−) should ideally be enriched by approximately 50 atom% 15N which allows most precise analysis based on the expected 29/28 iron current (Stevens et al. 1993). The 15N solutions are made up according to standard calculations which are, for instance, summarised by Cabrera and Kissel (1989). To homogeneously label the soil a variety of application techniques are described in the literature ranging from application via side port needles in different depth, multiple needle applicators and automated techniques (Buchen et al. 2016) (Table 7.4). In field tracing studies often an application via a watering can is preferred, simply, because under field conditions when large plots of several m2 have to be treated, it is critical that the solutions are applied within a short time window to ensure the same starting conditions (Plate 7.1). This is particularly important if dynamically changing N species such as N2O should be compared among treatments (Moser et al. 2018). However, the application rate should be slow enough to avoid by-pass in cracks and fissures down the soil profile because this would cause uneven distribution of the 15N.

Application of 15N solution (15NH4NO3, NH 154 NO3) on plots in the field with a small watering device (a), and soil incubation in a climate chamber in suitable incubation jars (b)
The time of labelling should be carefully noted because the difference between 15N application and soil analysis during the experiment provides the time after N supply which is required for the model analysis. If both, soil extractions and gaseous measurements are planned then in the field an area for the gas sampling and an adjacent soil sampling area should be setup (in Plate 7.1, gas measurement are in the forefront, and the area for soil sampling is at the top). In laboratory incubations usually one set of jars is reserved for gaseous measurements (which will be extracted at the end of the experiment) while for each analysis day, separate sets of jars are prepared for destructive sampling. The question arises for how long we need to carry out a typical incubation study. Since the application of N may cause a stimulation of microbial activity resulting in faster gross N rates shortly after N application, the duration of a typical tracing study should be continued until after this initial stimulation has subsided. A typical duration of such a study is approximately 14 days. To characterise the non-linear dynamics of the gross N rates over time it is necessary to determine the N pool sizes and their 15N enrichment at least 5 times throughout that period. Gas analysis should be carried out more frequently but at least at the times when soils are extracted.
Soil incubations have typically been carried out under controlled conditions at a pre-defined moisture content (set to a certain water filled pore space (WFPS) or water holding capacity (WHC)) and temperatures in a climate chamber (Plate 7.1).
Case study
To investigate the effect of a nitrification inhibitor in two soils on gross N transformations the following setup is realistic (using a triple 15N labelling approach, numbers in brackets refer to the number of entities):
Soils (2) × Inhibitors (2) × 15N labels (3) × Replicates (3) × Time of soil extraction (5) = 180 jars.
Thus, a total of 180 jars (i.e. 36 jars per extraction day) need to be prepared. The label needs to be applied with minimal disturbance while providing an equal distribution in the soil. This can be done using a long needle with side ports. If 150 g of dry soil equivalent should be used per jar, then approximately 14 kg of soil is required from each soil.
The extraction times should be timed in such a way that the first extraction happens as soon as possible after 15N labelling (typically after 2 h), then on day 1, 3, 7 and 15. Note, soils can react quite differently, therefore, the times and duration of the experiment should be adjusted accordingly.
7.5.4 Analyses of Experimental Data
7.5.4.1 Soil Extraction
If nitrite concentrations should be investigated it is recommendable to carry out the blending procedure of Stevens and Laughlin (1995). They discovered that nitrite is chemically reduced to N2 in the KCl extract at pH below 5.5. They recommended a soil extraction at pH 7 and fast soil extraction. The blending procedure of Stevens and Laughlin (1995) is typically carried out at a soil: solution ratio of 1:1 in a blender for 90 s (Plate 7.2).

Extraction procedure for quick soil extraction (a) and glass filter unit for glass fibre filter papers (b)
Immediately after the blending, the soil suspension needs to be centrifuged at 2000 × g for 5 min, and the supernatant filtered sequentially through a GF/D and GF/F (Plate 7.2).
The extracts have to be analysed for NO3− and NH4+ and possibly for NO2. Based on the concentration a certain µmol of N of each N species will then be converted to 15N-N2O or via a diffusion approach.
7.5.4.2 Chemical Conversion of Mineral N to 15N-N2O
A precise method to determine the 15N content of ammonium, NO3− and nitrite is via a method that converts the N species to nitrous oxide (N2O). The reduction of NO3− to N2O is described by Stevens and Laughlin (1994). For this, sulphamic acid (2.5 ml of 0.2 M solution) is added to 50 ml soil extract and shaken by hand for 5 s to ensure conversion of NO2− to N2. Then 5 ml of 1 M sodium acetate- 1 M acetic acid buffer has to be added to increase the pH to 4.7. Then a CD-Cu reductor has to be placed in the bottle (Plate 7.3).

Soil extracts are transferred to medical flasks for conversion of NO2− and NO3− to N2O; gas samples are taken through the septa with syringes and then are transferred to pre-evacuated exetainers (from left to right)
The flask, capped, has to be laid flat in an orbital incubator at 20°C and shaken at 120 rpm with an orbit diameter of 50 mm for 2 h. A gas sample of the headspace is analysed with an IRMS for the 15N content of the N2O. The 15N content of the NO3− is considered to be the same as that of the N2O.
The production of N2O from NH4+ is described in Laughlin et al. (1997). Firstly, the ammonium must be diffused into (NH4)2SO4. For this, 50 ml of the soil extract has to be pipetted in the diffusion unit (Plate 7.4). Above this liquid, a small flask containing 3 ml of H2SO4 has to be placed. Before the diffusion jar is closed, 0.2 g of heavy MgO must be added. The MgO has to be brought into suspension by gentle swirling for 30 s. After this, the diffusion jar has to be left for 4 days. After diffusion of the NH3, the (NH4)2SO4-H2SO4 has to be poured into a 12 ml glass exetainer and evaporated to dryness in a 150 °C oven, before cooling it in a desiccator and sealing it with a septum and cap. Then the vial has to be evacuated and filled with He to atmospheric pressure. One ml of NaOBr, with the molarity of NaOH adjusted to 10 M has to be injected through the septum. The vial has to be tilted and the solution gently swirled to ensure that the NaOBr reacts with as much of the (NH4)2SO4 as possible. The concentration and 15N content of the N2O in each vial has to be determined by an IRMS system.

Glass equipment used for the conversion of NH4+ to NH3 which is trapped in the acid contained in the small hanging flask
For the NtraceNitrite model, data on NO2− concentration and 15N content are also necessary. The NO2− concentrations can be determined by a manual photometer method.
The 15N content of the NO2− extracts can also be determined by a method based on conversion to N2O as described by Stevens and Laughlin (1994). For this 50 ml of the soil extract has to be pipetted into a bottle. One ml of 1 M HCl and 0.5 ml of 0.04 M NH2OH has to be added to the bottle. The bottle should then be capped and laid flat in an orbital incubator and shaken at 120 rpm with an orbit of 50 mm for 16 h. A 12 ml sample of the headspace has to be transferred to an evacuated septum-capped glass vial, and the 15N content of the N2O in each vial can be determined by IRMS. The atom% excess in 15N in NO2− is calculated as two times the 15N atom% excess in N2O minus the 15N atom% excess in NH2OH.
The specific steps of the conversion method to N2O are summarised below.
-
1.
NH4+-N: NH4+-N is first oxidised to NO2−-N by BrO− in a vacuum with N2O being the by-product (Eq. 7.22). The production of N2O can be catalysed by Cu+ at the appropriate pH (Laughlin et al. 1997).
$$ {\text{NH}}_{4}^{ + } + {\text{NaBrO}} \to {\text{NaBr}} + {\text{H}}_{2} {\text{O}} + {\text{N}}_{2} \uparrow + {\text{N}}_{2} {\text{O}} $$(7.22) -
2.
NO3−–N: NO2−–N must be removed by NH2SO3H before NO3−-N is reduced. NO3−–N is reduced to NO2−–N and NH2OH by copper-plating cadmium grains at a pH of 4.7. Then NO2−–N reacts with NH2OH to produce N2O, and the production of N2O is positively correlated to the production of NO3−-N (Eq. 7.23). The ammonium and N from other sources has no effect on the determination of NO3−-N; (Stevens and Laughlin 1994).
$$ {\text{NO}}_{3}^{ - } \to {\text{NO}}_{2}^{ - } + {\text{NH}}_{2} {\text{OH}} \to {\text{N}}_{2} {\text{O}} + 2{\text{H}}_{2} {\text{O}} $$(7.23) -
3.
NO2−-N: NO2−-N reacts with NH2OH to produce N2O (Eq. 7.24) and the reaction is pH-dependent. When pH < 4, the reaction rate increases rapidly, and the reaction time should be at least 16 h. Because N2O is formatted via an asymmetric intermediate (N-nitroso-hydroxyl-amine) under acidic condition, the reaction requires at least 10 µmol of NH2OH (Stevens and Laughlin 1994).
$$ {\text{HNO}}_{2} + {\text{NH}}_{2} {\text{OH}} \to {\text{N}}_{2} {\text{O}} + 2{\text{H}}_{2} {\text{O}} $$(7.24)
The amount of N2O produced is about half of the theoretical yield. According to the isotopic distribution, the two N atoms in N2O are formed from NO2−-N and NH2OH, respectively. Hence, the atom% in NO2−-15N needs to be calculated with Eq. 7.25 (assume the atom% 15N in NH2OH is 0.365 atom%) (Laughlin et al. 1997):
Apparatus
PT-IRMS (purge and trap system coupled to isotope ratio mass spectrometry)
Vacuum pump
50 ml reaction vials
Glass vials with Al caps and septums
Reagents
NH +4 -N to N2O method:
MgO: combusted at 450 °C for 4 h
0.01 M H2SO4 with 0.5 mM CuSO45H2O
Basic NaBrO (10 M NaOH)
NO3−-N to N2O:
0.2 M NH2SO3H
1 M CH3COOH- CH3COONa (pH = 4.7)
Copper-plated cadmium granules
NO2−-N to N2O:
1 M HCl
0.04 M NH2OH-HCl
Procedures
-
1.
NH4+-N:
-
(a)
Pipet 15–20 ml (about 20 µg N) soil extract into a semi-micro steam distiller. Carry out steam distillation immediately after adding 0.2 g MgO. The NH3 is absorbed by 5 ml 0.01 M H2SO4. After 5 min of steam distillation, the distillate is concentrated to 2–3 ml. Transfer part of the concentrate into a 50 ml reaction vial, and evaporate to dryness at 90 °C;
-
(b)
Evacuate the vials and fill them with He. Then inject 1 ml NaBrO together with 10 M NaOH through the septum, and swirl the solution around the sides of the vial to ensure that NaOBr reacts with as much of the (NH4)2SO4 as possible;
-
(c)
Transfer a known amount of sample to an evacuated septum-capped glass vial. The 15N content of the N2O is then determined by IRMS.
-
(a)
-
2.
NO3−-N:
-
(a)
Pipet 20–25 ml (about 20 µg N) of the soil extract into a flask. Add 2.5 ml 0.2 M NH2SO3H, and shake the flask for 5 min to ensure conversion of NO2−-N to N2;
-
(b)
Place 50 mg copper-plated cadmium granules together with 5 ml of 1 M CH3COOH- CH3COONa into a 50 ml reaction bottle. Keep the bottle capped tightly, evacuate and then fill with pure He;
-
(c)
Inject 15–20 ml of the nitrite-free soil extract (about10 µg N) into a reaction bottle. Place the reaction bottle on a shaker at 120 rpm for 2 h;
-
(d)
Transfer a known amount of sample to an evacuated septum-capped glass vial. The 15N content of the N2O is then determined with mass spectrometry.
-
(a)
-
3.
NO2−-N:
-
(a)
Pipet 10–15 ml (about 0.5–1.0 µg NO2−-N) of the soil extract into a 50 ml reaction bottle. Keep the bottle capped tightly, evacuate and then fill with pure He;
-
(b)
Inject 1 ml 1 M HCl and 0.5 ml 0.04 M NH2OH-HCl into the bottle;
-
(c)
Place the bottle on a shaker running at 120 rpm for 16 h;
-
(d)
Transfer a known amount of sample to an evacuated septum-capped glass vial. The 15N content of the N2O is then determined with mass spectrometry. Finally, calculate the NO2−-15N using Eq. 7.25.
-
(a)
7.5.4.3 Inorganic Nitrogen Isotopic Analysis in Soil Extracts via the Diffusion Method
An alternative method for the determination of 15N in NO3− and NH4+ is the diffusion method. The diffusion method is easier to apply and has the advantage that only a solid analysis on an IRMS is required rather than a gas measurement. These Mass spectrometers are more readily available. However, it should also be pointed out that chemical conversion method described above is quicker and is free from contamination by atmospheric N. It has very low detection limits, which are 20 µg N for NH4+-N, 5 µg N for NO3−-N and 0.5 µg N for NO2−-N.
Principle
During diffusion, ammonium in the soil samples is converted to ammonia by the use of MgO (Eq. 7.26). Then the ammonia is absorbed by using a filter paper containing a weakly acidic absorbent liquid during the volatilisation process. For determination of NO3−-N, titrate some alkaline reagent to remove NH4+-N in the sample then add some Devarda’s alloy to reduce the NO3−-N into NH4+-N.
Apparatus need are:
EA-IRMS
Shaker
250 ml airtight containers
Perforated silicon films
Perforated filter papers
paper clips
Glass beads
Reagents:
MgO: Combusted at 450 °C for 4 h
Devarda’s alloy: crushed to allow passage through a 300-mesh sieve
1 M H2C2O4
Procedures
-
1.
Put clips on the perforated silicon film and place it in the cap of a flask. Then place two pieces of 6 mm-diameter filter paper (Whatman #41 ashless filter paper) which are perforated by a needle on the clip;
-
2.
For soil extracts > 2 mg l−1 in inorganic N concentration, only 20 ml of soil extract is needed. Put the 20 ml of soil extract into the container and add 3 glass beads before adding the MgO and Devarda’s alloy. Onto each piece of filter paper pipette 10 µl of 1 M H2C2O4 solution;
-
3.
Add 0.3 g MgO and close the container quickly. Swirl the container carefully for 15 s. Then incubate the sample for 24 h at 25 °C in a shaker running at 140 rpm to complete the diffusion and recovery of NH4+-N;
-
4.
To determine the 15N enrichment of NO3−-N from the same sample, replace the used filter paper with two new pieces also spiked with H2C2O4. Incubate the sample in a shaker running at 140 rpm for 48 h to remove the remaining NH4+-N. Then replace the used filter paper with two new acid-spiked pieces again, add 0.3 g Devarda’s alloy, and incubate it for 24 h to complete the processes of diffusion and recovery of NO3−-N;
-
5.
Remove the filter papers from the clips by forceps and dry them in a desiccator containing an open container of concentrated H2SO4 (to remove traces of NH3) and silica gel. Then wrap the filter papers in tin capsules and analyse them for 15N enrichment by using a coupled elemental analyser-isotope ratio mass spectrometer (EA-IRMS);
-
6.
Use the amount of N measured in diffusion blanks to calculate the corrected 15N enrichment of the sample (Eq. 7.27):
where Es is the corrected abundance 15N enrichment of the sample, Em is the enrichment of the sample + blank measured by mass spectrometry, Ms+b is the mass of N (sample + blank) recovered in the acid trap, Mb is the mass of N recovered in the acid trap from the diffusion blank, and Eb is the enrichment in the blank (assumed to be 0.3663 atom%).
Note, for soil extracts < 2 mg l−1 in inorganic N concentration, 50 ml of extract is needed to ensure accurate determination. When the abundances of NH4+-N and NO3−-N are very different, it is better to diffuse NH4+-N and NO3−-N separately (do not use the same extract).
7.5.4.4 Inorganic Nitrogen Isotopic Analysis in Soil Extracts at Natural Abundance
The diffusion method and chemical conversion method described above are both suitable for N at high abundance, but not for N at natural abundance. They both have a high demand for N and high levels of background N can interfere with the reaction. There are two modified chemical methods for N isotopic analysis at natural abundance. These simplify the preparation procedures, reduce the preparation time and do not require large amounts of N. The chemical method for ammonium requires 2.5 µg N in a 4 ml sample volume for analysis, and its accuracy of δ15N measurements is less than 0.3‰. The method for NO3− needs only 4.5 µg N, and its accuracy of δ15N and δ18O reaches 0.31‰ and 0.55‰, respectively.
Conversion of ammonium at natural abundance
Principle
The method is to oxidise NH4+-N to NO2−-N by BrO− instead of extraction of NH4+-N in solution. Subsequently, the NO2−-N is reduced to N2O by NH2OH-HCl, thus replacing HN3 (Liu et al. 2014; Stedman 1959) (Eq. 7.28).
Apparatus
PT-IRMS
Shaker
20 ml headspace glass vials: Acid rinsed and combusted at 450 °C for 4 h
Reagents
10 M NaOH: Evaporate 100 ml of 5 M NaOH to 50 ml of 10 M NaOH
NaBrO:
-
(a)
Bromate–bromide stock solution: Mix 0.6 g NaBrO3 and BrNa into 250 ml DIW (deionised water) (can be stored ≥ 6 months);
-
(b)
Take 1 ml bromate/bromide stock solution into 50 ml water, and place the solution in the dark with 3 ml 6 M HCl added for 5 min to produce Br2;
-
(c)
Add 50 ml of 10 M NaOH quickly to produce BrO−.
NaAsO2: Mix5.1 g NaAsO2 and 100 ml DIW
NH2OH, HCl:
-
(a)
NH2OH-HCl stock solution: Add 0.2778 g NH2OH-HCl in 100 ml DIW (can be stored ≤ 7 d)
-
(b)
Take 3 ml NH2OH-HCl stock solution and dilute in 500 ml DIW
6 M HCl
5 M NaOH
Procedures
-
1.
Take samples (1:10 (v:v) sample to NaBrO, e.g. 4 ml) and place it into 20 ml headspace glass vials. Dilute the sample to 10-20 µM to maximise oxidation yield. NO2−-N must be removed by NH2SO3H earlier to ensure the accurate determination of NH4+-N;
-
2.
Add NaBrO (e.g. 0.4 ml) into the vial, shake the vial vigorously, and then let it stand for 30 min;
-
3.
Pipet 0.05 ml NaAsO2 to remove excess BrO− and terminate oxidation;
-
4.
Add 6 M HCl to lower pH (pH < 1) and seal the vials;
-
5.
Inject NH2OH-HCl with a gas-tight syringe (n(NH4+): n(NH2OH) = 1:2). Put the samples in a shaker running at 120 rpm at 37 °C for 16 h;
-
6.
Inject 0.5 ml 5 M NaOH to absorb CO2 in the vials and terminate the reaction;
-
7.
Transfer a known amount of gas to a PT-IRMS for analysis;
-
8.
Treat 3 international NH4+-N standards (IAEA N1, +0.4‰; USGS 25, −30.4‰; USGS 26, +53.7‰) using the same protocol for calibration (Eq. 7.29):
where the intercept and slope are obtained from the linear regression of the δ15N measured and the δ15N assigned from N2O produced by the standards .
Conversion of NO − 3 at natural abundance
Principle
The NO3−-N is reduced to NO2−-N by copper-plated cadmium granules in a weakly alkaline environment (Eq. 7.30):
NO2−-N is converted into N2O by N3− in a weakly acid buffer. When pH > 2, the reaction will be (Eqs. 7.31−7.33):
When there is a large number of halogen ions present the reaction will be accelerated (Stedman 1959) (Eqs. 7.34, 7.35):
N2O is an asymmetric molecule with a molecular structure of N-N-O. The δ15NAir of N2O is the mean value of δ15NAir in two N atoms (Eq. 7.36):
and the N2O produced is composed of a N atom and an oxygen atom provided by the NO2−-N and a N atom provided by N3−, a N source. The isotope ratio of N and oxygen of the NO2− is identical with that of NO3− in the original solution. So, the following relationships hold (Eqs. 7.37, 7.38):
Therefore, when the isotope ratio of N3− is constant, the N and oxygen isotope ratios of N2O produced is linear with the N and oxygen isotope ratios of NO3−, and the theoretical slopes of their correlation curves are 0.5 (N) and 1.0 (O), respectively.
Apparatus
PT-IRMS
Shaker
pH metre
Peristaltic pump: flow rate ≥ 5 ml min−1
Water-thermostat
Fume hood
Filter papers
Headspace glass vials
Reagents
0.5 M NaCl
0.5 M HCl
1 M C3H4N2
NaN3- CH3COOH:
-
(a)
Mix 15 ml of 20% CH3COOH with 15 ml of 2 M NaN3 in a fume hood;
-
(b)
Ultrasonic surge the mixing solution for 15 min;
-
(c)
Blow the solution with He (280 ml min−1) for 30 min if there are impurities;
-
(d)
The remaining acid is neutralised with a strong base (NaOH).
6 M NaOH
Copper-plated cadmium granules
Cadmium reduction column
Procedures
-
1.
Place at least 40 ml of sample into the vials to ensure that there is still 16 ml sample with 4.5 µg N for the reaction after any loss. If the concentration of NO3−-N in sample is above 20 µM, dilute the sample with 0.5 M NaCl. If the concentration of Cl− is below 0.5 M, add solid NaCl to ensure that the concentration of Cl− is 0.5 M.
-
2.
The blank must be analysed during each analysis to test the seal of vials and the reagent blank. The signal value of blank should be below 0.6 nA.
-
3.
Add 0.5 M HCl into the samples to adjust pH to 2–3. The blank will only need one drop of 0.5 M HCl. Then add 1 M C3H4N2 to adjust the pH to 7.8–8.0.
-
4.
(a) Connect the cadmium reduction column to a peristaltic pump of which the flow rate is 5 ml min−1. Plug the end of the column with foam sponge. After filling the column with copper-plated cadmium granules, also plug the other end. Rinse the pipeline with 0.5 M NaCl (pH = 8) to activate the column. Then transfer 20 ml of adjusted sample into a 25 ml beaker, and place the inflow and outflow ends of the column in the beaker. After 80 min of continuous reduction, rinse the pipeline with 40 ml 0.5 M NaCl again. When moving the column air must not enter the column to prevent oxidation of the cadmium column.
(b) Copper-plated cadmium granules can be added directly to the samples. Place the samples in a shaker running at 200 rpm at 30 °C for 3 h to reduce NO3−-N. Filter the sample into another vial.
-
5.
Take a 16 ml sample and place it into a 50 ml headspace glass vial with the cap sealed. Evacuate the vial and fill it with He gas.
-
6.
Inject 0.8 ml NaN3- CH3COOH into the vial (pH = 4.5) and shake the solution vigorously for 1.0 min. Then place the samples in a water-thermostat at 30 °C for 30 min, or in a shaker running at 200 rpm at 35 °C for 30 min.
-
7.
Inject 0.5 ml 6 M NaOH (pH ≥ 10) to terminate the reaction.
-
8.
Transfer a known amount of the gas to a PT-IRMS for determination of δ15N and δ18O of N2O in the sample.
-
9.
Mix 2 international NO3−-N standards (USGS 32, δ15NAir‰ = 180‰, δ18OSMOW‰ = 25.7‰; USGS 34, δ15NAir‰ = −1.8‰, δ18OSMOW‰ = −27.9‰) in different proportions (e.g. 6:0, 4:2, 0:6), then treat them with the same protocol for calibration. The calibration equation shown below is
where the intercept and slope are obtained from the linear regression of the δ15N and δ18O measured from N2O produced by the standards and the δ15N and δ18O are assigned from the standards .
7.5.5 15N Tracing Model Analyses via Ntrace
7.5.5.1 Data Requirements for the Ntrace Model
Data obtained through the 15N tracing experiment will be further analysed by the Ntrace model to quantify gross N transformation rates and pathway-specific N2O emissions. The various Ntrace model versions differ in their data requirements. The NtraceBasic model has the fewest data requirements. The other models require more data on top of the data required for the NtraceBasic model. The NtraceBasic requires the fertiliser application rate (in µmol N g−1) and its 15N excess (in atom%). It also requires the average NO3− and NH4+ concentration and 15N excess (in atom% excess) including their standard deviations for each data point in time. The NO3− and NH4+ concentrations should be given in the same unit as the fertiliser application rate. Next to this, a one-time measurement of total organic N (in %) is required. This measurement can be taken from basic soil characteristics. The NtracePlant model also requires plant N and plant 15N data, and total plant biomass data, at each time when destructive sampling was carried out, i.e. preferably the same time points when NO3− and NH4+ were determined. Ideally, above- and belowground biomass (roots) should be determined. The NtraceUrea model requires the urea application rate and its excess, and if plants are included, it also has the additional requirements of the NtracePlant model. The NtraceNitrite model requires measurements at multiple time points (preferably the same as for NO3− and NH4+) of the average NO2− concentration and its 15N excess (in atom%) including standard deviations.
Transformation can follow zero-order, first-order, or Michaelis–Menten kinetics. The type of kinetics used needs to be specified for each transformation separately. If the transformation uses N from a large pool, it is generally appropriate to use zero-order kinetics. For N transformations coming from pools that change rapidly it is generally more realistic to use first-order or Michaelis–Menten kinetics. Especially the transformations associated with the NH4+ consumption (e.g. nitrification) may be most realistically represented by Michaelis–Menten kinetics. However, under conditions when microbial activities may be affected by conditions other than substrate, the N transformation rate may also follow first-order kinetics. For example, when the rate is governed by temperature or soil moisture.
7.5.5.2 The Ntrace Model System
The 15N tracing model Ntrace described by Müller et al. (2007) is a tool to quantify gross soil N transformations; this model considers five N pools and twelve simultaneously occurring N transformations (Fig. 7.12). The five soil N pools are ammonium (NH4+) adsorbed NH4+ (NH4+ads); labile soil organic N (Nlab); NO3−, nitrate stored ( NO3−sto) and recalcitrant soil organic N (Nrec). The model considered twelve gross N transformations from these five N pools: mineralisation of recalcitrant organic-N to NH4+ (MNrec); mineralisation of labile N to NH4+ (MNlab); immobilisation of NH4+ into recalcitrant organic-N (INH4_Nrec); immobilisation of NH4+ into labile organic-N (INH4_Nlab); oxidation of NH4+ to NO3− (ONH4); oxidation of recalcitrant organic-N to NO3− (ONrec); immobilisation of NO3− to recalcitrant organic-N (INO3); dissimilatory NO3− reduction to NH4+ (DNO3); adsorption of NH4+ on cation exchange sites (ANH4); and release of adsorbed ammonia (RNH4a), adsorption and release of NO3− on/from stored NO3−, i.e. ANO3s and RNO3s, respectively. Ntrace is a family of 15N tracing models to quantify gross N transformations in soils and sediments. The model consists of a N transformation model that is programmed in Simulink, a graphical programming language associated to Matlab, and a parameter optimisation routine based on a Markov Chain Monte Carlo routine in combination with the Metropolis algorithm (Müller et al. 2007).
Several extensions exist of the NtraceBasic model, namely NtracePlant (Fig. 7.13a), NtraceUrea (Fig. 7.13b), NtraceNitrite (Fig. 7.14) and NtraceGas (Fig. 7.15). The boxes represent the different N pools, and the transformations are represented by the arrows between the boxes. For each model all transformations are quantified simultaneously (Fig. 7.12).

Conceptual NtraceBasic model an extended version of the model published by Müller et al. (2007), extended by additional exchange processes between Nlab and NO3− (b)

a Ntrace Plant model, based on Inselsbacher et al. (2013) b NtraceUrea model


NtraceGas model an extension to NtraceNitrite as described by Müller et al. (2014)
The Matlab-Simulink files (m-files and mdl-files) alongside their description that are part of the Ntrace model are presented in Table 7.7.
Currently, a new optimisation routine for the Ntrace model is being implemented. This will further improve optimisation speed, and more importantly be quicker to find a global minimum as opposed to a local one. The method used for determining optimal parameters will be Matlab’s GlobalSearch algorithm (Ugray et al., 2007). Standard deviations of the optimised parameters will be determined as described by Gavin (2019).
7.5.6 Parameter Optimisation with Ntrace
7.5.6.1 Setup
After filling out an input file for the model (DataNtrace.xlsx) that contains all the required data specified in data requirements including kinetics for each transformation, initial parameters and minimum and maximum values for the parameters, the model can be run (Fig. 7.16).

Data Ntrace Excel file that is used to setup Ntrace model runs. The sheets show: above-left: input sheet of experimental data, below-left: setup of model run with input of basic parameters, e.g. Norg content, N application and the 15N enrichment, right: parameter sheet. Note: yellow areas are input areas
7.5.6.2 Procedure
The first step of the optimisation is generally done by hand. The model is run with the initial parameter set, and graphs of modelled versus measured data are inspected. From this, parameters are adjusted until a visually reasonable fit is obtained. Thereafter, all parameters are optimised simultaneously using a Markov chain Monte Carlo (MCMC) method, and this is explained in more detail by Müller et al. (2007). For this, the parameters are slightly adjusted, and the model is run. At the end of the run, the misfit is calculated based on the difference between the modelled and measured values. If the misfit is lower compared to the previous run, i.e. a better fit between modelled and measured data, the new parameter set is accepted, and it will start again by adjusting the newly accepted parameter set and execute the next iteration. If the misfit is higher, so a worse fit, there is also a chance the parameter set is accepted via a likelihood function. By this, it is possible that the algorithm moves out of a local minimum and enters the global minimum. If a new parameter set is not accepted, the last accepted parameter set will be used for the parameter adjustment. This iterative procedure of parameter adjustment and running the model should go on till the probability density functions (PDFs) are well characterised for all parameters. If the initial parameter set is fairly close to the optimal set, PDFs are generally well characterised after 50,000 to 100,000 iterations. So, for the final run, the maximum number of iterations is generally set between 50,000 and 100,000. During the optimisation, generally three parallel sequences, each with different starting parameters, are calculated. The number of parallel sequences should be defined before running the model, but three is generally appropriate. From these parallel sequences, a reduction factor is determined, which determines the accuracy of the sampling (Gelman et al. 2003). If the reduction factor is below a pre-specified number (default 1.1) for all parameters, the optimisation will also be stopped, regardless of reaching the maximum number of iterations. The reduction factor near 1 indicates that all parallel sequences resulted in statistically the same parameter set.
Inspection of the PDFs can show that for certain parameters the peak is close to zero. This would indicate that this particular parameter can be neglected. The parameter can then be set to zero, and excluded from optimisation when the model is re-run.
7.5.6.3 Ntrace Model Output
At the end of the optimisation, the model output will be exported to an Excel file. This output contains the initial parameter value, the optimised parameter value, the standard deviation of the optimised parameter, the average N flow for each transformation, the overall R2 and the AIC. The standard deviation (SD) of the transformation rate is based on the SD and average (AVG) parameter values as shown in Eqs. 7.41 to 7.43:
Response ratios between transformation rates can be calculated by McGeough et al. (2016):
With the associated standard deviation:
where \( \overline{X}_{E} \) and \( \overline{X}_{C} \) are the average N transformations of the elevated and control group, sdE and sdC the associated standard deviations and nE and nC the repetitions.
To compare the effect of different treatments on transformation rates, the individual treatments have to be run separately. After this, the rates can be compared using a one-way ANOVA based on the averages and standard deviations. Pairwise comparisons can be calculated with the Holm-Šídák test.
Another way to compare gross N transformation is via the determination of least significant difference (LSD) as described by Müller et al. (2011).
Output of the correlation matrix can be used to find parameters that tend to be strongly constrained together. A correlation value of above 0.8 indicates that it is constrained. There is also another output file that gives the pool sizes and transformation rates for each time step. This output can be used to create graphs.
7.5.7 Determination of N2O Pathways
7.5.7.1 Ntrace Approach to Quantify N2O Pathways
Nitrous oxide (N2O) can be emitted via a number of pathways including inorganic and also organic pathways, involving a range of microbes (e.g. bacteria, fungi) (Butterbach-Bahl et al. 2013). The NtraceGas model can be applied to quantify N2O pathways based on the underlying N transformations and especially based on the nitrite dynamics (NtraceNitrite). To accurately estimate N2O pathways via NtraceGas also the N2 production is calculated. The two predominant biological processes for N2O production in soil are traditionally considered to be autotrophic nitrification and heterotrophic denitrification (Ambus 1998; Wrage-Mönnig et al. 2018; Wrage et al. 2001). In both processes NO2− is the key precursor to N2O production. In nitrifier nitrification, it is rather NH2OH or at least something before nitrite. In nitrifier denitrification, it is nitrite.
Assuming that the N2O production is derived from a single NO2− pool, the 15N enrichments of the N2O and the NO2− should be similar. However, experimental data show that the enrichment of the N2O is deviating from the theoretical 1:1 line (Fig. 7.17) leading to the conclusion that the N2O originated from various NO2− sub-pools and also from sources which were at or close to natural abundance. Based on the experimental setup, the only common unlabeled N pool in all 15N treatments is organic N. Therefore, two possible processes were included in the NtraceGas model to account for such a dilution effect:

Relationships between nitrite and nitrous oxide a as well as the 15N enrichment b (Müller et al. 2014)
(a) reduction of NO2− originating from oxidation of organic N derived (NO2−org) and
(b) hybrid-reaction for N2O production whereby one atom of the N2O is derived from an enriched NO2− pool and another from organic N at natural abundance.
Heterotrophic nitrifiers can also denitrify (Blagodatsky et al. 2006; Papen et al. 1989) and it is, therefore, possible that NO2−org in the NtraceNitrite model (Rütting and Müller 2008) originating from Norg oxidation could be further reduced to gaseous N products. A hybrid-reaction between NO2− and organic N is also possible which occurs, for instance, in the fungus Fusarium oxysporum (Kurakov et al. 2000; Tanimoto et al. 1992) and possibly in other heterotrophic organisms (Kumon et al. 2002).
Based on the above considerations the NtraceGas model analyses four N2O processes. The entire model includes all the previous 15N tracing models (see Ntrace family above). In NtraceGas NO2− sub-pools are reduced to associated N2O pools which may further be reduced to N2 (Eq. 7.44).
(x = nit, den or org)
In addition, a hybrid-reaction between denitrification derived NO2− (NO2−den) and recalcitrant organic N (Nrec) was introduced (Eq. 7.45).
Each soil N2O sub-pool can be further reduced to N2 via specific N2O reduction rates or emitted to the atmosphere, which is governed by gas diffusion parameters. For N2O emission a first-order notation has been implemented (Cho and Mills 1979; p. 97 in Müller 2000).
The total N2O emission is calculated (Eq. 7.46) by
where Ex is the emission rate (µmol N g−1 h−1), kx is the emission rate constant (h−1) and N2Ox the soil N2O pool concentration (µmol N g−1). The symbol x stands for the process specific pools, i.e. nit, den, org and cod.
In the following section, two simplified approaches are presented that are based on the abundance of NH4+, NO3−, Norg and N2O. The methods are based on the assumption that N2O is derived from three uniformly labelled pools, i.e. NH4+, NO3− and Norg. and bases the analysis on the 15N enrichments of the different N species.
7.5.8 Source Partitioning to Quantify N2O Pathways
7.5.8.1 Three-Pool Model
Based on the two-pool source-partitioning model by Stevens et al. (1997) a three-pool solver method (Rütting et al. 2010) was developed. The solver method (Microsoft Excel 2007) calculates the N2O fractions associated with NH4+ (n) and NO3− (d) by minimisation of the absolute difference between observed and calculated 15N enrichments of N2O according to the equation:
where n and d are the fractions related to the NH4+ and NO3− pools, respectively, and ad, an and ao represent the 15N abundance of the NO3−, NH4+ and Norg (assumed to be at natural abundance) respectively. The data are setup in an Excel spreadsheet and the Excel Solver is used to minimise the difference between measured and calculated 15N N2O enrichments (Rütting et al. 2010) (Fig. 7.18).

Three source model for determination of N2O pathways based on Rütting et al. (2010), see text for details
With this method, it is possible to subdivide total N2O emission into the three sources, autotrophic nitrification, denitrification and heterotrophic nitrification.
7.5.8.2 Four-Pool Model
The three-pool model has been developed further by Jansen-Willems et al. (2016) to analyse four simultaneous processes (nitrification, denitrification, co-denitrification and oxidation of organic matter). The assumption is that isotopic discrimination is negligible. The conceptual model for this approach is illustrated in Fig. 7.19.

Conceptual model to analyse N2O pathways according to Jansen-Willems et al. (2016)
Background and development of the four-pool model
Each N pool contains both 15N and 14N atoms. If one N atom would be randomly selected from a pool, the chance it would be a 15N atom is equal to the 15N atom fraction of that pool. So for the NH4+ pool this would be an, for the NO3− pool ad, and for the organic-N pool ao. The chance it would be a 14N atom equals 1 minus the 15N atom fraction of that pool. So, for the NH4+ pool it would be 1-an, for the NO3− pool 1-ad, and for the organic-N pool it would be 1-ao.
N2O consists of two N atoms. For nitrification, denitrification and oxidation of organic N, both N atoms come from the same pool. For these three processes:
-
The chance that N2O contains no 15N atoms is the chance that the first atom is a 14N atom multiplied by the chance that the second atom is a 14N atom (Eq. 7.48).
-
The chance that N2O contains one 15N atom is the chance that the first atom is a 15N atom, multiplied by the chance that the second atom is a 14N atom, plus the chance that the first atom is a 14N atom and the second is a 15N atom (Eq. 7.49)
-
The chance that N2O contains two 15N atoms is the chance that the first atom is a 15N atom, multiplied by the chance that the second atom is a 15N atom (Eq. 7.50)
In Eqs. 7.48 to 7.50, ax would be an for nitrification, ad for denitrification and ao for oxidation of organic N.
For co-denitrification, one atom comes from the NO3−, and one comes from the organic N pool. So, for co-denitrification, the chance that N2O contains
-
No 15N atoms, is the chance of a 14N atom from the NO3− pool, multiplied by the chance of a 14N atom from the organic N pool (Eq. 7.51).
-
One 15N atom, is the chance of a 15N atom from the NO3− pool, multiplied by the chance of a 14N atom from the organic N pool plus the chance of a 14N atom from the NO3- pool multiplied by the chance of a 15N atom from the organic N pool (Eq. 7.52).
-
Two 15N atoms is the chance of a 15N atom from the NO3− pool, multiplied by the chance of a 15N atom from the organic N pool (Eq. 7.53).
The N2O in the gas sample is assumed to come from one of four processes. The fraction that comes from nitrification is written as n, the fraction that comes from denitrification is written as d and the fraction that comes from oxidation of organic matter is written as o. The fraction that comes from co-denitrification is written as c. As these are the only four processes considered, the four fractions should add up to one. Therefore, the following two equations apply:
The fraction of N2O in the gas sample that is expected to contain zero 15N atoms can be calculated by multiplying the fraction of that sample from a specific process by the chance that the N2O from that process contains zero 15N atoms. So for nitrification, this would be n(1–an)2, and for co-denitrification this would be (1–n–d−o) (1–ad) (1–a0). This should be done for all four processes, and then should be added together (Eq. 7.56). The fraction of the N2O in the gas sample that is expected to contain one 15N atom is calculated in the same way (Eq. 7.57), and the expected fraction containing two 15N atoms as well (Eq. 7.58)
Chance of zero 15N atoms:
Chance of one 15N atom:
Chance of two 15N atoms:
7.5.8.3 Mass Spectrometer Measurements and Calculation of Fractions
To determine the fractions of the different processes 45R and 46R measurements are needed. These need to be corrected for the presence of 18O. Therefore, this means that 45R is the fraction of N2O molecules containing one 15N atom divided by the fraction of N2O molecules containing zero 15N atoms, and 46R is the fraction of N2O molecules containing two 15N atoms divided by the fraction of N2O molecules containing zero 15N atoms.
The expected fractions for N2O containing zero, one or two 15N atoms are given in Eqs. 7.56−7.58. In the study published by Jansen-Willems et al. (2016), a0 was set to 0.003663 (natural abundance), and an and ad were considered to be the 15N abundance of NH4+ and NO3−. Using these values, n, d and o were quantified using the fminsearchbnd function in MatLab (The MathWorks Inc, Natick, MA). Thus, from this, c could be calculated according to Eq. 7.55.
References
Addy K, Kellogg DQ, Gold AJ, Groffman PM, Ferendo G, Sawyer C (2002) In Situ Push-Pull method to determine ground water denitrification in Riparian zones. J Environ Qual 31:1017–1024
Ambus P (1998) Nitrous oxide production by denitrification and nitrification in temperate forest, grassland and agricultural soils. Eur J Soil Sci 49(3):495–502
Arah JRM, Smith KA, Crighton IJ, Li HS (1991) Nitrous oxide production and denitrification in Scottish arable soils. J Soil Sci 42:351–367
Arah JRM (1992) New formulae for mass spectrometric analysis of nitrous oxide and dinitrogen emissions. Soil Sci Soc Am J 56:795–800
Arah JRM, Crichton IJ, Smith KA (1993) Denitrification measured directly using a single-inlet mass spectrometer and by acetylene inhibition. Soil Biol Biochem 25:233–238
Aulakh MS, Doran JW, Mosier AR (1991) Field-evaluation of 4 methods for measuring denitrification. Soil Sci Soc Am J 55:1332–1338
Bai E, Houlton BZ (2009) Coupled isotopic and process-based modelling of gaseous nitrogen losses from tropical rain forests. Global Biogeo Cycl 23(2):1–10
Baily A, Watson CJ, Laughlin R, Matthews D, McGeough K, Jordan P (2012) Use of the 15N gas flux method to measure the source and level of N2O and N2 emissions from grazed grassland. Nutr Cycl Agro 94:287–298
Barford CC, Montoya JP, Altabet MA, Mitchell R (1999) Steady-state nitrogen isotope effects of N2 and N2O production in Paracoccus denitrificans. Appl Environ Microb 65:989–994
Barraclough D, Puri G (1995) The use of 15N pool dilution and enrichment to separate the heterotrophic and autotrophic pathways of nitrification. Soil Biol Biochem 27(1):17–22
Bergsma TT, Ostrom NE, Emmons M, Robertson GP (2001) Measuring simultaneous fluxes from soil of N2O and N2 in the field using the 15 N-gas “Nonequilibrium” technique. Environ. Sci. Tech. 35:4307–4312
Blagodatsky SA, Kesik M, Papen H, Butterbach-Bahl K (2006) Production of NO and N2O by the heterotrophic nitrifier Alcaligenes faecalis parafaecalis under varying conditions of oxygen saturation. Geomicrobiol J 23:165–176
Bollmann A, Conrad R (1997) Enhancement by acetylene of the decomposition of nitric oxide in soil. Soil Biol Biochem 29(7):1057–1066
Brand WA, Huang L, Muskai H, Chivulescu A, Richter J, Rothe M (2009) How well do we know VVPDB variability of 13C and 18O in CO2 generated from NBS19-calcite. Rapid Commun Mass Spectrom 23:915–926
Brenninkmeijer CAM, Röckmann T (1999) Mass spectrometry of the intramolecular nitrogen isotope distribution of environmental nitrous oxide using fragment-ion analysis. Rapid Commun Mass Spectrom 13:2028–2033
Brewer P, Kim J, Lee S, Tarasova O, Viallon J, Flores E et al (2019) Advances in reference materials and measurement techniques for greenhouse gas atmospheric observations. Metrologia 56(3):034006
Buchen C, Lewicka-Szczebak D, Flessa H, Well R (2018) Estimating N2O processes during grassland renewal and grassland conversion to maize cropping using N2O isotopocules. Rapid Commun Mass Spectrom 32(13):1053–1067
Buchen C, Lewicka-Szczebak D, Fuß R, Helfrich M, Flessa H, Well R (2016) Fluxes of N2 and N2O and contributing processes in summer after grassland renewal and grassland conversion to maize cropping on a Plaggic Anthrosol and a Histic Gleysol. Soil Biol Biochem 101:6–19
Butterbach‐Bahl K, Breuer L, Gasche R, Willibald G, Papen H (2002) Exchange of trace gases between soils and the atmosphere in Scots pine forest ecosystems of the northeastern German lowlands 1. Fluxes of N2O, NO/NO2 and CH4 at forest sites with different N‐deposition. For Ecol Manage 167 (1–3): 123–134
Butterbach-Bahl K, Baggs EM, Dannenmann M, Kiese R, Zechmeister-Boltenstern S (2013) Nitrous oxide emissions from soils, how well do we understand the processes and their controls. Philos T R Soc B 368:16–21
Cabrera ML, Kissel DE (1989) Review and simplifications or calculations in 15N tracer studies. Fertil Res 20:11–15
Cao YC, Zhong M, Gong H et al (2013) Determining 15N abundance in ammonium, nitrate and nitrite in soil by measuring nitrous oxide produced (In Chinese). Acta Pedol Sinica 50(1):113–119
Cárdenas LM, Hawkins JMB, Chadwick D, Scholefield D (2003) Biogenic gas emissions from soils measured using a new automated laboratory incubation system. Soil Biol Biochem 35:867–870
Cardenas L, Bol R, Lewicka-Szczebak D, Gregory AS, Matthews GP, Whalley WR, Misselbrook R, Scholefield D, Well R (2017) Effect of soil saturation on denitrification in a grassland soil. Biogeosc 14:4691–4710
Cho CM, Mills JG (1979) Kinetic formulation of the denitrification process in soil. Can J Soil Sci 59:249–257
Clough T, Condron L (2010) Biochar and the nitrogen cycle: introduction. J Environ Qual 39:1218–1223
Clough T, Stevens R, Laughlin R, Sherlock R, Cameron K (2001) Transformations of inorganic-N in soil leachate under differing storage conditions. Soil Biol Biochem 33(11):1473–1480
Coplen TB (2011) Guidelines and recommended terms for expression of stable-isotope-ratio and gas-ratio measurement results. Rapid Commun Mass Spectrom 25:2538–2560
Cox GM, Gibbons JM, Wood ATA, Craigon J, Ramsden SJ, Crout NMJ (2006) Towards the systematic simplification of mechanistic models. Ecol Model 198:240–246
Decock C, Six J (2013) How reliable is the intramolecular distribution of 15N in N2O to source partition N2O emitted from soil? Soil Biol Biochem 65:114–127
Denk TRA, Mohn J, Decock C, Lewicka-Szczebak D, Harris E, Butterbach-Bahl K, Kiese R, Wolf B (2017) The nitrogen cycle: A review of isotope effects and isotope modelling approaches. Soil Biol Biochem 105:121–137
Denk TRA, Kraus D, Kiese R, Butterbach-Bahl K, Wolf B (2019) Constraining N cycling in the ecosystem model LandscapeDNDC with the stable isotope model SIMONE. Ecology 100:e02675
Deppe M, Giesemann A, Well R, Spott O, Flessa H (2017) Soil N2O fluxes and related processes in laboratory incubations simulating ammonium fertilizer depots. Soil Biol Biochem 104:68–80
De Klein CAM, Harvey M (eds) (2012) Nitrous oxide chamber methodology guidlines, Ministry of Primary Industries, Wellington.
Enrich-Prast A, Santoro AL, Coutinho RS, Nielsen LP, Esteves FA (2015) Sediment Denitrification in Two Contrasting Tropical Shallow Lagoons. Est Coast 39:657–663
Erler D, Duncan T, Murray R, Maher D, Santos I, Gatland J et al (2015) Applying cavity ring-down spectroscopy for the measurement of dissolved nitrous oxide concentrations and bulk nitrogen isotopic composition in aquatic systems: Correcting for interferences and field application. Limnol Oceanogr-Meth 13(8):391–401
Eschenbach W, Well R (2012) Predicting long-term denitrification capacity of sandy aquifers from incubation experiments and sediment properties. Biogeosciences Discuss. 9:1–52
Eschenbach W, Well R, Walther W (2015) Predicting the denitrification capacity of sandy aquifers from in situ measurements using push-pull N-15 tracer tests. Biogeosciences 12:2327–2346
Felber R, Conen F, Flechard CR, Neftel A (2012) Theoretical and practical limitations of the acetylene inhibition technique to determine total denitrification losses. Biogeosc 9(10):4125–4138
Firestone MK, Davidson EA (1989) Microbiological Basis of NO and N2O Production and Consumption in Soils. In: Andreae MO, Schimel DS (eds) Exchange of trace gases between terrestrial ecosystems and the atmosphere. Willey, New York, pp 7–21
Florian Stange C, Spott O, Apelt B, Russow R (2007) Automated and rapid online determination of 15N abundance and concentration of ammonium, nitrite, or nitrate in aqueous samples by the SPINMAS technique. Isotopes Environ Health Stud 43(3):227–236
Frame CH, Casciotti KL (2010) Biogeochemical controls and isotopic signatures of nitrous oxide production by a marine ammonia-oxidizing bacterium. Biogeosc 7:2695–2709
Gelman A et al (2003) Bayesian data analysis. Boca Raton, Chapman & Hall/CRC, Boca Raton
Gavin H P (2019). The Levenberg-Marquardt algorithm for nonlinear least squares curve-fitting problems. Department of Civil and Environmental Engineering, Duke University, 1–19
Gordon I, Rothman LS, Hill C, Kochanov RV, Tan Y, Bernath PF, Birk M, Boudon V, Campargue A, Chance KV, Drouin BJ, Flaud J-M, Garmache RR, Hodges JT, Jacquemart D, Perevalov VI, Perrin A, Shine KP, Zak EJ (2017) The HITRAN2016 molecular spectroscopic database. J Quant Spectrosc Radiat Transf 203:3–69
Granger J, Sigman DM, Lehmann MF, Tortell PD (2008) Nitrogen and oxygen isotope fractionation during dissimilatory nitrate reduction by denitrifying bacteria. Limnol Oceanogr 53:2533–2545
Griffith D (2018) Calibration of isotopologue-specific optical trace gas analysers: a practical guide. Atmos Meas Tech. 11(11):6189–6201
Groffman PM, Altabet MA, Böhlke JK, Butterbach-Bahl K, David MB, Firestone MK, Giblin AE, Kana TM, Nielsen LP, Voytek MA (2006) Methods for measuring denitrification diverse approaches to a difficult problem. Ecol Appl 16(6):2091–2122
Harris S, Liisberg J, Xia L, Wei J, Zeyer K, Yu L, Barthel M, Wolf B, Kelly BFJ, Cendón DI, Blunier T, Six J, Mohn J (2020) N2O isotopocule measurements using laser spectroscopy: analyzer characterization and intercomparison. Atmos Meas Tech 13:2797–2831
Hauck RD, Melsted SW, Yankwick PE (1958) Use of N-isotope distribution in nitrogen gas in the study of denitrification. Soil Sci 86:287–291
He X, Chi Q, Cai Z, Zhang J, Müller C (2020) 15N tracing studies including plant N uptake processes provide new insights on gross N transformations in soil-plant system. Soil Biol Biochem 141:107666
Hedges LV, Gurevitch J, Curtis PS (1999) The meta-analysis of response ratios in experimental ecology. Ecology 80(4):1150–1156
Heil J, Wolf B, Bruggemann N, Emmenegger L, Tuzson B, Vereecken H, Mohn J (2014) Site-specific 15N isotopic signatures of abiotically produced N2O. Geochim Cosmochim Ac 139:72–82
Hiltbold AE, Bartholomew WV, Werkman CH (1951) The use of trace techniques in the simultaneous measurement of mineralization and immobilization of nitrogen in soil. Soil Sci Soc Am Proc 15:166–173
Ibraim E, Wolf B, Harris E, Gasche R, Wei J, Longfei Y, Kiese R, Eggleston S, Butterbach-Bahl K, Zeeman M, Tuzson B, Emmenegger L, Six J, Henne S, Mohn J (2019) Attribution of N2O sources in a grassland soil with laser spectroscopy based isotopocule analysis. Biogeosc 16:3247–3266
Inselsbacher E, Wanek W, Strauss J, Zechmeister-Boltenstern S, Müller C (2013) A novel 15N tracer model reveals: Plant nitrate uptake governs nitrogen transformation rates in agricultural soils. Soil Biol Biochem 57:301–310
Istok JD, Humphreya MD, Schrotha MH, Hymanb MR, O’Reilly KT (1997) Single-well, ‘‘Push-Pull’’ test for in situ determination of microbial activities. Ground Water 35:619–631
Jansen Willems AB, Lanigan GJ, Clough TJ, Andresen LC, Müller C (2016) Long-term elevation of temperature affects organic N turnover and associated N2O emissions in a permanent grassland soil. Soil 2:601–614
Jensen ES (1991) Evaluation of automated analysis of 15N and total N in plant material and soil. Plant Soil 133(1):83–92
Jinuntuya-Nortman M, Sutka RL, Ostrom PH, Gandhi H, Ostrom NE (2008) Isotopologue fractionation during microbial reduction of N2O within soil mesocosms as a function of water-filled pore space. Soil Biol Biochem 40:2273–2280
Jung MY, Well R, Min D, Giesemann A, Park SJ, Kim JG, Kim SJ, Rhee SK (2014) Isotopic signatures of N2O produced by ammonia-oxidizing archaea from soils. ISME J 8:1115–1125
Kaiser J, Röckmann T (2008) Correction of mass spectrometric isotope ratio measurements for isobaric isotopologues of O2, CO, CO2, N2O and SO2. Rapid Commun Mass Spectrom 22:3997–4008
Kato T, Toyoda S, Yoshida N, Tang YH, Wada E (2013) Isotopomer and isotopologue signatures of N2O produced in alpine ecosystems on the Qinghai-Tibetan Plateau. Rapid Commun Mass Spectrom 27:1517–1526
Kelley KR, Ditsch DC, Alley MM (1991) Diffusion and automated nitrogen-15 analysis of low-mass ammonium samples. Soil Sci Soc Am J 55(4):1016–1020
Kirkham D, Bartholomew WV (1954) Equations for following nutrient transformations in soil, utilizing tracer data. Soil Sci Soc Am Proc 18(1):33–34
Kjeldby M, Eriksen AB, Holtan-Hartwig L (1987) Direct measurement of dinitrogen evolution from soil using nitrogen-15 emission spectrometry. Soil Sci Soc Am J 51:1180–1183
Knorr W, Kattge J (2005) Inversion of terrestrial ecosystem model parameter values against eddy covariance measurements by Monte Carlo sampling. Glob Chang Biol 11:1333–1351
Knowles R (1982) Denitrification. Microbiol Revs 46:43–70
Koba K, Osaka K, Tobari Y, Toyoda S, Ohte N, Katsuyama M (2009) Biogeochemistry of nitrous oxide in groundwater in a forested ecosystem elucidated by nitrous oxide isotopomer measurements. Geochim Cosmochim Acta 73(11):3115–3133
Kool DM, Müller C, Wrage N, Oenema O, van Groenigen JW (2009) Oxygen exchange between nitrogen oxides and H2O can occur during nitrifier pathways. Soil Biol Biochem 41:1632–1641
Kool DM, Wrage N, Zechmeister-Boltenstern S, Pfeffer M, Brus D, Oenema O, Van Groenigen JW (2010) Nitrifier denitrification can be a source of N2O from soil: a revised approach to the dual-isotope labelling method. Eur J Soil Sci 61:759–772
Kool DM, van Groenigen JW, Wrage N (2011) Source determination of nitrous oxide based on nitrogen and oxygen isotope tracing: dealing with oxygen exchange. Meth Enzymol 496:139–160
Kool DM, Wrage N, Oenema O, Dolfing J, Van Groenigen JW (2007) Oxygen exchange between (de) nitrification intermediates and H2O and its implications for source determination of NO -3 and N2O: a review. Rapid Commun Mass Spectrom 21:3569–3578
Köster JR, Cardenas LM, Bol R, Lewicka-Szczebak D, Senbayram M, Well R, Giesemann A, Dittert K (2015) Anaerobic digestates lower N2O emissions compared to cattle slurry by affecting rate and product stoichiometry of denitrification—An N2O isotopomer case study. Soil Biol Biochem 84:65–74
Köster JR, Well R, Tuzson B, Bol R, Dittert K, Giesemann A, Emmenegger L, Manninen A, Cardenas L, Mohn J (2013) Novel laser spectroscopic technique for continuous analysis of N2O isotopomers - application and intercomparison with isotope ratio mass spectrometry. Rapid Commun Mass Spectrom 27:216–222
Kulkarni MV, Burgin AJ, Groffman PM, Yavitt JB (2014) Direct flux and 15N tracer methods for measuring denitrification in forest soils. Biogeochem. 117:359–373
Kumon Y, Sasaki Y, Kato I, Takaya N, Shoun H, Beppu T (2002) Codenitrification and denitrification are dual metabolic pathways through which dinitrogen evolves from nitrate in Streptomyces antibioticus. J Bacteriol 184(11):2963–2968
Kurakov AV, Nosikov AN, Skrynnikova EV, L’vov NP (2000) Nitrate reductase and nitrous oxide production by Fusarium oxysporum 11dn1 under aerobic and anaerobic conditions. Curr Microbiol 41: 114–119
Laughlin RJ, Stevens RJ (2002) Evidence for fungal dominance of denitrification and codenitrification in a grassland soil. Soil Sci Soc Am J 66:1540–1548
Laughlin RJ, Stevens RJ, Zhuo S (1997) Determining nitrogen-15 in ammonium by producing nitrous oxide. Soil Sci Soc Am J 61:462–465
Lewicka-Szczebak D, Dyckmanns J, Kaiser J, Marca A, Augustin J, Well R (2016) Oxygen isotope fractionation during N2O production by soil denitrification. Biogeosc 13:1129–1144
Lewicka-Szczebak D, Well R, Bol R, Gregory A, Matthews P, Misselbrook T, Whalley R, Cardenas L (2015) Isotope fractionation factors controlling isotopocule signatures of soil-emitted N2O produced by denitrification processes of various rates. Rapid Commun Mass Spectrom 29:269–282
Lewicka-Szczebak D, Well R, Giesemann A, Rohe L, Wolf U (2013) An enhanced technique for automated determination of 15N signatures of N2, (N2 + N2O) and N2O in gas samples. Rapid Commun Mass Spectrom 27:1548–1558
Lewicka-Szczebak D, Augustin J, Giesemann A, Well R (2017) Quantifying N2O reduction to N2 based on N2O isotopocules–validation with independent methods (helium incubation and 15N gas flux method). Biogeosc 14(3):711–732
Lewicka-Szczebak D, Well R (2020) The 15N gas-flux method to determine N2 flux: a comparison of different tracer addition approaches. Soil 6:145–152
Lewicka-Szczebak D, Well R, Koster JR, Fuss R, Senbayram M, Dittert K, Flessa H (2014) Experimental determinations of isotopic fractionation factors associated with N2O production and reduction during denitrification in soils. Geoch Cosmo Ac 134:55–73
Liu D, Fang Y, Tu Y, Pan Y (2014) Chemical method for nitrogen isotopic analysis of ammonium at natural abundance. Anal Chem 86(8):3787–3792
Lu RK (1999) Analytical Methods for Soil and Agricultural Chemistry (In Chinese). China Agric Sci and Tech Press, Beijing, pp 107–108
Maeda K, Spor A, Edel-Hermann V, Heraud C, Breuil MC, Bizouard F, Toyoda S, Yoshida N, Steinberg C, Philippot L (2015) N2O production, a widespread trait in fungi. Sci Rep-Uk 5:9691–9697
Mandernack KW, Mills CT, Johnson CA, Rahn T, Kinney C (2009) The delta N-15 and delta O-18 values of N2O produced during the co-oxidation of ammonia by methanotrophic bacteria. Chem Geol 267:96–107
Mariotti A, Germon JC, Hubert P, Kaiser P, Letolle R, Tardieux A, Tardieux P (1981) Experimental determination of nitrogen kinetic isotope fractionation - some principles - illustration for the denitrification and nitrification processes. Plant Soil 62:413–430
Mary B, Recous S, Robin D (1998) A model for calculating nitrogen fluxes in soil using 15N tracing. Soil Biol Biochem 30(14):1963–1979
McGeough KL, Watson CJ, Müller C, Laughlin RJ, Chadwick DR (2016) Evidence that the efficacy of the nitrification inhibitor dicyandiamide (DCD) is affected by soil properties in UK soils. Soil Biol Biochem 94:222–232
McIlvin MR, Altabet MA (2005) Chemical conversion of nitrate and nitrite to nitrous oxide for nitrogen and oxygen isotopic analysis in freshwater and seawater. Anal Chem 77:5589–5595
Menyailo OV, Hungate BA (2006) Stable isotope discrimination during soil denitrification: Production and consumption of nitrous oxide. Global Bioge Cy 20: GB3025
Melin J, Nõmmik H (1983) Denitrification measurements in intact soil cores. Acta Agric Scand 33:145–151
Metropolis N, Rosenbluth AW, Rosenbluth MN, Teller AH (1953) Equation of state calculations by fast computing machines. J Chem Phys 21(6):1087–1092
Meyer A, Bermann J, Butterbach-Bahl K, Brüggemann N (2010) A new 15N tracer method to determine N turnover and denitrification of Pseudomonas stutzeri. Isotopes Environ Health Stud 46(4):409–421
Mohn J, Guggenheim C, Tuzson B, Vollmer MK, Toyoda S, Yoshida N, Emmenegger L (2010) A liquid nitrogen-free preconcentration unit for measurements of ambient N2O isotopomers by QCLAS. Atmos Meas Tech 3:609–618
Mohn J, Gutjahr W, Toyoda S, Harris E, Ibraim E, Geilmann H, Schleppi P, Kuhn T, Lehmann MF, Decock C, Werner RA, Yoshida N, Brand WA (2016) Reassessment of the NH4NO3 thermal decomposition technique for calibration of the N2O isotopic composition. Rapid Commun Mass Spectrom 30:2487–2496
Mohn J, Tuzson B, Manninen A, Yoshida N, Toyoda S, Brand WA, Emmenegger L (2012) Site selective real-time measurements of atmospheric N2O isotopomers by laser spectroscopy. Atmos Meas Tech 5:1601–1609
Mohn J, Wolf B, Toyoda S, Lin CT, Liang MC, Bruggemann N, Wissel H, Steiker AE, Dyckmans J, Szwec L, Ostrom NE, Casciotti KL, Forbes M, Giesemann A, Well R, Doucett RR, Yarnes CT, Ridley AR, Kaiser J, Yoshida N (2014) Interlaboratory assessment of nitrous oxide isotopomer analysis by isotope ratio mass spectrometry and laser spectroscopy: current status and perspectives. Rapid Commun Mass Spectrom 28:1995–2007
Moser G, Gorenflo A, Brenzinger K, Keidel L, Braker G, Marhan S, Clough TJ, Müller C (2018) Explaining the doubling of N2O emissions under elevated CO2 in the Giessen FACE via in-field 15N tracing. Glob Chang Biol 24(9):3897–3910
Müller C (2000) Modelling soil-biosphere interactions. CAB International, Wallingford
Müller C, Clough TJ (2014) Advances in understanding nitrogen flows and transformations: Gaps and research pathways. J Agric Sci 152(S1):34–44
Müller C, Stevens RJ, Laughlin RJ (2006) Sources of nitrite in a permanent grassland soil. Eur J Soil Sci 57:337–343
Müller C, Rütting T, Kattge J, Laughlin RJ, Stevens RJ (2007) Estimation of parameters in complex 15N tracing models by Monte Carlo sampling. Soil Biol Biochem 39(3):715–726
Müller C, Laughlin RJ, Christie P, Watson CJ (2011) Effects of repeated fertilizer and slurry applications over 38 years on N dynamics in a temperate grassland soil. Soil Biol Biochem 43:1362–1371
Müller C, Laughlin RJ, Spott O, Rütting T (2014) A 15N tracing method to quantify N2O pathways from terrestrial ecosystems. EGU (ed), p. 1, European Geological Union, Vienna.
Mulvaney RL, Vandenheuvel RM (1988) Evaluation of N-15 tracer techniques for direct measurement of denitrification in soil. 4. Field studies. Soil Sci e Soc Am J 52(5):1332–1337
Mulvaney RL (1984) Determination of 15N labeled dinitrogen and nitrous oxide with triple collector mass spectrometers. Soil Sci Soc Am J 48:690–692
Myrold DD, Tiedje JM (1986) Simultaneous estimation of several nitrogen cycle rates using 15N: theory and application. Soil Biol Biochem 18(6):559–568
Nadeem SM, Shaharoona B, Arshad M, Crowley DE (2012) Population density and functional diversity of plant growth promoting rhizobacteria associated with avocado trees in saline soils. Appl Soil Ecol 62:147–154
Naudé SM (1929a) An isotope of nitrogen, mass 15. Phys Review 34(11):1498–1499
Naudé SM (1929b) The isotopes of nitrogen, mass 15, and oxygen mass 18 and 17, and their abundance. Phys Review 36:333–346
Nielsen LP (1992) Denitrification in sediment determined from nitrogen isotope pairing. FEMS Microb Letters 86:357–362
Nõmmik H (1956) Investigation on denitrification in soil. Acta Agric Scand 6:195–227
Norman AG, Werkman CH (1943) The use of the nitrogen isotope N15 in determining nitrogen recovery from plant materials decomposing in soil. J Am Soc Agron 35:1023–1025
Ostrom NE, Ostrom PH (2011) The isotopomers of nitrous oxide: analytical considerations and application to resolution of microbial production pathways, in: Baskaran M (Ed.) Handbook of Envir Isotope Geoch Springer, pp 453–477
Ostrom NE, Gandhi H, Coplen TB, Toyoda S, Böhlke JK, Brand WA, Casciotti KL, Dyckmans J, Giesemann A, Mohn J, Well R, Yu L, Yoshida N (2018) Preliminary assessment of stable nitrogen and oxygen isotopic composition of USGS51 and USGS52 nitrous oxide reference gases and perspectives on calibration needs. Rapid Commun Mass Spectrom 32:1829–1830
Ostrom NE, Pitt A, Sutka R, Ostrom PH, Grandy AS, Huizinga KM, Robertson GP (2007) Isotopologue effects during N2O reduction in soils and in pure cultures of denitrifiers. J Geophys Res-Biogeo 112(G02005):02001–02012
Papen H, von Berg R, Hinkel I, Thoene B, Rennenberg H (1989) Heterotrophic nitrification by Alcaligenes faecalis: NO -2 , NO -3 , N2O, and NO production in exponentially growing cultures. Appl Environ Microb 55(8):2068–2072
Pataki DE, Ehleringer JR, Flanagan LB, Yakir D, Bowling DR, Still CJ, Buchmann N, Kaplan JO, Berry JA (2003) The application and interpretation of Keeling plots in terrestrial carbon cycle research. Glob Biogeochem Cyc 17, 2001GB001850
Röckmann T, Kaiser J, Brenninkmeijer CAM, Brand WA (2003) Gas chromatography/isotope-ratio mass spectrometry method for high-precision position-dependent 15N and 18O measurements of atmospheric nitrous oxide. Rapid Commun Mass Spectrom 17:1897–1908
Rohe L, Anderson TH, Braker G, Flessa H, Giesemann A, Lewicka-Szczebak D, Wrage-Mönnig N, Well R (2014) Dual isotope and isotopomer signatures of nitrous oxide from fungal denitrification – a pure culture study. Rapid Commun Mass Spectrom 28:1893–1903
Rohe L, Well R, Lewicka-Szczebak D (2017) Use of oxygen isotopes to differentiate between nitrous oxide produced by fungi or bacteria during denitrification. Rapid Commun Mass Spectrom 31:1297–1312
Rütting T, Clough TJ, Müller C, Lieffering M, Newton PCD (2010) Ten years of elevated atmospheric carbon dioxide alters soil nitrogen transformations in a sheep-grazed pasture. Glob Chang Biol 16:2530–2542
Rütting T, Boeckx P, Müller C, Klemedtsson L (2011) Assessment of the importance of dissimilatory nitrate reduction to ammonium for the terrestrial nitrogen cycle. Biogeosc 8:1779–1791
Rütting T, Müller C (2008) Process-specific analysis of nitrite dynamics in a permanent grassland soil by using a Monte Carlo sampling technique. Eur J Soil Sci 59:208–215
Ryabenko E (2013) Stable isotope methods for the study of the nitrogen cycle. In Zambianchi E (Ed) Topics in oceanography. IntechOpen 1–40
Schilman B (2007) Teplyakov N (2007) Detailed protocol for nitrate chemical reduction to nitrous oxide for δ15N and δ18O analysis of nitrate in fresh and marine waters. Geolog Survey 15:1–20
Scholefield D, Hawkins J, Jackson S (1997) Use of a flowing helium atmosphere incubation technique to measure the effects of denitrification controls applied to intact cores of a clay soil. Soil Biol Biochem 29:1337–1344
Schorpp Q, Riggers C, Lewicka-Szczebak D, Giesemann A, Well R, Schrader S (2016) Influence of Lumbricus terrestris and Folsomia candida on N2O formation pathways in two different soils–with particular focus on N2 emissions. Rapid Commun Mass Spectrom 30:2301–2314
Senbayram M, Well R, Bol R, Chadwick DR, Jones DL, Wu D (2018) Interaction of straw amendment and soil NO3- content controls fungal denitrification and denitrification product stoichiometry in a sandy soil. Soil Biol Biochem 126:204–212
Sgouridis F, Stot A, Ullah S (2016) Application of the N-15 gas-flux method for measuring in situ N2 and N2O fluxes due to denitrification in natural and semi-natural terrestrial ecosystems and comparison with the acetylene inhibition technique. Biogeosc 13:1821–1835
Siegel RS. Hauck, RD, Kurtz, LT (1982) Determination of 30N2 and application to measurement of N2 evolution during denitrification. Soil Sci Soc Am J 46: 68 − 74
Snider D, Venkiteswaran JJ, Schiff SL, Spoelstra J (2013) A new mechanistic model of d18O-N2O formation by denitrification. Geoch Cosmoch Ac 112:102–115
Snider DM, Venkiteswaran JJ, Schiff SL, Spoelstra J (2011) Deciphering the oxygen isotope composition of nitrous oxide produced by nitrification. Global Change Biol 18:356–370
Spott O, Russow R, Stange CF (2011) Formation of hybrid N2O and hybrid N2 due to codenitrification: first review of a barely considered process of microbially mediated N-nitrosation. Soil. Biol Biochem 1993–2011
Spott O, Russow R, Apelt B, Stange CF (2006) A 15N-aided artificial atmosphere gas flow technique for online determination of soil N2 release using the zeolite Köstrolith SX6. Rapid Commun Mass Spectrom 20:3267–3274
Spott O, Stange CF (2007) A new mathematical approach for calculating the contribution of anammox, denitrification and atmosphere to an N2 mixture based on a 15N tracer technique. Rapid Commun Mass Spectrom 21:2398–2406
Stark JM (2000) Nutrient transformations. Methods in Ecosystem Science. OE Sala, RB Jackson, HA Mooney and RW Howarth. New York, Springer: 215–234
Stark JM, Firestone MK (1995) Isotopic labeling of soil nitrate pools using 15N-nitric oxide gas. Soil Sci Soc Am J 59:844–847
Stark JM, Hart SC (1996) Diffusion technique for preparing salt solutions, kjeldahl digests and persulfate digests for nitrogen-15 analysis. Soil Sci Soc Am J 60(6):1846–1855
Stedman G (1959) Mechanism of the azide-nitrite reaction. Part I. J Chem Soc 9:2943–2949
Stevens RJ, Laughlin RJ (1994) Determining nitrogen-15 nitrite or nitrate by producing nitrous oxide. Soil Sci Soc Am J 58(4):1108–1116
Stevens RJ, Laughlin RJ (1995) Nitrite transformations during soil extraction with potassium chloride. Soil Sci Soc Am J 59(3):933–938
Stevens RJ, Laughlin RJ, Atkins GJ, Prosser SJ (1993) Automated determination of nitrogen-15-labelled dinitrogen and nitrous oxide by mass spectrometry. Soil Sci Soc Am J 57(4):981–988
Stevens RJ, Laughlin RJ, Burns LC, Arah JRM, Hood RC (1997) Measuring the contributions of nitrification and denitrification to the flux of nitrous oxide from soil. Soil Biol Biochem 29(2):139–151
Stevens RJ, Laughlin RJ, Malone JP (1998) Soil pH affects the process reducing nitrate to nitrous oxide and di-nitrogen. Soil Biol Biochem 30(8/9):1119–1126
Stieglmeier M, Mooshammer M, Kitzler B, Wanek W, Zechmeister-Boltenstern S, Richter A, Schleper C (2014) Aerobic nitrous oxide production through N-nitrosating hybrid formation in ammonia-oxidizing archaea. ISME J 8:1135–1146
Sun JF, Bai E, Dai WW, Peng B, Qu G, Jiang P (2014) Improvements of the diffusion method to measure inorganic nitrogen isotope of 15N labeled (In Chinese). Chinese J Ecol 33(9):2574–2580
Sutka RL, Adams GC, Ostrom NE, Ostrom PH (2008) Isotopologue fractionation during N2O production by fungal denitrification. Rapid Commun Mass Spectrom 22:3989–3996
Sutka RL, Ostrom NE, Ostrom PH, Breznak JA, Gandhi H, Pitt AJ, Li F (2006) Distinguishing nitrous oxide production from nitrification and denitrification on the basis of isotopomer abundances. Appl Environ Microb 72:638–644
Tanimoto T, Hatano K, Kim D, Uchiyama H, Shoun H (1992) Co-denitrification by the denitrifying system of the fungus Fusarium oxysporum. FEMS Microb Lett 93:177–180
Toyoda S, Yoshida N (1999) Determination of nitrogen isotopomers of nitrous oxide on a modified isotope ratio mass spectrometer. Anal Chem 71:4711–4718
Toyoda S, Mutobe H, Yamagishi H, Yoshida N, Tanji Y (2005) Fractionation of N2O isotopomers during production by denitrifier. Soil Biol Biochem 37:1535–1545
Toyoda S, Yano M, Nishimura S, Akiyama H, Hayakawa A, Koba K, Sudo S, Yagi K, Makabe A, Tobari Y, Ogawa NO, Ohkouchi N, Yamada K, Yoshida N (2011) Characterization and production and consumption processes of N2O emitted from temperate agricultural soils determined via isotopomer ratio analysis. Global Biogeo Cy 25: GB2008
Toyoda S, Yoshda N, Koba K (2017) Isotopocule analysis of biologically produced nitrous oxide in various environments. Mass Spectrom Rev 36:135–160
Ugray Z, Lasdon L, Plummer J, Glover F, Kelly J, Martí R (2007) Scatter search and local NLP solvers: A multistart framework for global optimization. INFORMS Journal on Computing, 19(3):328–340
Verhoeven E, Barthel M, Yu L, Celi L, Said-Pullicino D, Sleutel S, Lewicka-Szczebak D, Six J, Decock C (2019) Early season N2O emissions under variable water management in rice systems: source-partitioning emissions using isotope ratios along a depth profile. Biogeosci 16(2):383–408
Wang X, Cao YC, Han Y, Tang H, Wang R, Sun X, Sun Y (2015) Determination of nitrogen and oxygen isotope ratio of nitrate in water with a chemical conversion method (In Chinese). Acta Pedol Sinica 52(3):558–566
Wächter H, Mohn J, Tuzson B, Emmenegger L, Sigrist M (2008) Determination of N2O isotopomers with quantum cascade laser-based absorption spectroscopy. Opt Express 16(12):9239
Wassenaar L, Douence C, Altabet M, Aggarwal P (2018) N and O isotope (δ15 Nα, δ15 Nβ, δ18O, δ17O) analyses of dissolved NO3 − and NO2− by the Cd-azide reduction method and N2O laser spectrometry. Rapid Commun Mass Spectrom 32(3):184–194
Well R (1993) Denitrifikation im Wurzelraum unterhalb der Ackerkrume. Meßmethodik und Vergleich der 15N-Bilanz mit der 15N-Gasfreisetzungs-Methode. Diss. Fachber. Agrarwiss., Uni Göttingen. 112 p
Well R, Myrold DD (1999) Laboratory evaluation of a new method for in situ measurement of denitrification in water-saturated soils. Soil Biol Biochem 31:1109–1119
Well R, Becker KW, Meyer B (1993) Equilibrating of 15N-Gases by Electrodeless Discharge: A Method of Indirect Mass Spectrometric Analysis of 30N2 for Denitrification Studies in Soils. Isot Environ Health Stud 29(1–2):175–180
Well R, Meyer K (1998) Direct measurement of gaseous denitrification products in hydromorphic soils: concept, method and initial results. Mitt Dtsch Bodenkdl Ges 88:47–50
Well R, Becker KW, Langel R, Meyer B, Reineking A (1998) Continuous flow equilibration for mass spectrometric analysis of dinitrogen emissions. Soil Sci Soc Am J 62:906–910
Well R, Myrold DD (2002) A proposed method for measuring subsoil denitrification in situ. Soil Sci Soc Am J 66:507–518
Well R, Augustin J, Meyer K, Myrold DD (2003) Comparison of field and laboratory measurement of denitrification and N2O production in the saturated zone of hydromorphic soils. Soil Bio Biochem 35:783–799
Well R, Kurganova I, Lopes de Gerenyu V, Flessa H (2006) Isotopomer signatures of soil emitted N2O under different moisture conditions – a microcosm study with arable loess soil. Soil Biol Biochem 38:2923–2933
Well R, Flessa H, Xing L, Ju XT, Romheld V (2008) Isotopologue ratios of N2O emitted from microcosms with NH4+ fertilized arable soils under conditions favoring nitrification. Soil Biol Biochem 40:2416–2426
Well R, Flessa H (2009) Isotopologue enrichment factors of N2O reduction in soils. Rapid Commun Mass Spectrom 23:2996–3002
Well R, Eschenbach W, Flessa H, von der Heide C, Weymann D (2012) Are dual isotope and isotopomer ratios of N2O useful indicators for N2O turnover during denitrification in nitrate contaminated aquifers? Geochim Cosmochim Ac 90:265–282
Well R, Buchen C, Deppe M, Eschenbach W, Gattinger A, Giesemann A, Krause H-M, Lewicka-Szczebak D (2015) Non-homogeneity of isotopic labelling in 15N gas flux studies: theory, some observations and possible lessons, In: EGU (Ed.), EGU General Assembly. EGU EGU2015−11636
Well R, Maier M, Lewicka-Szczebak D, Koster JR, Ruoss N (2019a) Underestimation of denitrification rates from field application of the N-15 gas flux method and its correction by gas diffusion modelling. Biogeosciences 16:2233–2246
Well R, Burkart S, Giesemann A, Grosz B, Köster JR, Lewicka-Szczebak D (2019b) Improvement of the 15N gas flux method for in situ measurement of soil denitrification and its product stoichiometry. Rapid Commun Mass Spectrom 33:437–448
Well R, Weymann D, Flessa H (2005) Recent research progress on the significance of aquatic systems for indirect agricultural N2O emissions. Environ. Sci. –. J. Integr. Environ. Res. 2:143–152
Werle P, Miicke R, Slemr F (1993) The limits of signal averaging in atmospheric trace-gas monitoring by tunable diode-laser absorption spectroscopy (TDLAS). Appl Phys B Photoph and Laser Chem 57(2):131–139
Wolf B, Merbold L, Decock C, Tuzson B, Harris E, Six J, Emmenegger L, Mohn J (2015) First on-line isotopic characterization of N2O above intensively managed grassland. Biogeosci 12:2517–2531
Wrage N, Velthof GL, van Beusichem ML, Oenema O (2001) Role of nitrifier denitrification in the production of nitrous oxide. Soil Biol Biochem 33:1723–1732
Wrage-Mönnig N, Horn MA, Well R, Müller C, Velthof G, Oenema O (2018) The role of nitrifier denitrification in the production of nitrous oxide revisited. Soil Biol Biochem 123:3–16
Wu H, Dannenmann M, Wolf B, Han XG, Zheng X, Butterbach-Bahl K (2012) Seasonality of soil microbial nitrogen turnover in continental steppe soils of Inner Mongolia. Ecosphere 3
Wu D, Well R, Cárdenas LM, Fuß R, Lewicka-Szczebak D, Köster JR, Brüggemann N, Bol R (2019) Quantifying N2O reduction to N2 during denitrification in soils via isotopic mapping approach: Model evaluation and uncertainty analysis. Environ Res 108806
Yoshida N (1988) N-15-Depleted N2O as a Product of Nitrification. Nature 335:528–529
Yu L, Harris E, Lewicka-Szczebak D, Barthel M, Blomberg MRA, Harris SJ, Johnson MS, Lehmann MF, Liisberg J, Müller C, Ostrom NE, Six J, Toyoda S, Yoshida N, Mohn J (2020). What can we learn from N2O isotope data? - Analytics, processes and modelling. Rapid Commun Mass Spectrom 34:e8858
Zaman M, Nguyen ML, Matheson F, Blennerhassett JD, Quin BF (2007) Can soil amendments (zeolite or lime) shift the balance between nitrous oxide and dinitrogen emissions from pasture and wetland soils receiving urine or urea-N? Aust J Soil Res 45:543–553
Zaman M, Nguyen ML, Gold AJ, Groffman PM, Kellogg DQ, Wilcock RJ (2008a) Nitrous oxide generation, denitrification and nitrate removal in a seepage wetland intercepting surface and subsurface flows from a grazed dairy catchment. Aust J Soil Res 46:565–577
Zaman M, Nguyen ML, Saggar S (2008b) N2O and N2 emissions from pasture and wetland soils with and without amendments of nitrate, lime and zeolite under laboratory condition. Aust J Soil Res 46:526–534
Zaman M, Nguyen ML, Šimek M, Nawaz S, Khan MJ, Babar MN, Zaman S (2012) Emissions of nitrous oxide (N2O) and di-nitrogen (N2) from agricultural landscape, sources, sinks, and factors affecting N2O and N2 ratios. In: Greenhouse Gases - Emission, Measurement and Management. (Ed. Guoxiang Liu). Intech Croatia. 1–32
Zhang PY, Wen T, Zhang JB (2017) On Improving the Diffusion Method for Determination of δ15N-NH4+ and δ15N-NO3- in Soil Extracts (In Chinese). Acta Pedol Sinica 54(4):948–957
Zou Y, Hirono Y, Yanai Y, Hattori S, Toyoda S, Yoshida N (2014) Isotopomer analysis of nitrous oxide accumulated in soil cultivated with tea (Camellia sinensis) in Shizuoka, central Japan. Soil Biol Biochem 77:276–291
Author information
Authors and Affiliations
Corresponding author
Editor information
Editors and Affiliations
Rights and permissions
The opinions expressed in this chapter are those of the author(s) and do not necessarily reflect the views of the International Atomic Energy Agency, its Board of Directors, or the countries they represent
Open Access This chapter is licensed under the terms of the Creative Commons Attribution 3.0 IGO license (http://creativecommons.org/licenses/by/3.0/igo/), which permits use, sharing, adaptation, distribution and reproduction in any medium or format, as long as you give appropriate credit to the International Atomic Energy Agency, provide a link to the Creative Commons license and indicate if changes were made.
Any dispute related to the use of the works of the International Atomic Energy Agency that cannot be settled amicably shall be submitted to arbitration pursuant to the UNCITRAL rules. The use of the International Atomic Energy Agency's name for any purpose other than for attribution, and the use of the International Atomic Energy Agency's logo, shall be subject to a separate written license agreement between the International Atomic Energy Agency and the user and is not authorized as part of this CC-IGO license. Note that the link provided above includes additional terms and conditions of the license.
Copyright information
© 2021 The Author(s)
About this chapter

Cite this chapter
Zaman, M. et al. (2021). Isotopic Techniques to Measure N2O, N2 and Their Sources. In: Zaman, M., Heng, L., Müller, C. (eds) Measuring Emission of Agricultural Greenhouse Gases and Developing Mitigation Options using Nuclear and Related Techniques. Springer, Cham. https://doi.org/10.1007/978-3-030-55396-8_7
Download citation
DOI: https://doi.org/10.1007/978-3-030-55396-8_7
Published:
Publisher Name: Springer, Cham
Print ISBN: 978-3-030-55395-1
Online ISBN: 978-3-030-55396-8
eBook Packages: Earth and Environmental ScienceEarth and Environmental Science (R0)