
Abstract
Since the Apollo 11 launch to the moon in 1969, there have been numerous space missions. However, this space travel has always been conducted by NASA alone or NASA in collaboration with the US military and other country’s space agencies. Now, through research and development, private companies like Virgin Galactic, Blue Origin, and SpaceX are racing to fulfill the dreams of many, by proposing to take civilian customers on space excursions. But space tourism is in its infancy. This chapter looks at seven technologies that are necessary for space tourism to succeed; the vessel, fuel, navigation, health and safety technology, physics, communication systems, orbit control systems, and sensors, examining each through a literature review. Our seven key technologies are then examined using a technology forecasting technique – patent analysis – to reveal their growth curve. Our study shows that the last of the technology necessary to support safe space tourism will not reach maturity for another century.
Access this chapter
Tax calculation will be finalised at checkout
Purchases are for personal use only
References
About the deep space network. NASA. [Online]. Available: https://deepspace.jpl.nasa.gov/about/. Accessed 15 Mar 2020.
Aerospace sensor systems: From sensor development to vehicle application. NASA. [Online]. Available: https://ntrs.nasa.gov/search.jsp?R=20130013129. Accessed 22 Mar 2020.
Anderson, G. NASA confirms evidence that liquid water flows on today’s mars, NASA, 28-Sep-2015. [Online]. Available: https://www.nasa.gov/press-release/nasa-confirms-evidence-that-liquid-water-flows-on-today-s-mars. Accessed 22 Mar 2020.
Appell, D. The sun will eventually engulf earth—maybe. Scientific American, 01-Sep-2008. [Online]. Available: https://www.scientificamerican.com/article/the-sun-will-eventually-engulf-earth-maybe. Accessed 22 Mar 2020.
Attitude and orbit control system – GRACE-FO, NASA. [Online]. Available: https://gracefo.jpl.nasa.gov/attitude-and-orbit-control-system. Accessed 22 Mar 2020.
Bensoussan, D. Space tourism risks: A space insurance perspective. Acta Astronautica, 24-Feb-2010. [Online]. Available: https://www.sciencedirect.com/science/article/pii/S0094576510000111. Accessed 22 Mar 2020.
Blue origin: Space tourism company profile. Space Tourism Guide, 11-Dec-2019. [Online]. Available: https://spacetourismguide.com/blue-origin/. Accessed 22 Mar 2020]
Boroson, D. M. & Robinson, B. S. The lunar laser communication demonstration: NASA’s first step toward very high data rate support of science and exploration missions, the lunar atmosphere and dust environment explorer Mission (LADEE), pp. 115–128, 2015.
Halseide, P. (2020). “SpaceX: Space tourism company profile. Space tourism guide, 07-Jan-2020. [Online]. Available: https://spacetourismguide.com/spacex/. Accessed 22 Mar 2020.
Cho, Y. (2000). Exploring technology forecasting and its implications for strategic technology Planning. https://pdxscholar.library.pdx.edu/open_access_etds/4224. https://doi.org/10.15760/etd.6108
D’Atri, A., Marco, M. D., Braccini, A. M., & Cabiddu, F. (2014). Management of the interconnected world ItAIS: The Italian association for information systems. Heidelberg, Neckar: Physica.
Deep space communications. NASA. [Online]. Available: https://scienceandtechnology.jpl.nasa.gov/research/research-topics-list/communications-computing-software/deep-space-communications. Accessed 15 Mar 2020.
Deep-space positioning system (DPS). NASA. [Online]. Available: https://technology.nasa.gov/patent/NPO-TOPS-26. Accessed 15 Mar 2020.
Dentis, Matteo, Capello, Elisa, and Giorgio. A novel concept for guidance and control of spacecraft orbital maneuvers. International Journal of Aerospace Engineering, 29-Nov-2016. [Online]. Available: https://www.hindawi.com/journals/ijae/2016/7695257/. Accessed 22 Mar 2020.
Dockrill, P. Venus may have been habitable until a mysterious catastrophe millions of years ago, ScienceAlert. [Online]. Available: https://www.sciencealert.com/venus-may-have-been-habitable-until-a-mysterious-catastrophe-millions-of-years-ago. Accessed 22 Mar 2020.
Dunbar, B. What is Orion?. NASA, 20-May-2015. [Online]. Available: https://www.nasa.gov/audience/forstudents/k-4/stories/nasa-knows/what-is-orion-k4.html. Accessed 22 Mar 2020.
Dunbar, B. Liquid hydrogen--the fuel of choice for space exploration. NASA. [Online]. Available: https://www.nasa.gov/topics/technology/hydrogen/hydrogen_fuel_of_choice.html. Accessed 19 Mar 2020.
Guinn, J. R., Riedel, J. E., Bhaskaran, S., Park, R. S., Vaughan, A. T., Owen, W. M., Ely, T., Abrahamsson, M., & Martin-Mur, T. (2016). The deep-space positioning system concept: Automating complex navigation operations beyond the earth. Aiaa Space, 2016, 5409.
S. Hong, The magic of patent information. [Online]. Available: https://www.wipo.int/sme/en/documents/patent_information_fulltext.html. Accessed 22 Mar 2020.
How interstellar space travel works (infographic) | Space. 1 Jul 2013. https://www.space.com/17619-how-interstellar-travel-works-infographic.html. Accessed 22 Mar 2020.
Howell, E. Virgin galactic: Richard Branson’s space tourism company, Space.com, 09-Jan-2019. [Online]. Available: https://www.space.com/18993-virgin-galactic.html. Accessed 22 Mar 2020.
Liu, S. -J., & Shyu, J. Strategic planning for technology development with patent analysis. International Journal of Technology Management. [Online]. Available: https://www.inderscienceonline.com/doi/abs/10.1504/IJTM.1997.001689. Accessed 22 Mar 2020.
Merriam-Webster, Online ed. (2020a). Technology. [online]. Available at: https://www.merriam-webster.com/. Accessed 22 Mar 2020.
Merriam-Webster, Online ed. (2020b). Forecasting. [online]. Available at: https://www.merriam-webster.com/. Accessed 22 Mar 2020.
NASA’s got a plan for a ‘galactic positioning system’ to save astronauts lost in space. LiveScience. [Online]. Available: https://www.livescience.com/62309-galactic-positioning-system-nasa.html. Accessed 15 Mar 2020.
Oceans, beaches, cosmic shorelines: our changing views of habitable planets, NASA, 19-Jun-2019. [Online]. Available: https://exoplanets.nasa.gov/news/1583/oceans-beaches-cosmic-shorelines-our-changing-views-of-habitable-planets. Accessed 22 Mar 2020.
Perez, J. NASA’s HRP trailblazing better ways to protect astronauts, NASA, 29-Oct-2019. [Online]. Available: https://www.nasa.gov/feature/nasa-s-human-research-program-trailblazing-better-ways-to-protect-astronauts. Accessed 22 Mar 2020.
Phillips, F., & Linstone, H. (2016). Key ideas from a 25-year collaboration at technological forecasting & social change. Technological Forecasting and Social Change, 105, 158–166. http://www.sciencedirect.com/science/article/pii/S0040162516000081.
Reddy, M. V., Nica, M., & Wilkes, K. (2012). Space tourism: Research recommendations for the future of the industry and perspectives of potential participants. Tourism Management, 33(5), 1093–1102.
Swaminathan, N. Twisted sister: twin planets Earth and Venus were ‘separated at birth’. Scientific American, 29-Nov-2007. [Online]. Available: https://www.scientificamerican.com/article/twisted-sister-venus-earth. Accessed 22 Mar 2020.
Tangermann, V.. Here is the future of interstellar spacecraft. Futurism, 25-Aug-2017. [Online]. Available: https://futurism.com/here-future-interstellar-spacecraft. Accessed 22 Mar 2020.
Author information
Authors and Affiliations
Corresponding author
Editor information
Editors and Affiliations
Appendix
Appendix
-
1.
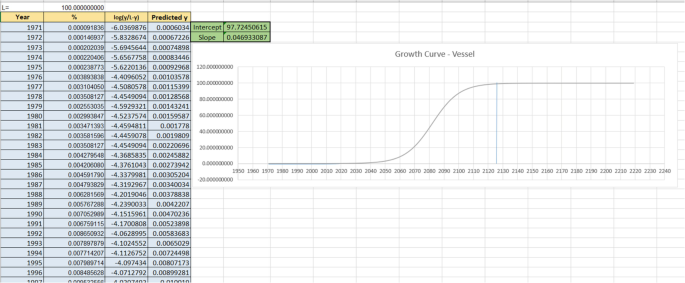
Snippet of log function, intercept, and slope used to analyze growth curve for vessel technologies
-
2.
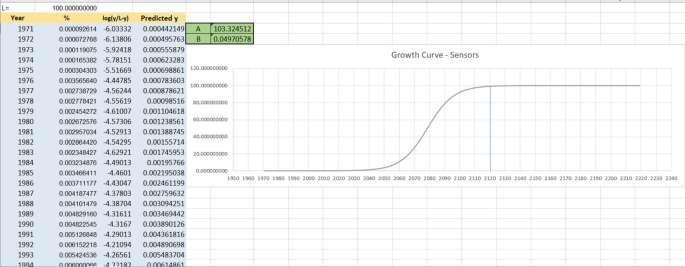
Snippet of log function, intercept, and slope used to analyze growth curve for sensors technologies
-
3.
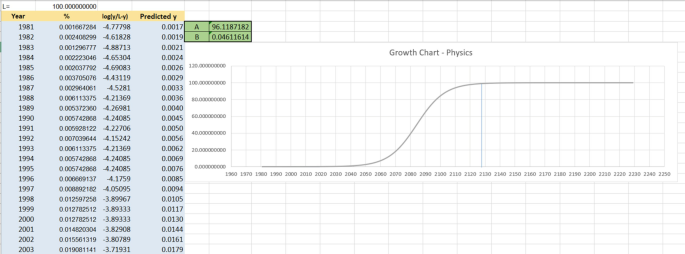
Snippet of log function, intercept, and slope used to analyze growth curve for orbital physics technologies
-
4.
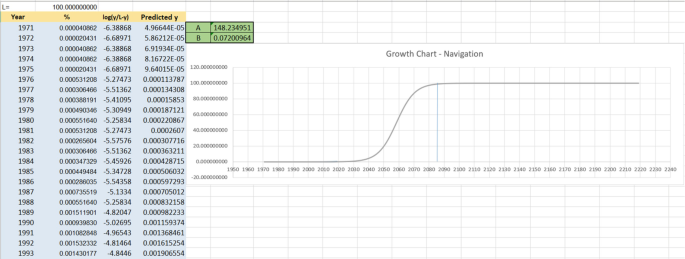
Snippet of log function, intercept, and slope used to analyze growth curve for navigational technologies
-
5.
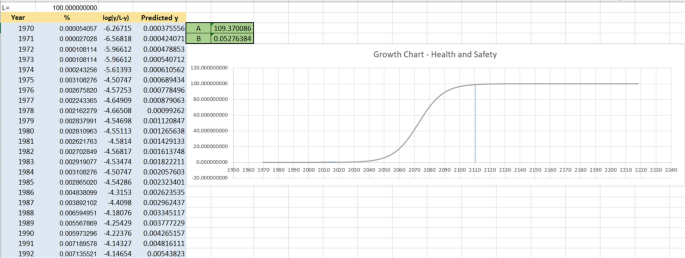
Snippet of log function, intercept, and slope used to analyze growth curve for health and safety technologies
-
6.
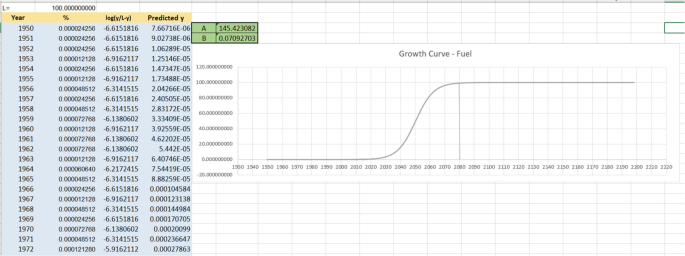
Snippet of log function, intercept, and slope used to analyze growth curve for fuel technologies
-
7.

Snippet of log function, intercept, and slope used to analyze the growth curve for communication systems technologies


Rights and permissions
Copyright information
© 2021 Springer Nature Switzerland AG
About this chapter

Cite this chapter
Ramesh, B., Snodgrass, R., Verma, B., Degan, M., Daim, T.U. (2021). Technology Intelligence Map: Space Tourism. In: Daim, T.U. (eds) Roadmapping Future. Applied Innovation and Technology Management. Springer, Cham. https://doi.org/10.1007/978-3-030-50502-8_14
Download citation
DOI: https://doi.org/10.1007/978-3-030-50502-8_14
Published:
Publisher Name: Springer, Cham
Print ISBN: 978-3-030-50501-1
Online ISBN: 978-3-030-50502-8
eBook Packages: Business and ManagementBusiness and Management (R0)