
Abstract
In this chapter, we discuss and highlight research from interesting and relevant publications that feature applications of these analytical methodologies to many economics, education, strategy development and assessment, health issues, and biomechanics.
Access this chapter
Tax calculation will be finalised at checkout
Purchases are for personal use only
References
Adams, R. (1992). The ‘hot hand’ revisited: Successful basketball shooting as a function of intershot interval. Perceptual and Motor Skills, 74, 934.
Adams, R. M. (1995). Momentum in the performance of professional pocket billiards players. International Journal of Sports Psychology, 26, 580–587.
Aharoni, G., & Sarig, O. H. (2012). Hot hands and equilibrium. Applied Economics, 44(18), 2309–2320.
Albert, J. (1993). A statistical analysis of hitting streaks in baseball: Comment. Journal of the American Statistical Association, 88(424), 1184–1188.
Albert, J., & Bennett, J. (2001). Curve ball: Baseball, statistics, and the role of chance in the game. New York: Copernicus.
Albright, S. C. (1993). A statistical analysis of hitting streaks in baseball. Journal of the American Statistical Association, 88(424), 1175–1183.
Alexander, D. L., & Kern, W. (2004). The economic determinants of professional sports franchise values. Journal of Sports Economics, 5(1), 51–66.
Anderson, K. J., & Pierce, D. A. (2009). The effect of foul differential on subsequent foul calls in NCAA basketball. Journal of Sports Sciences, 27(7), 687–694.
Andrew, Q., & Keefer, W. (2013). Compensation discrimination for defensive players: Applying quantile regression to the National Football League Market for Linebackers. Journal of Sports Economics, 14(1), 23–44.
Atiković, A. (2012). New regression models to evaluate the relationship between biomechanics of gymnastic vault and initial vault difficulty values. Journal of Human Kinetics, 35, 119–126.
Baade, R. (1994). Stadiums, professional sports, and economic development: Assessing the reality. A Heartland Policy Study, 62, 1–40.
Baade, R., & Dye, R. (1990). The impact of stadiums and professional sports on metropolitan area development. Growth and Change, 21, 1–14.
Baade, R., & Dye, R. (1998). Sports stadiums and area development: A critical review. Economic Development Quarterly, 2, 265–275.
Baade, R., & Matheson, V. (2001). Home run or wild pitch? Assessing the economics impact of Major League Baseball’s all-star game. Journal of Sports Economics, 2, 307–327.
Baade, R., & Matheson, V. (2002). Bidding for the Olympics: Fool’s gold? In C. Barros, M. Ibrahimo, & S. Szymanski (Eds.), Transatlantic sport: The comparative economics of North America and European sports (pp. 127–151). London: Edward Elgar.
Baade, R., & Matheson, V. (2004). The quest for the cup: Assessing the economic impact of the World Cup. Regional Studies, 38(4), 343–354.
Baade, R., & Matheson, V. (2016). Going for the gold: The economics of the Olympics. Journal of Economic Perspectives, 30(2), 201–218.
Baade, R., Baumann, R, & Matheson, V. (2007). Big men on campus: Estimating the economic impact of college sports on local economies (Working Papers 0726). International Association of Sports Economists, North American Association of Sports Economists.
Baade, R., Baumann, R., & Matheson, V. (2008). Assessing the economic impact of college football games on local economies. Journal of Sports Economics, 9(6), 628–643.
Baade, R., Baumann, R., & Matheson, V. (2011). Big men on campus: Estimating the economic impact of college sports on local economies. Regional Studies, 45(3), 371–380.
Baumann, R., Engelhardt, B., & Matheson, V. (2010). The labor market effects of the Salt Lake City Winter Olympics (Working paper series). International Association of Sports Economists.
Bean, J. C., Chaffin, D. B., & Schultz, A. B. (1988). Biomechanical model calculation of muscle contraction forces: A double linear programming method. Journal of Biomechanics, 21(1), 59–66.
Beaudoin, D., & Swartz, T. B. (2010). Strategies for pulling the goalie in hockey. The American Statistician, 64(3), 197–204.
Bergamini, E., Morelli, F., Marchetti, F., Vannozzi, G., Polidori, L., Paradisi, F., Traballesi, M., Cappozzo, A., & Delussu, A. S. (2015). Wheelchair propulsion biomechanics in junior basketball players: A method for the evaluation of the efficacy of a specific training program. BioMed Research International, 2015, 275965.
Berri, D. J., & Simmons, R. (2009). Race and the evaluation of signal callers in the National Football League. Journal of Sports Economics, 10(1), 23–43.
Billing, D. C., Nagarajah, C. R., Hayes, J. P., & Baker, J. (2006). Predicting ground reaction forces in running using micro-sensors and neural networks. Sports Engineering, 9(1), 15–27.
Boyko, R. H., Boyko, A. R., & Boyko, M. G. (2007). Referee bias contributes to home advantage in English premiership football. Journal of Sports Sciences, 25(11), 1185–1194.
Bridges, B. (2008). The Seoul Olympics: Economic miracle meets the world. The International Journal of the History of Sport, 25(14), 1939–1952.
Brouwer, A. E., Post, G., & Woeginger, G. J. (2008). Tight bounds for break minimization. Journal of Combinatorial Theory A, 115, 1065–1068.
Buchanan, T. S., & Shreeve, D. A. (1996). An evaluation of optimization techniques for the prediction of muscle activation patterns during isometric tasks. Journal of Biomechanical Engineering, 118(4), 565–574.
Buraimo, B., Forrest, D., & Simmons, R. (2010). The 12th man? Refereeing bias in English and German soccer. Journal of the Royal Statistical Society: Series A (Statistics in Society), 173(2), 431–449.
Byrne, K. (2011). Defending traditional passer rating, Sports Illustrated, August 3.
Caro, C., & Machtmes, R. J. (2013). Testing the utility of the Pythagorean expectation formula on division one college football: An examination and comparison to the Morey model. Journal of Business and Economic Research, 11(12), 537–542.
Carter, V., & Machol, R. E. (1971). Operations research in football. Operations Research, 19(2), 541–544.
Caudill, S. B., Mixon, F. G., Jr., & Wallace, S. (2014). Life on the red carpet: Star players and referee bias in the National Basketball Association. International Journal of the Economics of Business, 21(2), 245–253.
Chen, T. L.-W., Wong, D. W.-C., Wang, Y., Ren, S., Yan, F., & Zhang, M. (2017). Biomechanics of fencing sport: A scoping review. PLoS One, 12(2), 1–22.
Clark, R. D. (2003a). Streakiness among professional golfers: Fact or fiction? International Journal of Sport Psychology, 34, 63–79.
Clark, R. D. (2003b). An analysis of streaky performance on the LPGA tour. Perceptual and Motor Skills, 97, 365–370.
Clark, R. D. (2005). Examination of hole-to-hole streakiness on the PGA tour. Perceptual and Motor Skills, 100, 806–814.
Coates, D., & Humphreys, B. R. (1999). The growth effects of sport franchises, stadia, and arenas. Journal of Policy Analysis and Management, 18, 601–624.
Coates, D., & Humphreys, B. R. (2001). The economic consequences of professional sports strikes and lockouts. Southern Economic Journal, 67, 737–747.
Coates, D., & Matheson, V. (2011). Mega-events and housing costs: Raising the rent while raising the roof? The Annals of Regional Science, 46(1), 119–137.
Cochran, J. J. (2008). The optimal value and potential alternatives of Bill James’ Pythagorean method of baseball. StatOR, 8(2).
Cochran, J.J. (2010). The emergence of sports analytics: From baseball and football to basketball and hockey, analytics gets a year-round workout in the athletics arena, analytics, Jan/Feb, http://analytics-magazine.org/the-emergence-of-sport-analytics/
Cochran, J. J. (2013). Change point plots: A graphical method for identifying changes in the distribution of a random variable over time. In K. D. Lawrence & R. K. Klimberg (Eds.), Contemporary perspectives in data mining, Ch 5 (pp. 61–72). Charlotte: Information Age Publishing.
Cochran, J. J., & Blackstock, R. (2009). Pythagoras and the national hockey league. Journal of Quantitative Analysis in Sports, 5(2), 11.
Cover, T. M., & Keilers, C. W. (1977). An offensive earned-run average for baseball. Operations Research, 25(5), 729–740.
Crowninshield, R. D. (1978). Use of optimization techniques to predict muscle forces. Journal of Biomechanics, 100, 88–92.
Csapo, P., Avugos, S., Raab, M., & Bar-Eli, M. (2015). The effect of perceived streakiness on the shot-taking behaviour of basketball players. European Journal of Sport Science, 15(7), 647–654.
Dapena, J., McDonald, C., & Cappaert, J. (1990). A regression analysis of high jumping technique. International Journal of Sport Biomechanics, 6(3), 246–261.
Davy, D. T., & Audu, M. L. (1987). A dynamic optimization technique for predicting muscle forces in the swing phase of gait. Journal of Biomechanics, 20(2), 187–201.
Dawson, P., & Dobson, S. (2010). The influence of social pressure and nationality on individual decisions: Evidence from the behaviour of referees. Journal of Economic Psychology, 31(2), 181–191.
Dawson, P., Dobson, S., Goddard, J., & Wilson, J. (2007). Are football referees really biased and inconsistent? Evidence on the incidence of disciplinary sanction in the English premier league. Journal of the Royal Statistical Society: Series A (Statistics in Society), 170(1), 231–250.
Dayaratna, K. D., & Miller, S. (2012). The Pythagorean won-loss formula and hockey: A statistical justification for using the classic baseball formula as an evaluative tool in hockey. The Hockey Research Journal, 16, 193–209.
de Werra, D. (1980). Geography, games, and graphs. Discrete Applied Mathematics, 2, 327–337.
de Werra, D. (1981). Scheduling in sports. In P. Hansen (Ed.), Studies on graphs and discrete programming (pp. 381–395). Amsterdam: North Holland.
de Werra, D. (1982). Minimizing irregularities in sports schedules using graph theory. Discrete Applied Mathematics, 4, 217–226.
de Werra, D. (1988). Some models of graphs for scheduling sports competitions. Discrete Applied Mathematics, 21, 47–65.
de Werra, D., Jacot-Descombes, L., & Masson, P. (1990). A constrained sports scheduling problem. Discrete Applied Mathematics, 26(1), 41–49.
Deutscher, C. (2015). No referee Bias in the NBA: New evidence with leagues’ assessment data. Journal of Sports Analytics, 1(2), 91–96.
Dobson, S. M., & Goddard, J. A. (1998). Performance and revenue in professional league football: Evidence from granger causality tests. Applied Economics, 30(12), 1641–1651.
Dohmen, T. J. (2008). The influence of social forces: Evidence from the behavior of football referees. Economic Inquiry, 46(3), 411–424.
Dorsey-Palmateer, R., & Smith, G. (2004). Bowlers’ hot hands. The American Statistician, 58(1), 38–45.
Easton, K., Nemhauser, G., & Trick, M. A. (2001). The travelling tournament problem: Description and benchmarks. In T. Walsh (Ed.), Principles and practice of constraint programming (Lecture notes in computer science) (Vol. 2239, pp. 580–585). Berlin: Springer.
Eckard, E. W. (2001). Free agency, competitive balance, and diminishing returns to pennant contention. Economic Inquiry, 39(3), 430–443.
Falcous, M., & Silk, M. L. (2010). Olympic bidding, multicultural nationalism, terror, and the epistemological violence of ‘making Britain proud’. Studies in Ethnicity and Nationalism, 10(2), 167–186.
Fort, R. (2006). The value of Major League Baseball ownership. International Journal of Sport Finance, 1(1), 9–20.
Forthofer, R. (1991). Streak shooter–The sequel. Chance, 4, 46–48.
Frohlich, C. (1994). Baseball: Pitching no-hitters. Chance, 7, 24–30.
Garicano, L., Palacios-Huerta, I., & Prendergast, C. (2005). Favoritism under social pressure. Review of Economics and Statistics, 87(2), 208–216.
Gatti, C. J., Scibek, J., Svintsitski, O., Carpenter, J. E., & Hughes, R. E. (2008). An integer programming model for optimizing shoulder rehabilitation. Annals of Biomedical Engineering, 36(7), 1242–1253.
Gilden, D. L., & Wilson, S. G. (1995). Streaks in skilled performance. Psychonomic Bulletin and Review, 2, 260–265.
Gill, P. S. (2000). Late-game reversals in professional basketball, football, and hockey. The American Statistician, 54(2), 94–99.
Gilovich, T., Vallone, R., & Tversky, A. (1985). The hot hand in basketball: On the misperception of random sequences. Cognitive Psychology, 17, 295–314.
Goswami, S., Srivastava, V. K., & Rajpoot, Y. S. (2016). A biomechanical analysis of spin bowling in cricket. European Journal of Physical Education and Sport Science, 2(6), 11–26.
Gray, R., & Allsop, J. (2013). Interactions between performance pressure, performance streaks, and Attentional focus. Journal of Sport & Exercise Psychology, 35, 368–386.
Green, B. S., & Zwiebel, J. (2017). The hot-hand fallacy: Cognitive mistakes or equilibrium adjustments? Evidence from Major League Baseball. Management Science, 64(11), 5315–5348.
Guedes, A., & Ribeiro, C. C. (2009). A hybrid heuristic for minimizing weighted carry-over effects in round Robin tournaments. In Proceedings of the 4th multidisciplinary international conference on scheduling theory and applications, Dublin (pp. 115–129).
Hall, S., Szymanski, S., & Zimbalist, A. (2002). Testing causality between team performance and payroll: The cases of Major League Baseball and English soccer. Journal of Sports Economics, 3(2), 149–168.
Hamilton, B., & Kahn, P. (1997). Baltimore’s Camden yards ballparks. In R. G. Noll & A. Zimbalist (Eds.), Sports, jobs & taxes: The economic impact of sports teams and stadiums (pp. 92–118). Washington, D. C: Brookings Institution.
Hill, A. D., Aime, F., & Ridge, J. W. (2016). 10 years of data on baseball teams shows when pay transparency backfires. Strategic Management Journal, 38(9), 1935–19476.
Hollinger, J. (2011). What is PER? ESPN.com. Retrieved Aug 8, from http://www.espn.com/nba/columns/story?columnist=hollinger_john&id=2850240
Humphreys, B. R., & Lee, Y. S. (2009). Franchise values in North American professional sports leagues: Evidence from the repeat sales method. International Journal of Sport Finance, 3(2), 98–105.
Humphreys, B. R., & Mondello, M. (2008). Determinants of franchise values in North American professional sports leagues: Evidence from a hedonic price model. International Journal of Sport Finance, 3, 98–105.
Huremović, T., Biberović, A., & Pojskić, H. (2017). Predictive value of kinematic parameters on the results of the long jump with students. Sport SPA, 6(2), 19–24.
James, B. (1982). The Bill James baseball abstract. New York: Ballantine Books.
Jandacka, D., & Vaverka, F. (2008). A regression model to determine load for maximum power output. Sports Biomechanics, 7(3), 361–371.
Jaworski, J., & Żak, M. (2016). Identification of determinants of sports skill level in badminton players using the multiple regression model. Human Movement, 17(1), 21–28.
Kahn, L. M. (1992). The effects of race on professional football players’ compensation. Industrial and Labor Relations Review, 45(2), 295–310.
Kahn, L. M., & Sherer, P. D. (1988). Racial differences in professional basketball players’ compensation. Journal of Labor Economics, 6(1), 40–61.
Kasimati, E. (2003). Economic aspects and the summer Olympics: A review of related research. International Journal of Tourism Research, 5, 433–444.
Kasimati, E., & Dawson, P. (2009). Assessing the impact of the 2004 Olympic games on the Greek economy: A small macroeconometric model. Economic Modelling, 26(1), 139–146.
Katis, A., Amiridis, I., Kellis, E., & Lees, A. (2014). Recovery of powerful kick biomechanics after intense running fatigue in male and female soccer players. Asian Journal of Sports Medicine, 5(4), e24013.
Kavestos, G. (2012). The impact of the London Olympics on property prices. Urban Studies, 49(7), 1453–1470.
Kavestos, G., & Szymanski, S. (2010). National Well-being and international sports events. Journal of Economic Psychology, 31(2), 158–171.
Kendall, G., Knust, S., Ribeiro, C. C., & Urrutiad, S. (2010). Scheduling in sports: An annotated bibliography. Computers & Operations Research, 37(1), 1–19.
Klaassen, F. J. G. M., & Magnus, J. R. (2001). Are points in tennis independent and identically distributed? Evidence from a dynamic binary panel data model. Journal of the American Statistical Association, 96, 500–509.
Koehler, J. J., & Conley, C. (2003). The ‘hot hand’ myth in professional basketball. Journal of Sport & Exercise Psychology, 25, 253–261.
Krautmann, A. C. (2017). Risk-averse team owners and players’ salaries in Major League Baseball. Journal of Sports Economics, 18(1), 19–33.
Larkey, P. D., Smith, R. A., & Kadane, J. B. (1989). It’s okay to believe in the ‘hot hand’. Chance, 2(4), 22–30.
Larsen, A., Fenn, A., & Spenner, E. (2006). The impact of free agency and the salary cap on competitive balance in the National Football League. Journal of Sports Economics, 7(4), 374–390.
Lee, J. H., Lee, Y. H., & Lee, Y. H. (2006). Mathematical modeling and Tabu search heuristic for the traveling tournament problem. In M. Gavrilova et al. (Eds.), Computational science and its applications - ICCSA 2006 (Lecture notes in computer science) (Vol. 3982). Berlin: Springer.
Lertwachara, K., & Cochran, J. J. (2007). An event study of the economic impact of professional sport franchises on local U.S. economies. Journal of Sports Economics, 8(3), 244–254.
Linde, R. (2004). NCAA and NFL pass-efficiency formulas. http://www.4malamute.com/zl4.html
Lindsey, G. R. (1959). Statistical data useful for the operation of a baseball team. Operations Research, 7(2), 197–207.
Lindsey, G. R. (1963). An investigation of strategies in baseball. Operations Research, 11(4), 477–501.
Madden, J. R. (2002). The economic consequences of the Sydney Olympics. Current Issues in Tourism, 5(1), 7–21.
Malisoux, L., Delattre, N., Urhausen, A., & Theisen, D. (2017). Shoe cushioning, body mass and running biomechanics as risk factors for running injury: A study protocol for a randomised controlled trial. BMJ Open, 7(8), e017379.
Matheson, V. A. (2005). Contrary evidence on the economic effect of the super bowl on the Victorious City. Journal of Sports Economics, 6(4), 420–428.
Matheson, V. A. (2014). Big time sports in American universities. Eastern Economic Journal, 40(2), 282–283.
Matheson, V. A., O’Connor, D. J., & Herberger, J. H. (2012). The bottom line: Accounting for revenues and expenditures in intercollegiate athletics. International Journal of Sport Finance, 7(1), 30–45.
McKay, J. L., & Ting, L. H. (2012). Optimization of muscle activity for task-level goals predicts complex changes in limb forces across biomechanical contexts. PLoS Computational Biology, 10(5), e1002465.
Miller, P. (2007). Private financing and sports franchises values: The case of Major League Baseball. Journal of Sports Economics, 8, 449–467.
Miller, P. (2009). Facility age and ownership in major American team sports leagues: The effect on team franchise values. International Journal of Sport Finance, 4, 176–191.
Miyashiro, R., & Matsui, T. (2005). A polynomial-time algorithm to find an equitable home-away assignment. Operations Research Letters, 33, 235–241.
Miyashiro, R., Iwasaki, H., & Matsui, T. (2003). Characterizing feasible pattern sets with a minimum number of breaks. In E. K. Burke & P. de Causmaecker (Eds.), Practice and theory of automated timetabling IV (Lecture notes in computer science) (Vol. 2740, pp. 78–99). Berlin: Springer.
Mondello, M., & Maxcy, J. (2009). The impact of salary dispersion and performance bonuses in NFL organizations. Management Decision, 47(1), 110–123.
Morey, D. (2003). In J. Dewan & D. Zminda (Eds.), STATS basketball scoreboard (p. 17). Chicago: STATS, Inc.
Morrison, D. G. (1976). On the optimal time to pull the goalie: A Poisson model applied to a common strategy used in ice hockey. TIMS Studies in the Management Sciences, 4, 67–78.
Morrison, D. G., & Wheat, R. D. (1986). Misapplications reviews: Pulling the goalie revisited. Interfaces, 16(6), 28–34.
Moskowitz, T., & Wertheim, L. J. (2011). Scorecasting: The hidden influences behind how sports are played and games are won. New York: Three Rivers Press.
Müller, M. (2015). After Sochi 2014: Costs and impacts of Russia’s Olympic games. Eurasian Geography and Economics, 55(6), 628–655.
Mullet, G. M. (1977). Simeon Poisson and the National Hockey League. The American Statistician, 31(1), 8–12.
Myer, G. D., Ford, K. R., Khoury, J., Succop, P., & Hewett, T. E. (2011). Biomechanics laboratory-based prediction algorithm to identify female athletes with high knee loads that increase risk of ACL injury. British Journal of Sports Medicine, 45(4), 245–252.
Oliver, D. (2004). Basketball on paper. Dulles, VA: Potomac Books.
Peeters, T., Matheson, V. A., & Szymanski, S. (2014). Tourism and the 2010 World Cup: Lessons for developing countries. Journal of African Economies, 23(2), 290–320.
Pierce, J. E., & Li, G. (2005). Muscle forces predicted using optimization methods are coordinate system dependent. Journal of Biomechanics, 38(4), 695–702.
Pope, B. R., & Pope, N. G. (2015). Own-nationality bias: Evidence from UEFA champions league football referees. Economic Inquiry., 53(2), 1292–1304.
Pope, D. G., Price, J., & Wolfers, J. (2013). Awareness reduces racial bias (No. w19765). Cambridge, MA: National Bureau of Economic Research.
Post, G., & Woeginger, G. J. (2006). Sports tournaments, home-away assignments, and the break minimization problem. Discrete Optimization, 3, 165–173.
Price, J., & Wolfers, J. (2010). Racial discrimination among NBA referees. Quarterly Journal of Economics, 125(4), 1859–1887.
Price, J., Remer, M., & Stone, D. F. (2012). Subperfect game: Profitable biases of NBA referees. Journal of Economics & Management Strategy, 21(1), 271–300.
Propheter, G. (2019). Estimating the effect of sports facilities on local area commercial rents: Evidence from Brooklyn’s Barclays Center. Journal of Sports Economics, 20(1), 91–114.
Raab, M. (2002). Hot hand in sports–The belief in hot hand of spectators in volleyball. In M. Koskolou, N. Geladas, & V. Klissouras (Eds.), ECSS proceedings (Seventh congress of the European congress of sport sciences) (Vol. 2, p. 971). Athens: Trepoleos.
Rasmussen, R. V., & Trick, M. A. (2007). A benders approach for the constrained minimum break problem. European Journal of Operational Research, 177, 198–213.
Regin, J. C. (2001). Minimization of the number of breaks in sports scheduling problems using constraint programming. In E. Freuder & R. Wallace (Eds.), Constraint programming large scale discrete optimization (DIMACS series in discrete mathematics and theoretical computer science) (Vol. 57, pp. 115–130). Princeton, NJ: DIMACS.
Ribeiro, C. C. (2012). Sports scheduling: Problems and applications. International Transactions in Operational Research, 9(1–2), 201–226.
Ribeiro, C. C., & Urrutia, S. (2007). Scheduling the Brazilian soccer championship. In E. Burke & H. Rudová (Eds.), Lecture notes in computer science (Practice and theory of automated timetabling VI) (Vol. 3867, pp. 149–159). Berlin: Springer.
Rickey, B. (1954). Goodbye to some old baseball ideas. Life, 2, 78–89.
Ritchie, B. W., Shipway, R., & Cleeve, B. (2009). Resident perceptions of mega-sporting events: A non-host city perspective of the 2012 London Olympic games. Journal of Sport and Tourism, 14(2–3), 143–167.
Romer, D. (2006). Do firms maximize? Evidence from professional football. Journal of Political Economy, 114(2), 340–365.
Rose, A. K., & Spiegel, M. M. (2011). The Olympic effect. The Economic Journal, 121(553), 652–677.
Rosenfeld, J., Fisher, J., Adler, D., & Morris, C. (2005). Predicting overtime with the Pythagorean formula. Journal of Quantitative Analysis in Sports, 6(2), 1–19.
Ross, H., Miller, R. H., Gillette, J. C., Derrick, T. R., & Caldwell, G. E. (2009). Muscle forces during running predicted by gradient-based and random search static optimisation algorithms. Computer Methods in Biomechanics and Biomedical Engineering, 12(2), 217–225.
Russell, K. G. (1980). Balancing carry-over effects in round Robin tournaments. Biometrika, 67, 127–131.
Scelles, N., Helleu, B., Durand, C., & Bonnal, L. (2013). Determinants of professional sports firm values in the United States and Europe: A comparison between sports over the period 2004–2011. International Journal of Sport Finance, 8, 280–293.
Scelles, N., Helleu, B., Durand, C., & Bonnal, L. (2016). Professional sports firm values: Bringing new determinants to the foreground? A study of European soccer, 2005–2013. Journal of Sports Economics, 17(7), 688–715.
Scoppa, V. (2008). Are subjective evaluations biased by social factors or connections? An econometric analysis of soccer referee decisions. Empirical Economics, 35(1), 123–140.
Scully, G. (1974). Pay and performance in Major League Baseball. American Economic Review, 64, 915–930.
Shan, G., Yuan, J., Hao, W., Gu, M., & Zhang, X. (2012). Regression equations for estimating the quality of maximal instep kick by males and females in soccer. Kinesiology, 44(2), 139–147.
Smith, G. (2003). Horseshoe pitchers’ hot hands. Psychonomic Bulletin & Review, 10, 753–758.
Song, W. (2013). Study on the analysis and simulation of Fosbury flop technique based on the sports biomechanics. Biotechnology, 8(10), 1331–1336.
Stern, H. S. (1995). Who’s hot and who’s not: Runs of success and failure in sports. In 1995 proceedings of the section on statistics in sports (pp. 26–35). Alexandria, VA: American Statistical Association.
Stern, H. S. (1997). A statistician reads the sports pages: Judging who’s hot and Who’s not. Chance, 10(2), 40–43.
Sutter, M., & Kocher, M. G. (2004). Favoritism of agents–The case of referees’ home Bias. Journal of Economic Psychology, 25(4), 461–469.
Szymanski, S. (2011). About winning: The political economy of awarding the World Cup and the Olympic games. SAIS Review, 31(1), 87–97.
Thorn, J., & Palmer, P. (1993). Total Baseball. New York: Harper Collins Publishers.
Tversky, A., & Gilovich, T. (1989a). The cold facts about the ‘hot hand’ in basketball. Chance, 2(1), 16–21.
Tversky, A., & Gilovich, T. (1989b). The ‘hot hand’: Statistical reality or cognitive illusion? Chance, 2(4), 31–34.
Vergin, R. C. (2000). Winning streaks in sports and the misperception of momentum. Journal of Sport Behavior, 23, 181–197.
Wardrop, R. L. (1995). Simpson’s paradox and the hot hand in basketball. The American Statistician, 49, 24–28.
Wardrop, R. L. (1999). Statistical tests for the hot-hand in basketball in a controlled setting. American Statistician, 1, 1–20.
WinterGreen Research. (2015). Sports analytics: Market shares, strategies, and forecasts, worldwide, 2015 to 2021. Lexington, MA: WinterGreen Research, INC.. http://wintergreenresearch.com/sports-analytics.
Yaldo, L., & Shamir, L. (2017). Computational estimation of football player wages. International Journal of Computer Science in Sport, 16(1), 18–38.
Zhang, L., & Zhao, S. X. (2009). City branding and the Olympic effect: A case study of Beijing. Cities, 26(5), 245–254.
Zimbalist, A. (1992). Salaries and performance: Beyond the Scully model. In P. Sommers (Ed.), Diamonds are forever: The business of baseball (pp. 109–133). Washington, D.C.: Brookings Institution.
Zimbalist, A. (2015). The illusory economic gains from hosting the Olympics & World Cup. World Economics, 16, 1468–1838.
Author information
Authors and Affiliations
Corresponding author
Editor information
Editors and Affiliations
Appendices
Exercises
-
1.
In a study of the relationship between wind assistance and jump distance in the long jump, the researchers collected information on the long jump distances (in m) and the corresponding wind assistances (in m/s) for 90 recent attempts in NCAA competitions. These data are provided in the following table.
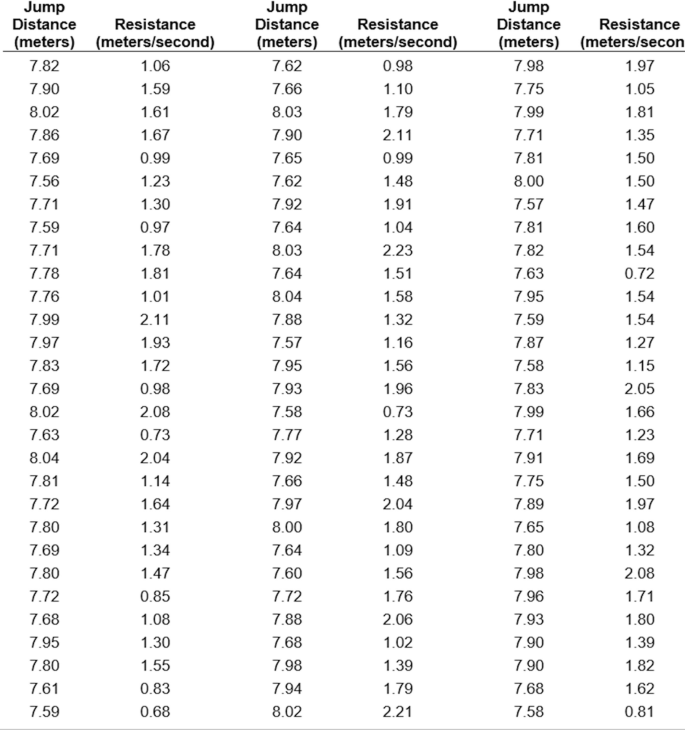
Create an appropriate graphical display of the relationship between long jump distance and wind assistance. What relationship does your graph suggest?
-
2.
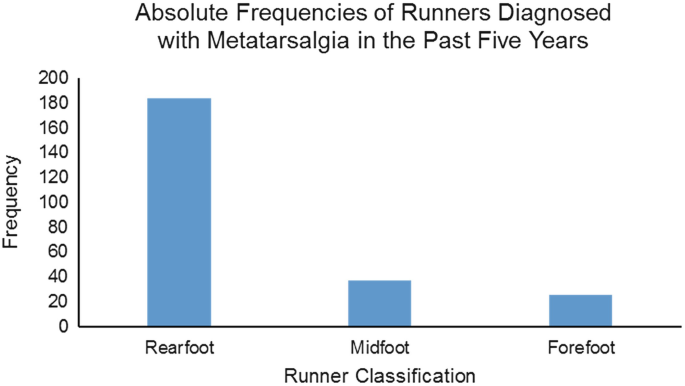
A researcher interested in metatarsalgia in runners has collected data from 1021 randomly selected runners who have been competitive for at least 5 years. Each runner was asked if she or he had been diagnosed with metatarsalgia in the past 5 years. In addition, each runner was classified as a rearfoot runner (strikes the ground with the heel first), midfoot runner (strikes the ground with the foot flat), or a forefoot runner (runs on the balls of the feet). The following table summarizes the data this researcher has collected:


-
(a)
Create a bar chart of the absolute frequencies of runners diagnosed with metatarsalgia in the past 5 years for the three runner classifications (rearfoot, midfoot, and forefoot). What does this graph suggest?
-
(b)
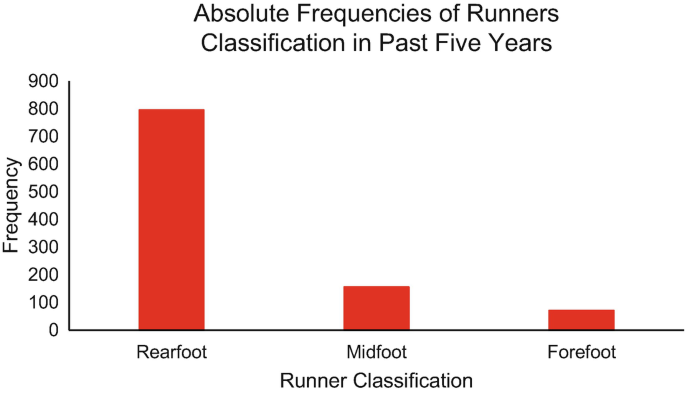
Create a bar chart of the absolute frequencies of the three runner classifications (rearfoot, midfoot, and forefoot). What does this graph suggest?
-
(c)
Create a bar chart of the relative frequencies of runners diagnosed with metatarsalgia in the past 5 years for the three runner classifications (rearfoot, midfoot, and forefoot). What does this graph suggest?
-
(d)
Review the results of parts (a), (b), and (c). Do you think the bar chart in part (a) or the bar chart in part (c) provides a more meaningful description of the incidence of metatarsalgia in the past 5 years for the three runner classifications (rearfoot, midfoot, and forefoot)?
-
3.
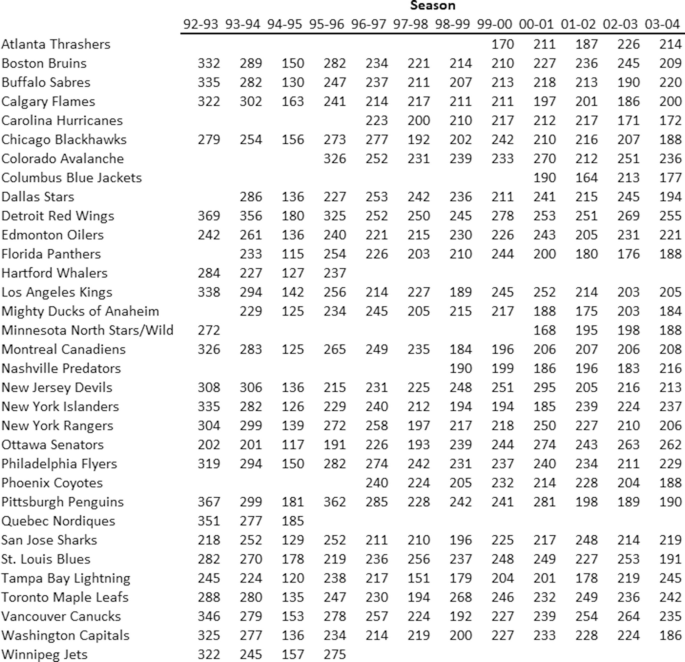
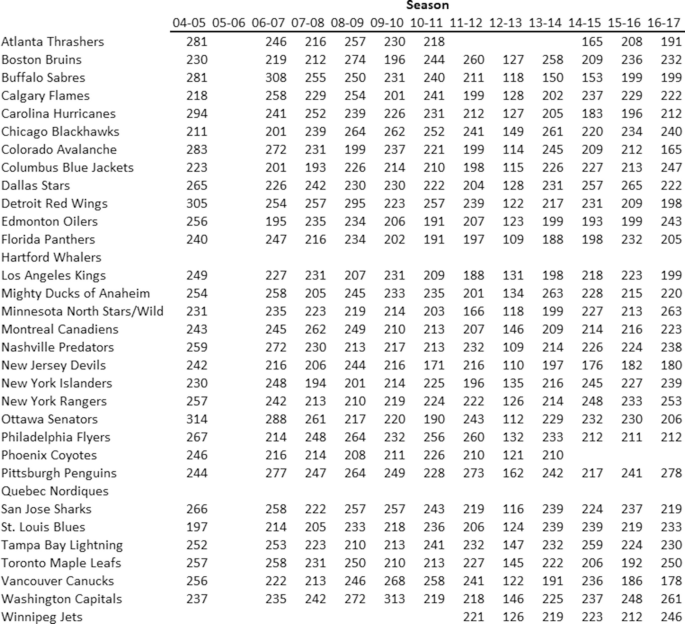
Collect data on the mean number of goals per game scored by each National Hockey League team for each of the past 25 seasons. Find the minimum, each quintile, and the maximum for each of these seasons and use the results to create a change point plot. Does your graph suggest any systematic changes in scoring in the National Hockey League over the past 25 seasons?
-
4.
The following data on Major League Baseball franchise value (in $ million) and age of the stadium in which the franchise plays its home games for the 2017 season have been collected from Forbes.com and BallparkDigest.com, respectively.
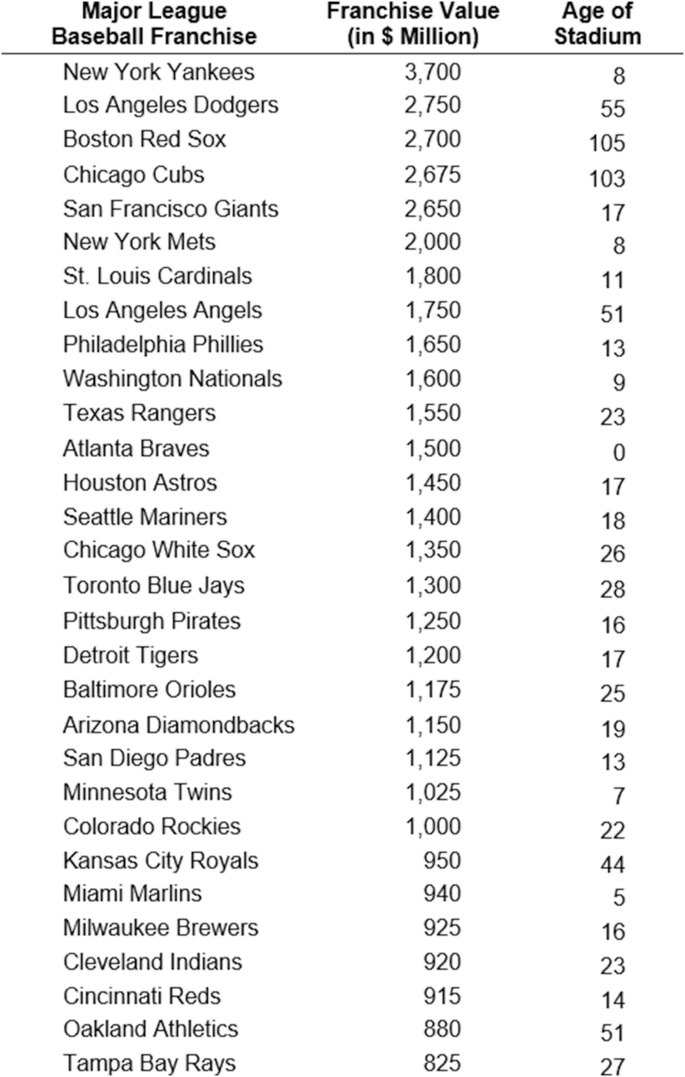
Perform a regression analysis similar to Miller (2009) on these data to estimate the relationship between the value of the Major League Baseball franchise and the age of the team’s playing facility.

-
(a)
What is the estimated change in Major League Baseball franchise value (in $ million) associated with a 1 year increase in the age of stadium in which the team plays?
-
(b)
Are your results similar to those reported by Miller? If not, what could explain the discrepancy between Miller’s findings and your results?
-
5.
The following table contains the annual total gross domestic product (GDP) in millions of dollars for the Oklahoma City metropolitan statistical area (MSA) from 2001 through 2016 as reported by the Federal Reserve Bank of St. Louis.
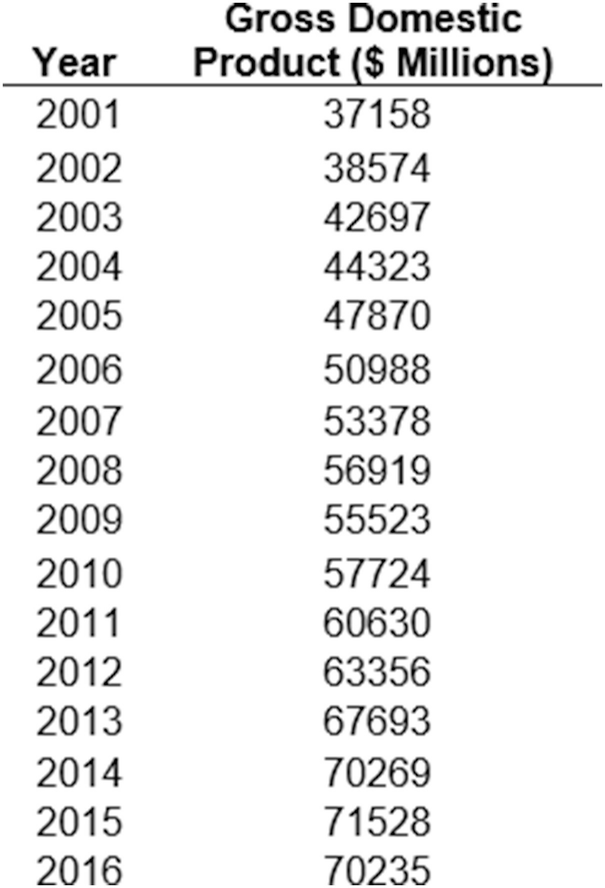
After the 2008 season, the National Basketball Association’s Seattle SuperSonics relocated to Oklahoma City and were renamed the Oklahoma City Thunder; the Thunder played its first season in Oklahoma City in 2009. Use the data in this table and regression analysis to assess the impact of the Thunder on the Oklahoma City MSA’s economy.

-
(a)
Create a new variable called LagGDP that is equal to the GDP of the previous year (i.e., in 2002 LagGDP = 37,158, in 2003 LagGDP = 38,574, etc.). Perform a regression analysis on the data for the years prior to the relocation of the Seattle SuperSonics to Oklahoma City (2001–2008) using GDP as the dependent variable and LagGDP as the independent variable. What does your regression model suggest about the Oklahoma City MSA’s economy during this period? Note that you will not be able to use the year 2001 in estimating your regression analysis because you do not have data on the GDP for the year 2000 (and so do not have a value for LagGDP for 2001).
-
(b)
Use the regression model for the Oklahoma City MSA’s GDP that you estimated in part (a) to estimate the Oklahoma City MSA’s GDP from 2009 to 2016 and calculate the error terms for these years. What does this suggest about the contribution the Oklahoma Thunder has made to the Oklahoma City MSAs GDP?
Solutions to Exercises
-
1.
The appropriate graphical display of the relationship between long jump distance and wind assistance is a scatter plot. Such a scatter plot follows.
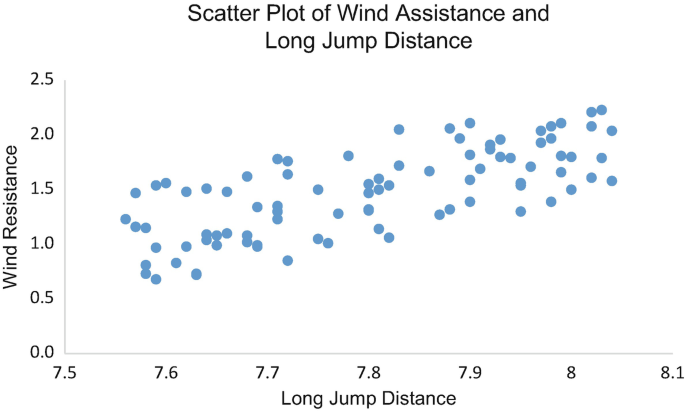

As one would expect, this graph suggests that wind assistance and long jump distance have a positive relationship.
-
2.
-
(a)
A bar chart of the absolute frequencies of runners diagnosed with metatarsalgia in the past 5 years for the three runner classifications (rearfoot, midfoot, and forefoot) follows.
-
(a)

-
(b)
This graph suggests that far more rearfoot runners than midfoot or forefoot runners were diagnosed with metatarsalgia over the past 5 years.
-
(c)
A bar chart of the absolute frequencies of rearfoot, midfoot, and forefoot runners follows.

-
(d)
This graph suggests that the rearfoot running technique is used far more frequently than the midfoot or forefoot running techniques.
-
(e)
A bar chart of the relative frequencies of rearfoot, midfoot, and forefoot runners follows.

-
(f)
This graph suggests that rearfoot runners were diagnosed with metatarsalgia far more frequently than midfoot or forefoot runners over the past 5 years.
-
(g)
The graph in (a) is misleading because, as the graph in (b) shows, the rearfoot running technique is used far more frequently than either the midfoot or forefoot running technique. Thus, the relative frequency graph in (c) more meaningful and revealing.
-
3.
The number of goals scored by each National Hockey League team for each of the past 25 seasons is provided in the table below:
The minimum, each quintile, and the maximum for each of these seasons are provided in the flowing table:
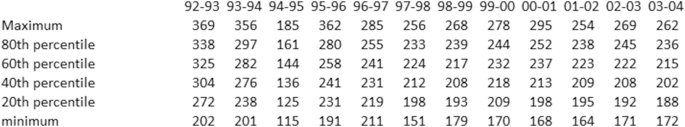
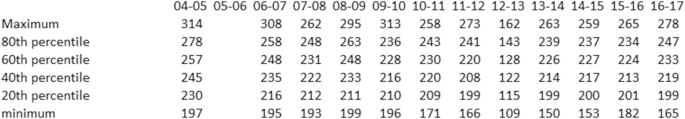
Using these results to create a change point plot yields the following graph:
First note the abrupt decreases in goals scored during the 1994–1995 and 2012–2013 seasons. These are primarily due to the 1994–1995 NHL lockout and the 2012–2013 NHL lockout, which each shortened the NHL regular season to 48 games.
Next note the gap in the graph during the 2004–2005 season. This is due to the 2004–2005 NHL lockout, which resulted in cancellation of the entire 2004–2005 NHL season.
The NHL’s labor troubles make it somewhat difficult to assess whether any changes occurred in the distribution of goals scored by teams across these seasons, but across the remaining years there appear to be either no dramatic shift or possibly a very slight downward trend.
Note that your graph and conclusions may differ if you collect data over a different set of 25 NHL seasons.


-
4.
(a) Let x = Age of Stadium in Which the Team Plays and y = Major League Baseball Franchise Value. We have that:
\( \sum \limits_{i=1}^n{x}_i{y}_i\,{=}\,1400675,\!\sum \limits_{i=1}^n{x}_i\,{=}\,791,\!\sum \limits_{i=1}^n{y}_i\,{=}\,46105,\!\sum \limits_{i=1}^n{x}_i^2\,{=}\,39155,\mathrm{and}\ n\,{=}\,30\vspace*{9pt} \) so
$$ {b}_1=\frac{1400675-\frac{(791)(46105)}{30}}{39155-\frac{791^2}{30}}=10.1120 $$and
$$ {b}_0=\frac{46105}{30}-(10.1120)\left(\frac{791}{30}\right)=1270.2126 $$Thus, the estimated Major League Baseball Franchise Value (\( \hat{y} \)) for some Age of Stadium in Which the Team Plays (x) is
$$ \hat{y}=1270.2126+10.1120x\vspace*{-6pt} $$These results suggest that a 1 year increase in Age of Stadium in Which the Team Plays (x) coincides with a $10.112 million increase in the estimated Major League Baseball Franchise Value (y).
-
(b)
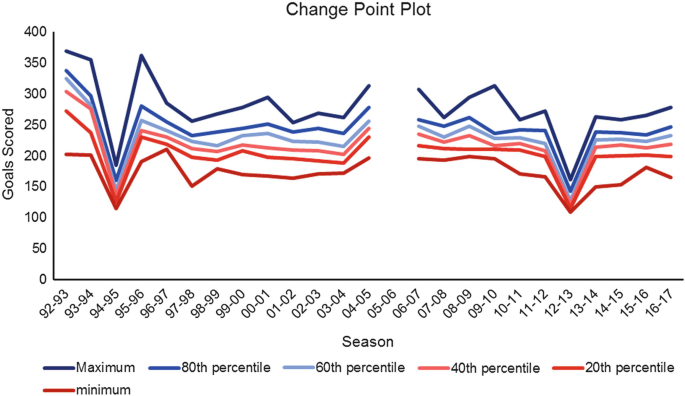
The results in (a) are not similar to those reported by Miller. This is likely because three of the four most valuable Major League Baseball franchises during this season (Los Angeles Dodgers, Boston Red Sox, and Chicago Cubs) have the three oldest stadiums (these franchises are represented by the three red points in the following scatter plot).
Consider the impact on the model of eliminating the Los Angeles Dodgers, Boston Red Sox, and Chicago Cubs from the data. If we do so and then re-estimate the regression model, we have
\( \sum \limits_{i=1}^n{x}_i{y}_i\,{=}\,690400, \sum \limits_{i=1}^n{x}_i\,{=}\,528, \sum \limits_{i=1}^n{y}_i\,{=}\,37980, \sum \limits_{i=1}^n{x}_i^2\,{=}\,39155,\mathrm{and}\ n\,{=}\,27\vspace*{9pt} \) so
$$ {b}_1=\frac{690400-\frac{(528)(37980)}{27}}{39155-\frac{528^2}{27}}=\hbox{-} 12.5448 $$and
$$ {b}_0=\frac{37980}{27}-\left(\hbox{-} 12.5448\right)\left(\frac{528}{27}\right)=1651.9864 $$The estimated Major League Baseball Franchise Value (\( \hat{y} \)) for some Age of Stadium in Which the Team Plays (x) is now
$$ \hat{y}=1651.9864\hbox{-} 12.5448x $$These results suggest that a 1 year increase in Age of Stadium in Which the Team Plays (x) coincides with a $12.5448 million decrease in the estimated Major League Baseball Franchise Value (y). This is consistent with Miller’s findings.
A superior approach would be to include a variable that represents the size of the market (perhaps population) as a second explanatory in a multiple regression.
-
(b)
-
5.
(a) Let x = LagGDP and y = GDP. We have that
\( \sum \limits_{i=1}^n{x}_i{y}_i=15295183317,\sum \limits_{i=1}^n{x}_i=314988,\sum \limits_{i=1}^n{y}_i=334749,\sum \limits_{i=1}^n{x}_i^2=14396756506,\mathrm{and}\ n=7\vspace*{6pt} \)
so
$$ {b}_1=\frac{15295183317-\frac{(314988)(334749)}{7}}{14396756506-\frac{314988^2}{7}}=1.0414 $$and
$$ {\displaystyle \begin{array}{l}{b}_0=\frac{334749}{7}-(1.0414)\left(\frac{314988}{7}\right)=962.0385\end{array}} $$Thus, the estimated GDP (\( \hat{y} \)) for some LagGDP (x) is
$$ \hat{y}=962.0385+1.0414x $$These results suggest that a $1 million increase in LagGDP (x) coincides with a $1.0414 million increase in the estimated GDP (y).
-
(b)
The regression model estimates of the Oklahoma City MSA’s GDP from 2009 to 2016 and corresponding error terms are provided in the following table.
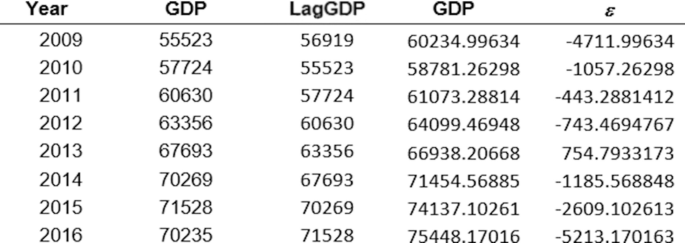
The errors are negative and decreasing in magnitude through 2012, and they become positive in 2013, indicating the impact the Oklahoma City Thunder may have had on the MSA’s GDP quickly dissipated after the team arrived. However, the errors were negative and increasing in magnitude from 2014 to 2016, indicating the MSA’s GDP grew faster than predicted by the model over these years. Further investigation would be required to assess if this is in any way attributable to the Oklahoma Thunder’s continued presence in the Oklahoma City MSA.
-
(b)


Rights and permissions
Copyright information
© 2019 Springer Nature Switzerland AG
About this chapter

Cite this chapter
Cochran, J.J. (2019). Overview of Numerical Methods: Applications of Analytical Methods in Sports. In: Pallis, J., McNitt-Gray, J., Hung, G. (eds) Biomechanical Principles and Applications in Sports. Springer, Cham. https://doi.org/10.1007/978-3-030-13467-9_6
Download citation
DOI: https://doi.org/10.1007/978-3-030-13467-9_6
Published:
Publisher Name: Springer, Cham
Print ISBN: 978-3-030-13465-5
Online ISBN: 978-3-030-13467-9
eBook Packages: Biomedical and Life SciencesBiomedical and Life Sciences (R0)