
Abstract
This chapter presents a set of tools, which allow gathering information about the frequency components of a time series. In a first step, we discuss spectral analysis and filtering methods. Spectral analysis can be used to identify and to quantify the different frequency components of a data series. Filters permit to capture specific components (e.g., trends, cycles, seasonalities) of the original time series. Both spectral analysis and standard filtering methods have two main drawbacks: (i) they impose strong restrictions regarding the possible processes underlying the dynamics of the series (e.g., stationarity) and (ii) they lead to a pure frequency-domain representation of the data, i.e., all information from the time-domain representation is lost in the operation.
In a second step, we introduce wavelets, which are relatively new tools in economics and finance. They take their roots from filtering methods and Fourier analysis, but overcome most of the limitations of these two methods. Their principal advantages derive from (i) combined information from both time domain and frequency domain and (ii) their flexibility as they do not make strong assumptions concerning the data-generating process for the series under investigation.
Access this chapter
Tax calculation will be finalised at checkout
Purchases are for personal use only
Notes
- 1.
The discrete version of the Fourier transform is used because the time series is recorded at discrete-time intervals.
- 2.
The jth autocovariance of x(t) is given by γ j = E[(x(t) − μ)(x(t − j) − μ)], where μ denotes the expected value of x(t).
- 3.
As an example, let us consider an economic variable, whose evolution is fully determined by the state of the economy. A complete business cycle lasts on average 36 months and therefore f = 1/36 months.
- 4.
See also Gençay et al. (2002) who uses a similar example.
- 5.
In full generality, the phase angle can be computed as \( \theta (f)= \arctan \left(\frac{ Im\left[H(f)\right]}{\mathrm{Re}\left[H(f)\right]}\right), \) where Im[H(f)] and Re[H(f)] are, respectively, the imaginary part and the real part of H(F).
- 6.
- 7.
- 8.
The Morlet wavelet is actually similar to a sin curve modulated by a Gaussian envelope.
Fig. 19.9 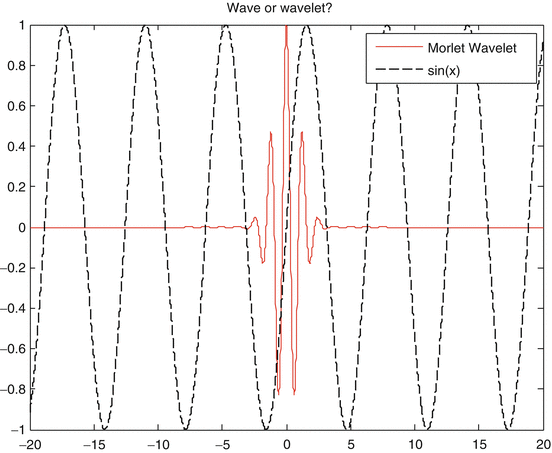
The Morlet wavelet and the sin function
- 9.
The low-pass filter can be directly obtained from the high-pass filter using the quadrature mirror relationship; see Percival and Walden (2000, p. 75).
- 10.
For two integer a and b, a modulus b is basically the remainder after dividing a by b, i.e., a mod b = a–c ċ b with c = ⌊a/b⌋.
- 11.
See Crowley (2007) for more details about the properties of MODWT.
- 12.
Our presentation of the multiresolution analysis is restricted to the case of the MODWT. Nevertheless, a very similar procedure exists for the DWT; see Percival and Walden (2000).
- 13.
One may notice that the variance of the scaling coefficient at scale J is 0 as v J is a scalar (the sample mean of x).
- 14.
Los Angeles (LA), San Francisco (SF), Denver (De), Washington (Wa), Miami (Mi), Chicago (Chi), Boston (Bos), Las Vegas (LV), New York (NY), Portland (Po), Charlotte (Cha), and Cleveland (Cl).
- 15.

References
Bouchaud, J.-P., & Potters, M. (2004). Theory of financial risk and derivative pricing: From statistical physics to risk management. Cambridge: Cambridge University Press.
Childers, D. (1978). Modern spectrum analysis. New York: IEEE Press.
Crowley, P. (2007). A guide to wavelets for economists. Journal of Economics Surveys, 21, 207–264.
Curci, G., & Corsi, F. (2012). Discrete sine transform for multi-scale realized volatility measures. Quantitative Finance, 12, 263–279.
Elder, J., & Jin, H. (2007). Long memory in commodity futures volatility: A wavelet perspective. The Journal of Futures Markets, 27, 411–437.
Fan, J., Fan, Y., & Yazhen, W. (2007). Multiscale jump and volatility analysis for high-frequency financial data. Journal of American Statistical Association, 102, 618–631.
Fernandez, V., & Lucey, B. (2007). Portfolio management under sudden changes in volatility and heterogeneous investment horizons. Physica A: Statistical Mechanics and its Applications, 375, 612–624.
Gençay, R., & Fan, Y. (2010). Unit root tests with wavelets. Econometric Theory, 26, 1305–1331.
Gençay, R., & Gradojevic, N. (2011). Errors-in-variables estimation with wavelets. Journal of Statistical Computation and Simulation, 81, 1545–1564.
Gençay, R., Selçuk, F., & Whitcher, B. (2002). An introduction to wavelets and other filtering methods in finance and economics. San Diego: Academic Press.
Gençay, R., Selçuk, F., & Whitcher, B. (2003). Systematic risk and timescales. Quantitative Finance, 3, 108–116.
Gençay, R., Gradojevic, N., Selçuk, F., & Whitcher, B. (2010). Asymmetry of information flow between volatilities across time scales. Quantitative Finance, 10, 895–915.
Gu, K. (2002). The predictability of house prices. Journal of Real Estate Research, 24, 213–234.
Hafner, C. (2012). Cross-correlating wavelet coefficients with applications to high-frequency financial time series. Journal of Applied Statistics, 39, 1363–1379.
Hamilton, J. (1994). Time series analysis. Princeton.
Hodrick, R., & Prescott, E. (1997). Postwar U.S. business cycles: An empirical investigation. Journal of Money, Credit, and Banking, 29, 1–16.
Iacobucci, A. (2003). Spectral analysis for economic time series. Documents de Travail de l’OFCE.
Kuo, C. (1996). Autocorrelation and seasonality in the real estate market. Journal of Real Estate Finance and Economics, 12, 139–162.
Kwapien, J., Oswiecimka, P., & Drozdz, S. (2007). Empirics versus RMT in financial cross-correlations. Acta Physica Polonica B, 38, 4027–4039.
Lynch, P., & Zumbach, G. (2003). Market heterogeneities and the causal structure of volatility. Quantitative Finance, 3, 320–331.
Manchaldore, J., Palit, I., & Soloviev, O. (2010). Wavelet decomposition for intra-day volume dynamics. Quantitative Finance, 10, 917–930.
Müller, U., Dacorogna, M., Davé, R., Pictet, O., Olsen, R., & Ward, J. (1995). Fractals and intrinsic time – A challenge to econometricians (Working Papers). Olsen and Associates. Zürich
Nielsen, M., & Frederiksen, P. (2005). Finite sample comparison of parametric, semiparametric, and wavelet estimators of fractional integration. Econometric Reviews, 24, 405–443.
Oswiecimka, P., Kwapien, J., & Drozdz, S. (2006). Wavelet versus detrended fluctuation analysis of multifractal structures. Physical Review E, 74, 016103.
Percival, D., & Walden, A. (2000). Wavelet methods for time series analysis. Cambridge: Cambridge University Press.
Ramsey, J. B. (1999). The contribution of wavelets to the analysis of economic and financial data. Philosophical Transactions of the Royal Society of London A, 357, 2593–2606.
Ramsey, J. B. (2002). Wavelets in economics and finance: Past and future. Studies in Nonlinear Dynamics & Econometrics, 3, 1–29.
Ramsey, J. B., & Zhang, Z. (1997). The analysis of foreign exchange data using waveform dictionaries. Journal of Empirical Finance, 4, 341–372.
Ramsey, J. B., Zaslavsky, G., & Usikov, D. (1995). An analysis of U. S. stock price behavior using wavelets. Fractals, 3, 377–389.
Rua, A., & Nunes, L. (2009). International comovement of stock market returns: A wavelet analysis. Journal of Empirical Finance, 16, 632–639.
Schleicher, C. (2002). An introduction to wavelets for economists (Working Paper). Bank of Canada.
Sharifi, S., Crane, M., Shamaie, A., & Ruskin, H. (2004). Random matrix theory for portfolio optimization: A stability approach. Physica A, 335, 629–643.
Struzik, Z. (2001). Wavelet methods in financial time-series processing. Physica A, 296, 307–319.
Subbotin, A. (2008). A multi-horizon scale for volatility. University of Paris-1: CES Working Paper 2008.20.
Vuorenmaa, T. (2005). A wavelet analysis of scaling laws and long-memory in stock market volatility, Bank of Finland Research Discussion Paper.
Welch, P. (1967). The use of fast Fourier transforms for the estimation of power spectra: A method based on time averaging over short modified periodograms. IEEE Transactions on Audio and Electroacoustics, 15, 70–73.
Author information
Authors and Affiliations
Corresponding author
Editor information
Editors and Affiliations
Rights and permissions
Copyright information
© 2015 Springer Science+Business Media New York
About this entry
Cite this entry
Masset, P. (2015). Analysis of Financial Time Series Using Wavelet Methods. In: Lee, CF., Lee, J. (eds) Handbook of Financial Econometrics and Statistics. Springer, New York, NY. https://doi.org/10.1007/978-1-4614-7750-1_19
Download citation
DOI: https://doi.org/10.1007/978-1-4614-7750-1_19
Published:
Publisher Name: Springer, New York, NY
Print ISBN: 978-1-4614-7749-5
Online ISBN: 978-1-4614-7750-1
eBook Packages: Business and Economics