
Abstract
Diabetes is a chronic disease or group of metabolic disease where a person suffers from an extended level of blood glucose in the body, which is either the insulin production is inadequate, or because the body’s cells do not respond properly to insulin. The constant hyperglycemia of diabetes is related to long-haul harm, brokenness, and failure of various organs, particularly the eyes, kidneys, nerves, heart, and veins. The objective of this research is to make use of significant features, design a prediction algorithm using Machine learning and find the optimal classifier to give the closest result comparing to clinical outcomes. The proposed method aims to focus on selecting the attributes that ail in early detection of Diabetes Miletus using Predictive analysis. The result shows the decision tree algorithm and the Random forest has the highest specificity of 98.20% and 98.00%, respectively holds best for the analysis of diabetic data. Naïve Bayesian outcome states the best accuracy of 82.30%. The research also generalizes the selection of optimal features from dataset to improve the classification accuracy.
Introduction
The annual report of World Health Association, add up to the number of individuals experiencing diabetes is 422 million the year (Write from which year to which year it is telling the statistics of 422 million). Consistently, there is a significant increment in the number individuals experiencing diabetes in different healing center. The world health organization (WHO) reports [1, 2] on “Diabetes Care 2018” by American Diabetes Association and Standards for Medical care in Diabetes, a study for correlation diverse races and their pay. Figure 1 demonstrates the diverse individuals (gender and wage) matured between 29 and 70 years, level of passing because of hypertension.

Survey of diabetes death rates among different category of people
Diabetes mellitus [3] is chronic, a ceaseless ailment where it caused because of the high sugar level in the circulatory system. It is caused because of the inappropriate working of the pancreatic beta cells. It has an impact on different parts of the body which incorporates pancreas glitch, risk of heart ailments, hypertension, kidney disappointments, pancreatic issues, nerve harm, foot issues, ketoacidosis, visual unsettling influences, and other eye issues, waterfalls and glaucoma and so on. There are different purposes behind reason like a way of life of a man, the absence of activity, sustenance propensities, heftiness, smoking, high cholesterol (Hyperlipidaemia), high blood pressure (Hyperglycaemia) etc. which fundamentally increment the risk of treating diabetes. It influences a wide range of ages, including youngsters to grown-up and matured people.
Pancreas [4] is an organ situated in the midriff area. It has 2 fundamental capacities one endocrine capacity and exocrine capacity. The endocrine aides for assimilation and an exocrine segment in pancreas keeps up the sugar level in the circulation system. The pancreas is related to numerous insufficiency and influences from different parts of the body [4]. Whenever the glucose, or sugar level is high in the circulatory system, Beta cells of pancreas discharges the insulin to the circulation system, to assimilate the exorbitant sugar substance from the blood into liver, later it is changed over into a frame vitality. Similarly, at whatever point the glucose level is low, the creation of insulin is occupied and generating of glucagon by the alpha cells of the pancreas will be started to keep up the glucose level in the blood. The admission sugar in the body likewise assumes an imperative job in diabetes [5].
Major report statistics from various health organisations
-
In 2017, National Diabetes Statistic Report [6] for Center Disease Control and Prevention (CDC), gives the facts give an account of the United States that 30.3 million individuals have diabetes, among that 23.1 are analyzed and 7.2 million are undiscovered individuals [7].
-
In 2018, the American Diabetes Association models of therapeutic care [2] in diabetes discharges a report about “Order and finding of diabetes” which incorporates the arrangement of diabetes, diabetes care, treatment objectives, criteria for conclusion test ranges and dangers esteems, chance engaged with diabetes.
-
In 2017, Global provides details regarding Diabetes by world wellbeing association [8], it expresses the weight of diabetes, hazard components and inconveniences of diabetes. Likewise, gives the data about counteracting diabetes in individuals with high hazard and overseeing diabetes at beginning times with fundamental solutions to be taken.
Diabetes [9, 10] is a long-haul issue, many hazard factors, intricacies, expandpassing’s rates. It is arranged into four kind’s type-1 [11], type-2 [12], prediabetes [13], and gestational diabetes [14].
Type-1 A serious, incessant illness happens frequently happens in youngsters and grownups. Here pancreas totally stops the creation of the insulin. The individual assaulted by Type 1 is totally subject to insulin from outer drugs to control the sugar levels in the body. The DCCT (Diabetes Control and intricacies trail) assisted the individual through the rundown solutions with being taken after to keep away from the symptoms, extreme difficulties on different organs and live longer better life through the rules and sustenance propensities [15]. A dietary methodology was found through these rules.
Type-2 It is a class of perpetual; non-insulin subordinate sickness regularly happens in grownups. There are a few realities of the events of sort 2 are hereditary and metabolic components, family history, physical dormancy overweight, heftiness, undesirable eating regimen, smoking propensities expands the danger of diabetes [16].
Prediabetes It is a phase before type 2 diabetes, where glucose level of the individual has been higher than typical yet not to the levels of sort 2. A man with prediabetes [13] condition has more odds of getting compose 2 under specific conditions and measures.
Gestational It is a basic classification influenced for ladies amid pregnancy [17, 18] A variety of hormones amid pregnancy and expanded insulin substance can prompt the high blood glucose level. The newly conceived babies have the odds of creating diabetes [14]. The dietary propensities to diminish the level of diabetes [19] (Fig. 2).

Diagnosis levels of diabetes-ranges
Diagnosis levels of diabetes (Fig. 2)
-
A1C tests/tested It is a blood trail of a person for recent months. The range of the various classes is recorded in the table. It is prescribed for diabetes and prediabetes.
-
FPG tests/tested It’s a Fasting plasma glucose test level is utilized to recognize prediabetes and diabetes.
-
OGT It is oral glucose, the blood test used to analyze the prediabetes, diabetes and gestational diabetes.
Effects of diabetes
Diabetes is influenced by different parts of the body which incorporates
-
a.
Loss of vision Retinopathy retina is a condition where the retina, optic nerve, the focal point is harmed. A result of finish night visual impairment issues, swelling in the region of the retina, lessening the contact the mind may happen. A Diabetic individual should deal with eye vision through a few tests and pharmaceutical at the beginning times [20]. The treatment incorporates visual sharpness testing, tonometry, student enlargement, and optic intelligibility tomography (OCT). Different medicines incorporate Anti-VEGF infusion therapy, focal/lattice macular laser medical procedure, corticosteroid.
-
b.
Kidney neuropathy Chronic kidney infection or diabetic neuropathy [21] is where the high sugar level in blood harms the vessels in the kidney. The usefulness of the kidney is to channel the waste and abundant water in the blood. Because of hypertension and sugar level in Kidney endeavours to have overhead to clean the blood this may prompt kidney disappointment or successive dialysis of blood is required. The treatment may incorporate kidney substitution treatment, kidney and pancreas transplant.
-
c.
Liver problems Liver assumes an indispensable job in adjusting the blood glucose level in blood through starch digestion by methods neoglucogenesis and glycogenosis’s [22]. Sort 2 diabetes expands the danger of liver issues. Fatty liver assumes the stipulate job in creating a liver tumour. The difficulties incorporate renal debilitation, modified metabolism, Insulin opposition and hyperglycaemia, malnutrition. Affect individual needs to experience different anti-toxin drugs [23] and administration of liver incorporates other treatment [24] like the way of life alteration, pharmacological treatment, insulin secretagogues, biguanides, α-glucosidase inhibitors, TZDs, weight to decrease.
-
d.
Heart problems Cardiovascular ailment [17]: According to American heart affiliation, 68% of individuals will experience the ill effects of heart issues to driving even to death, heart stroke, atherosclerosis or solidifying of the supply routes, stress and load on the heart make individual to death. Because of high sugar level, blood conveys greater thickness, it adheres to the veins, supply routes and veins put more strain to proceed onward. Persistently it harms the vessels and nerves prompting disappointment of circulatory framework or organ disappointment in person [25]. Hazard for creating cardiovascular illness incorporates hypertension, unusual cholesterol and high triglycerides, corpulence, the absence of physical activity. The effect of different clinical parameters like poor glycaemic control, insulin opposition of diabetes greatly affects heart issues [26].
-
e.
The different issues may incorporate foot issues and so on.
Data mining and classification
Information mining [27, 28] is a procedure of breaking with the gigantic measure of the dataset where the dataset is tremendously in volume, colossal in the assortment, to remove helpful data to settle on business choice or finding the comparative examples to settle on a better choice. It is utilized to find new examples, find comparable connections among information, co-relations between information, this can find answers for the issues, creating rules from old information, settling on best choices of ad lib the business arrangements, finding concealed information design from leaving datasets, expectation of future yield, i.e. practices and patterns.
A characterization procedure [29] which is utilized to fabricate another model from the input dataset. It tackles the issue of ordering the dataset and doling out the class marks for the informational index. An arrangement system examining the informational index and predicts the class names or allocates the gathering mark. The key goal of characterization is to produce the new models with great speculation anticipating capacity. The new model ought to be well form model to precisely characterize the dataset on their qualities to anticipate class names. Order demonstrates which takes the occasion of the dataset and doles out to the specific class name. It includes 2 stages.
Information Training informational index (step 1), Test dataset (step 2)
-
1.
In stage 1, preparing informational index comprises of information occasion and known or predefined class names. Grouping model breaks down the dataset and names and creates another model for the given dataset. The preparation set is utilized to assemble the new grouping model.
-
2.
In stage 2, Test informational index comprises of information occasion without class names. The recently produced demonstrate is connects to the test informational index to anticipate their class marks. The execution of the model is assessed through exactness rate, mistake rate and, different measurements.
-
3.
A number of right expectations versus adding up to the number of forecasts.
Model A Cancer Sample dataset comprises of 5000 disease patient’s subtle elements. Investigation of these points of interest may help the expectation of new patient in the case of anguish from disease or not. We have diverse characterization procedure, for example, Naïve Bayes classifier, Decision Trees and Support Vector Machines and so on.
Literature survey
Diabetes a non-communicable disease is leading to long-term complications and serious health problems. A report from the World Health Organisation [30] addresses diabetes and its complications that impact on individual physically, financially, economically over the families. The survey says about 1.2 million deaths due to the uncontrolled stage of health lead to death. About 2.2 million deaths occurred due to the risk factors of diabetes like a cardiovascular and other diseases.
Diabetes [31] is an ailment caused due to the extended level of sugar obsession in the blood. In this paper, discussed various classifiers, decision support system is proposed that uses the AdaBoost algorithm with Decision Stump as a base classifier for classification. Moreover, Support Vector Machine, Naive Bayes and Decision Tree have additionally executed as a base classifiers for AdaBoost calculation for exactness confirmation. The exactness got for AdaBoost calculation with choices stump as a base classifier is 80.72%, which is more note worthy contrasted with that of Support Vector Machine, Naive Bayes and Decision Tree.
Artificial intelligence is having more effect is machine realizing [32], which creates calculations ready to take in examples and choice standards from information. Machine learning calculations have been implanted into information mining pipelines, which can consolidate them with established measurable techniques, to remove learning from information. Inside the EU-financed MOSAIC undertaking, an information mining pipeline has been utilized to determine an arrangement of prescient models of sort 2 diabetes mellitus (T2DM) entanglements in light of electronic wellbeing record information of almost one thousand patients. Such pipeline includes clinical focus profiling, prescient model focusing on, prescient model development and model approval. In the wake of having managed to miss information by methods for irregular woods (RF) and having connected appropriate methodologies to deal with class unevenness, we have utilized Logistic Regression with the stepwise component choice to foresee the beginning of retinopathy, neuropathy, or nephropathy, at various time situations, at 3, 5, and 7 years from the main visit at the Hospital Center for Diabetes (not from the conclusion). Considered factors are sexual orientation, age, time of determination, weight file (BMI), glycated haemoglobin (HbA1c), hypertension, and smoking propensity. Lust models, custom fitted as per the complexities, gave an exact up to 0.838. Diverse factors were chosen for every complexity and time situation, prompting particular models simple to mean the clinical practice.
In this paper [33], analysis of a Pima Indian dataset is done using various classification techniques like Naïve Bayes, Zero R, J48, random forest, MLP, logistic regression. Comparison and prediction whether positive and negative diabetes. Diagnosing diabetes through data mining tool using the WEKA tool, in terms of accuracy and performance MLP is better.
Patients with diabetes should ceaselessly screen their blood glucose levels and modify insulin measurements, endeavouring to keep blood glucose levels as near typical as would be prudent [34]. Blood glucose levels that veer off from the typical range can prompt genuine here and now and long-haul intricacies. A programmed expectation shows that cautioned individuals of fast approaching changes in their blood glucose levels would empower them to make a preventive move. In this paper, we depict an answer that uses a bland physiological model of blood glucose progression to produce enlightening highlights for a support vector regression display that is prepared with tolerant particular information. The new model beats diabetes specialists at foreseeing blood glucose levels and could be utilized to envision right around a fourth of hypoglycaemic occasions 30 min ahead of time. In spite of the fact that the comparing exactness is right now only 42%, most false cautions are in close hypoglycaemic locales and hence patients reacting to these hypoglycaemia alarms would not be hurt by intercession.
Diabetes mellitus [7] is a standout amongst the most genuine wellbeing challenges in both creating and created nations [35]. As per the International Diabetes Federation, there are 285 million diabetic individuals around the world. This aggregate is relied upon to ascend to 380 million in 20 years. Because of its significance, an outline of a classifier for the recognition of Diabetes ailment with ideal cost and better execution is the need of the age. The Pima Indian diabetic database at the UCI machine learning research facility has turned into a standard for testing information mining calculations to see their expectation exactness in diabetes information arrangement. The proposed strategy utilizes SVM, a machine learning technique as the classifier for analysis of diabetes. The machine learning strategy centre around arranging diabetes illness from a high dimensional therapeutic dataset. The trial comes about got demonstrate that help vector machine can be effectively utilized for diagnosing diabetes illness.
The point of this examination is to the finding of diabetes illness, which is a standout amongst the most vital infections in the restorative field utilizing Generalized Discriminant Analysis (GDA) and Least Square Support Vector Machine (LS-SVM) [36]. Likewise, we proposed another course learning framework in light of Generalized Discriminant Analysis and Least Square Support Vector Machine. The proposed framework comprises of two phases. The primary stage, we have utilized Generalized Discriminant Analysis to discriminant highlight factors amongst sound and patient (diabetes) information as a pre-preparing process. The second stage, we have utilized LS-SVM so as to order of diabetes dataset. While LS-SVM acquired 78.21% grouping precision utilizing 10-overlap. cross approval, the proposed framework called GDA–LS-SVM got 82.05% order exactness utilizing 10-crease across approval. The heartiness of the proposed framework is inspected utilizing arrangement precision, k-crease cross-approval technique and disarray lattice. The acquired order exactness is 82.05% and it is exceptionally encouraging contrasted with the beforehand detailed grouping strategies.
Implementation methods
Decision tree
It is a supervised learning method, which is used for solving classification problems. Decision tree [37, 38] is a technique which iteratively breaks the given dataset into two or more sample data. The goal of the method is to predict the class value of the target variable. The decision tree will help to segregate the data set and builds the decision model to predict the unknown class labels. A decision tree can be constructed to both binary and continuous variables. Decision tree optimally finds the root node based upon the highest entropy value. This gives decision tree an advantage of choosing the most consistent hypothesis among the training dataset. An input to the decision tree is a dataset, consisting of several attributes and instances values and output will be the decision model. Issues faced while building a decision model are selecting the splitting attribute, splits, stopping criteria, pruning, training sample, quality and quantity, the order of splits etc.
Input: training data set
Output: decision model (tree structure).
The decision model is a tree structure, where a structure includes the collection of nodes. It includes the decision nodes (split node with the condition) and leaf nodes. The representation of the decision tree is shown in Fig. 3. Among the various attributes in the dataset, choosing the right attributes-root node to start the split is a difficult task. The decision node can have 2 or more branches. To start with the first node called root node. The model predicts the best attribute as the root node or best predictor node from the set of nodes available. There are many ways to choose the best attribute to be as the root node, based on the degree of impurity of the child nodes. The Performance measures [39] are Entropy, Giniindex, classification error. These measures are done for all attributes and comparison is done, to select the best spilt.

Model for decision tree
Naïve Bayesian
A classification algorithm [40, 41], a probabilistic classifier which is based on Bayes theorem with the independence assumption between the predictors. Naïve Bayesian method takes the dataset as input, performs analysis and predicts the class label using Bayes’ Theorem. It calculates a probability of class in input data and helps to predict the class of the unknown data sample.It is a powerful classification technique suitable for large datasets. The Bayes Theorem formula calculates the posterior probability for each class using below formula. The Flowchart for Naïve Bayesian is shown in Fig. 4.

Flow chart for Naïve Bayesian classification
-
P(c|x) is the posterior probability of class (target) given predictor (attribute).
-
P(c) is the prior probability of class.
-
P(x|c) is the likelihood which is the probability of predictor given class.
-
P(x) is the prior probability of predictor.
Support vector machine
It is a supervised learning, discriminative classification [42, 43] technique. This method can be used for both regression and classification. The logic behind the SVM is finding a hyper line between the dataset, which best divides the dataset into two classes as shown in Fig. 5. It includes 2 steps, Identifies the right or optimal hyper line in data space and Mapping the objects to the boundaries specified. The SVM training algorithm builds a model that assigns new samples to one of the classes.

Support vector machine-data distribution over the hyper line
Random forest
It is supervised learning, used for both classification and Regression. The logic behind the random forest [44, 45] is bagging technique to create random sample features. The difference between the decision tree and the random forest is the process of finding the root node and splitting the feature node will run randomly. The Steps are given below
-
a.
Load the data where it consists of “m” features representing the behaviour of the dataset.
-
b.
The training algorithm of random forest is called bootstrap algorithm or bagging technique to select n feature randomly from m features, i.e. to create random samples, this model trains the new sample to out of bag sample(1/3rd of the data) used to determine the unbiased OOB error.
-
c.
Calculate the node d using the best split. Split the node into sub-nodes.
-
d.
Repeat the steps, to find n number of trees.
-
e.
Calculate the total number of votes of each tree for the predicting target. The highest voted class is the final prediction of the random forest.
K nearest neighbour (KNN)
It is a classification technique which classifies the new sample based on similarity measure or distance measure. The measure includes 3 distance measures Euclide an distance, Manhattan, Minkowski. The steps for KNN is given below.
-
1.
Training phase of the algorithm consists of only storing the feature sample and class label of training sample.
-
2.
Classification phase: the user has to define a “k” value for the classification of the undefined sample for the k number of the class labels, so the unlabelled sample can be classified into the defined class based on the feature similarity.
-
3.
Majority of voting classification occurs for unlabelled class. The value of the k can be selected by various techniques like heuristic technique.
Data set description
The aim of the proposed work is to analyze the diabetes dataset over the classification techniques. Our research concentrates, to reduce the complications of diabetes through early predictions and to improve the prognosis (lives) of the people. A person with diabetes has considerable features for the cause of disease depending on the age, glucose level, heredity, and other factors, as well these features vary from one type to another type.
The dataset is collected from UCI machine repository archive.ics.uci.edu-Diabetes. We have a sample diabetic dataset (2500 data items), comprising of 15 attributes, and its description of attributes is given Table 1. Training and testing samples are different, for testing the data over the classification techniques, we have considered 768 data items.
The description of each attribute is given the below Table 1.
Modified approach
The modified approach includes the selection of the right attributes from the large database, based on the sensitivity of the dataset and the problem statement. The selection of right/optimal attributes for the problem, it requires an overall analysis of the attributes and ignoring the irrelevant attributes. The input dataset stated in Table 1 includes various attributes and its description. Selection of the right attributes adheres to the quality input dataset and quality results from the classification can be expected. Our approach includes 5 steps.
-
1.
Analysis of the attributes and importance of the attributes on the problem stated.
-
2.
Assigning a sequence of the dataset attributes from ni=0 to the nk=max, where max is the total number of attributes, and i is the attribute-1 (main cause).
Example For diabetes: Level of sugar attributes states the status of people suffering from diabetes.
-
3.
Input: Attribute-1 (Main attributes responsible for the cause).
-
4.
Process: Attribute-1 Co-relates the other attribute-n, and generates the value.
$${\text{Co-relation Value}} = \left[ {{\text{Attribute}}_{ \text{max} } {-}\mathop \sum \limits_{i = 1}^{N} Attribute(x_{i} )} \right]^{2} - 1$$
The process is continued with other attributes, values are compared with each attribute, if the value difference is more than the other attribute, then attribute has less significance, i.e. value-1 is compared with value-n. The best attributes are selected and arranged in a significant order and the final optimal features-dataset is given to the classification techniques.
-
5.
Output: Based on the best attributes selection, the results of the classification techniques can be improved. The flow chart of the technique is given below Fig. 6.
Fig. 6 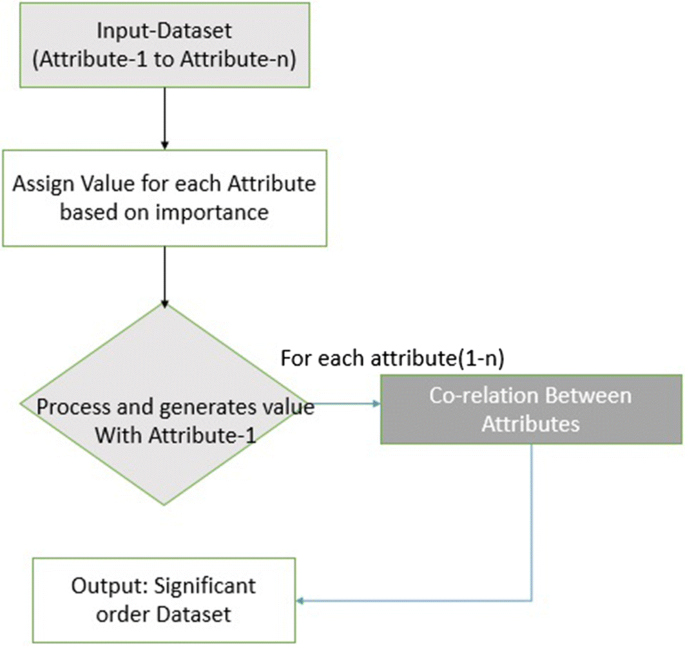
Flow chart for attribute selection

Experimental results
The performance evaluation of the classification techniques is done through the various performance measure such as accuracy, sensitivity, specificity, and recall, precision. Our research paper focus on the five classification techniques such as support vector machine, Random forest, Naïve Bayesian, decision tree and K-nearest neighbour. Table 2 shows the results of the classification technique. Our experiment is conducted through rapid miner data mining tool.
-
a.
Support vector machine: An SVM classification technique is applied on diabetic dataset. The accuracy of SVM is 77.73%. The results are shown in Table 3.
Table 3 Results of SVM -
b.
Random forest: The accuracy of random forest is 75.39. The Results is shown in Table 4. It generates tree structure to classify the attributes under various conditions in Fig. 7.
Table 4 Results of random forest Fig. 7 
A tree structure generated for random forest
-
c.
Naive Bayesian Classification: The accuracy is 73.48%. The results are shown in Table 5.
Table 5 Results of Naïve Bayesian -
d.
Decision tree classification: The accuracy is 73.18%. The results are shown in Tables 6, 7. The tree structure is shown in Fig. 8.
Table 6 Results of decision tree Table 7 Results of KNN Fig. 8 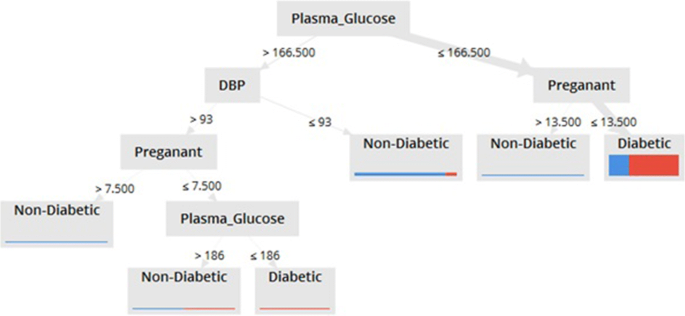
A diabetic decision tree generated using decision tree technique
-
e.
KNN: The accuracy of K-nearest neighbour is 63%. The results are shown in Tables 6, 7.


ROC Curve: Results of ROC in shown in Fig. 9—area under curve for the five classification techniques.

ROC curve
Discussion
Comparison of classification technique
The experimental results obtained are shown in Table 8. The results are compared with various performance measures such as sensitivity, specificity, positive ratio, negative ratio, disease prevalence, positive productivity, negative productivity and accuracy.
Figure 10—the above analysis gives an insight of the various machine learning models and its predictive accuracy in terms of the performance. We have considered all 15 attributes to evaluate the performance of classification.

Statistical comparison of algorithms
Results of modified approach for selection of attributes
Table 9 shows the attributes and their co-relation value of the proposed method. Originally we have 15 attributes, by selection of optimal attributes, we have selected 11 attributes and 4 attributes are ignored. We have excluded the plasma glucose postprandial, pregnancy, serum creatinine, HBAIC attributes from the dataset, since the correlation value is less compared to other attribute value. The highlighted coloured attributes indicates the ignored attributes.
Figure 11: the results represents improvised performance metrics of classification techniques.

Modified results: statistical comparison of algorithms
The above analysis gives an insight into various machine learning models and its predictive accuracy in terms of the performance. In the above analysis, the accuracy of the classification technique is improved, for the predictive task will become faster. The comparison of the accuracy of the various classifications is shown in Fig. 12.

Comparison of classification techniques-accuracy
Conclusion
Diabetes is a heterogeneous group of diseases. It’s characterized by chronic elevation of glucose in the blood. The main motto of the American diabetes association [46] is “To prevent and cure diabetes and to improve the lives of all people affected by diabetes”. To support the lives of the people all over the world, we are trying to detect and prevent the complications of diabetes at the early stage through predictive analysis by improving the classification techniques. Our proposed work also performs the analysis of the features in the dataset and selects the optimal features based on the correlation values. The decision tree algorithm and Random forest giving the highest specificity of 98.20% and 98.00%, respectively holds best for the analysis of diabetic data. Support vector machine and NB techniques give the accuracy of 77.73% and 73.48% respectively from the existing method and the proposed method improves the accuracy of the classification techniques. Improved SVM accuracy is 77% and NB accuracy is 82.30%, hence it is able to map the features effectively from low dimensions to high dimensions. It gives the best fit to the data with respect to the diabetic and non-diabetic patients. The Disease prevalence percentage is measured highest from the SVM is 45.7%.
Abbreviations
- WHO:
-
World Health Organisation
- CDC:
-
Center Disease Control and Prevention
- DCCT:
-
diabetes control and intricacies trail
- OCT:
-
optic intelligibility tomography
- T2DM:
-
type: 2 diabetes mellitus
- BMI:
-
body mass index
- SVM:
-
support vector machine
- GDA:
-
generalized discriminant analysis
- KNN:
-
K nearest neighbour
References
Global Report on Diabetes 2016 by World Health Organisation. http://www.who.int/diabetes/publications/grd-2016/en/, ISBN 978 92 4 156525 7.
Classification and Diagnosis of Diabetes: Standards of Medical Care in Diabetes—2018 American Diabetes Association Diabetes Care 2018; 41(Supplement 1): S13–S27. https://doi.org/10.2337/dc18-S002.
Alberti KG, Zimmet PZ. “Definition, diagnosis and classification of diabetes mellitus and its complications. Part 1: diagnosis and classification of diabetes mellitus provisional report of a WHO consultation. Diabet Med. 1998;15(7):539–53.
Kaddis JS, Olack BJ, Sowinski J, Cravens J, Contreras JL, Niland JC. Human pancreatic islets and diabetes research. JAMA J Am Med Assoc. 2009;301(15):1580–7. https://doi.org/10.1001/jama.2009.482.
World Health Organization. Guideline: sugars intake for adults and children. World Health Organization. 2015. http://www.who.int/iris/handle/10665/149782.
Centres for Disease Control and Prevention. National Diabetes Statistics Report. Atlanta: Centers for Disease Control and Prevention, US Department of Health and Human Services; 2017.
World Health Organisation Global Report on Diabetes 2017. http://www.who.int/diabetes/publications/grd-2016/en/, ISBN 978 92 4 156525 7.
Avogaro P, Crepaldi G, Enzi G, Tiengo A. Associazione di iperlipidemia, diabetemellito e obesita` di mediogrado. Acta DiabetolLat. 1967;4:36–41.
American Diabetes Association. Diagnosis and classification of diabetes mellitus. Diabetes Care. 2012;35(1):S64–71. https://doi.org/10.2337/dc12-S064.
Raha O, Chowdhury S, Dasgupta S, et al. Approaches in type 1 diabetes research: a status report. Int J Diab Dev Ctries. 2009;29(2):85–101. https://doi.org/10.4103/0973-3930.53126.
Bellamy L, Casas JP, Hingorani AD, Williams D. Type 2 diabetes mellitus after gestational diabetes: a systematic review and meta-analysis. Lancet. 2009;373:1773–9.
Meigs JB, D’Agostino RB Sr, Wilson PW, Cupples LA, Nathan DM, Singer DE. Risk variable clustering in the insulin resistance syndrome: the Framingham Offspring Study. Diabetes. 1997;46:1594–600.
Anna V, van der Ploeg HP, Cheung NW, Huxley RR, Bauman AE. Socio-demographic correlates of the increasing trend in prevalence of gestational diabetes mellitus in a large population of women between 1995 and 2005. Diabetes Care. 2008;31(12):2288–93.
Darnton-Hill I, Nishida C, James WPT. A life-course approach to diet, nutrition and the prevention of chronic diseases. Public Health Nutr. 2004;7(1):101–21.
Barengo NC, Katoh S, Moltchanov V, Tajima N, Tuomilehto J. The diabetes-cardiovascular risk paradox: results from a Finnish population-based prospective study. Eur Heart J. 2008;29(15):1889–95.
World Health Organization. Diagnostic criteria and classification of hyperglycaemia first detected in pregnancy. World Health Organization. 2013. http://www.who.int/iris/handle/10665/85975.
Metzger BE, Lowe LP, Dyer AR, et al. Hyperglycemia and adverse pregnancy outcomes. N Engl J Med. 2008;358:1991–2002.
Perera PK, Li Y. Functional herbal food ingredients used in type 2 diabetes mellitus. Phcog Rev. 2012;6:37–45. http://www.phcogrev.com/text.asp?2012/6/11/37/95863.
Oliver F, Rajendra AU, Ng EY, KwanHoong N, Jasjit SS. Algorithms for the automated detection of diabetic retinopathy using digital fundus images: a review. J Med Syst. 2012;36(1):145–57. https://doi.org/10.1007/s10916-010-9454-7.
Patil S, Kumaraswamy Y. Intelligent and effective heart attack prediction system using data mining and artificial neural networks. Eur J Sci Res. 2009;31(2009):642–56.
Picardi A, D’Avola D, Gentilucci UV, Galati G, Fiori E, Spataro S, et al. Diabetes in chronic liver disease: from old concepts to new evidence. Diabetes Metab Res Rev. 2006;22:274–83.
Gangopadhyay KK, Singh P. Consensus statement on dose modifications of antidiabetic agents in patients with hepatic impairment. Indian J EndocrMetab. 2017;21:341–54.
Tolman KG, Vivian F, Anthony D, Meng H. Tan, Spectrum of liver disease in type 2 diabetes and management of patients with diabetes and liver disease. Diabetes Care. 2007;30(3):734–43.
Scott MG, Ivor JB, Gregory LB, Alan C, Robert HE, Barbara VH, William M, Sidney CS, James RS. Diabetes and cardiovascular disease a statement for healthcare professionals from the American Heart Association. Circulation. 1999;100(10):1134–46.
de Mattos Matheus AS, Tannus LR, Cobas RA, Sousa Palma CC, Negrato CA, de Brito Gomes M. Impact of diabetes on cardiovascular disease: an update. Int J Hyperten. 2013;65:15. https://doi.org/10.1155/2013/653789.
Hand DJ. Principles of data mining. Drug Saf. 2007;30(7):621–2. https://doi.org/10.2165/00002018-200730070-00010.
Hand DJ, Blunt G, Kelly MG, et al. Data mining for fun and profit. Stat Sci. 2000;15(2):111–31.
Gennari J. Models of incremental concept formation. J Artif Intell. 1989;1:11–61.
Global report on diabetes by World Health Organisation. 2016, ISBN 978 92 4 156525 7.
VeenaVijayan V, Anjali C. Prediction and diagnosis of diabetes mellitus—a machine learning approach. Recent Adv. 2015. https://doi.org/10.1109/raics.2015.7488400.
Kavakiotis I, Tsave O, Salifoglou A, Maglaveras N, Vlahavas I, Chouvarda I. Machine learning and data mining methods in diabetes research. Comput Struct Biotechnol J. 2017;15:104–16.
Hina S, Shaikh A, Sattar SA. Analyzing diabetes datasets using data mining. J Basic Appl Sci. 2017;13:466–71.
Kevin P, Razvan B, Cindy M, Jay S, Frank S. A machine learning approach to predicting blood glucose levels for diabetes management. In: Modern artificial intelligence for health analytics. Papers from the AAAI-14. 2014.
Jegan Chitra. Classification of diabetes disease using support vector machine. Int J Eng Res Appl. 2013;3:1797–801.
Polat K, Güneş S, Arslan A. A cascade learning system for classification of diabetes disease: generalized discriminant analysis and least square support vector machine. Expert Syst Appl. 2008;34(1):482–7.
Quinlan JR, Rivest RL. Inferring decision trees using the minimum description lenght principle. Inform Comput. 1989;80(3):227–48.
Agrawal R, Ghosh S, Imielinski T, Iyer B, Swami A. An interval classifier for database mining applications. 1992. pp. 560–73.
Breiman L, Friedman JH, Olshen RA, Stone CJ. Classification and regression trees. Belmont: Wadsworth International Group; 1984.
Ash C, Farrow JAE, Wallbanks S, Collins MD. Phylogenetic heterogeneity of the genus bacillus revealed by comparative analysis of small subunit ribosomal RNA sequences. Lett Appl Microbiol. 1991;13:202–6.
Audic S, Claverie JM. The significance of digital gene expression profiles. Genome Res. 1997;7:986–95.
Wan V, Campbell W. Support vector machines for speaker verification and identification. In: IEEE proceeding. 2000.
Chapelle O, Haffner P, Vapnik V. Support vector machines for histogram-based image classification. IEEE Trans Neural Netw. 1999;10(5):1055–64.
Lee JW, Lee JB, Park M, Song SH. An extensive evaluation of recent classification tools applied to microarray data. Comput Stat Data Anal. 2005;48:869–85.
Yeung KY, Bumgarner RE, Raftery AE. Bayesian model averaging: development of an improved multi-class, gene selection and classification tool for microarray data. Bioinformatics. 2005;21:2394–402.
American Diabetes Association. Standards of medical care in diabetes—2011. Diabetes Care. 2011;34(Suppl 1):S11–61. https://doi.org/10.2337/dc11-S011.
Authors’ contributions
NS has performed analysis on dataset and methods supported in the research. TG. has done the quality metrics for the comparison of different classification technique. Both SN and TG have conducted experiments, including code implementation. Both authors read and approved the final manuscript.
Acknowledgements
The authors express their sincere gratitude to our Honourable Chancellor Dr. P. Shyama Raju Sir and REVA family for giving constant encouragement and support to carry out research at REVA University.
Competing interests
The authors declare that they have no competing interests.
Availability of data and materials
Not applicable.
Ethics approval and consent to participate
Not applicable.
Funding
Not applicable.
Publisher’s Note
Springer Nature remains neutral with regard to jurisdictional claims in published maps and institutional affiliations.
Author information
Authors and Affiliations
Corresponding author
Rights and permissions
Open Access This article is distributed under the terms of the Creative Commons Attribution 4.0 International License (http://creativecommons.org/licenses/by/4.0/), which permits unrestricted use, distribution, and reproduction in any medium, provided you give appropriate credit to the original author(s) and the source, provide a link to the Creative Commons license, and indicate if changes were made.
About this article

Cite this article
Sneha, N., Gangil, T. Analysis of diabetes mellitus for early prediction using optimal features selection. J Big Data 6, 13 (2019). https://doi.org/10.1186/s40537-019-0175-6
Received:
Accepted:
Published:
DOI: https://doi.org/10.1186/s40537-019-0175-6