
Abstract
Background
Phytocystatins (PhyCys) act as endogenous regulators of cysteine proteases (CysProt) involved in various physiological processes. Besides, PhyCys are involved in plant reactions to abiotic stresses like drought or darkness and have been used as effective molecules against different pests and pathogens. The barley PhyCys-CysProt system is considered a model of protease-inhibitor regulation of protein turnover. Thirteen barley cystatins (HvCPI-1 to HvCPI-13) have been previously identified and characterized. Among them HvCPI-2 has been shown to have a relevant role in plant responses to pathogens and pests, as well as in the plant response to drought.
Results
The present work explores the multiple role of this barley PhyCys in response to both, biotic and abiotic stresses, focusing on the impact of silencing this gene. HvIcy-2 silencing lines behave differentially against the phytopathogenic fungus Magnaporthe oryzae and a light deprivation treatment. The induced expression of HvIcy-2 by the fungal stress correlated to a higher susceptibility of silencing HvIcy-2 plants. In contrast, a reduction in the expression of HvIcy-2 and in the cathepsin-L and -B like activities in the silencing HvIcy-2 plants was not accompanied by apparent phenotypical differences with control plants in response to light deprivation.
Conclusion
These results highlight the specificity of PhyCys in the responses to diverse external prompts as well as the complexity of the regulatory events leading to the response to a particular stress. The mechanism of regulation of these stress responses seems to be focused in maintaining the balance of CysProt and PhyCys levels, which is crucial for the modulation of physiological processes induced by biotic or abiotic stresses.
Background
Among plant protease inhibitors, the cysteine protease (CysProt) inhibitors called phytocystatins (PhyCys) have been largely studied since they participate in numerous physiological processes. The complexity of PhyCys at genomic and structural levels, with multiple members and specific expression patterns and affinity to CysProt, indicates a great diversity of functions [1,2,3,4]. PhyCys act as endogenous regulators of protein turnover in many physiological processes, such as plant growth and development, ripening, accumulation and mobilization of storage proteins, and programmed cell death, [2, 5,6,7]. PhyCys are also involved in plant reactions to abiotic stresses like drought or darkness [5, 8,9,10,11,12,13, 14] and senescence processes [15]. They have been shown to be up-regulated under water deprivation [16,17,18,19], but conversely a reduction in their expression has been also documented after drought stress [14, 20]. Enhanced drought tolerance in transgenic Arabidopsis thaliana, Glycine max and Malus domestica plants has been reported owing to the over-expression of PhyCys [21, 22]. PhyCys respond to other abiotic stresses like extreme variation of temperature and their over-expression make the plant more tolerant [23, 24]. Likewise, the over-expression of two cystatins, AtCYSa and AtCYSb, increased the resistance to a combination of abiotic stresses like drought, salt stress, cold and oxidative stress in Arabidopsis [9].
PhyCys superfamily is one of the most studied inducible defenses of the plant, and PhyCys has been used as effective molecules against different pests and pathogens [25,26,27,28,29,30,31]. Recombinant PhyCys have been shown to inhibit the activity of digestive proteases from many herbivores, affecting their development and reproduction when pests feed in artificial diets containing the recombinant PhyCys or in transgenic plants overexpressing a PhyCys gene [3, 4]. Likewise, several publications reported the induction of PhyCys in plants mediated by fungal infection [32, 33]. Recombinant PhyCys have been able to affect the in vitro growth of some phytopathogenic fungi [34, 35]. Transgenic approaches have also contributed to understand how plants over-expressing or silencing PhyCys genes respond to attacks by pathogens. Maize plants silencing the cystatin-9 gene had a reduced infection by Ustilago maydis, indicating that this PhyCys suppresses host immunity by inhibition of apoplastic cysteine proteases [32]. Conversely, tomato plants overexpressing the cystatin TaMDC1 showed high levels of resistance against Alternaria alternata and elevated tolerance against Botrytis cinerea [36]. Although the mechanism by which PhyCys inhibit fungal growth has not been yet elucidated, it has been suggested to be related to inhibition of fungal cysteine proteases [37,38,39] but it could also implicate changes in the permeability of fungal membrane [40]. In addition, PhyCys may act as stabilizing fusion partners for recombinant protein production in plants [41,42,43].
Barley (Hordeum vulgare L.) represents a good model to study the implication of cystatins in responses to biotic and abiotic stresses, given the comprehensive knowledge of its CysProt and PhyCys families. In previous works, thirteen cystatins (HvCPI-1 to HvCPI-13) have been identified and characterized [1, 2]. They have a role in response to abiotic stresses, in defense to biotic stresses and also participate in endogenous plant processes. Their function of defense against pests has been determined by their competence to inhibit the activity of insects and acari digestive proteases, using non-natural diets or plants stably transformed with barley PhyCys genes [4, 28,29,30, 44]. Three cystatins from barley (HvCPI-1, HvCPI-2 and HvCPI-6) and the mutated variant HvCPI-1 C68 → G have been transgenically expressed in barley, Arabidopsis, potato, tomato and maize to determine how they affect insect and mite performance [28, 29, 45, 46]. However, lesser is known about the in vivo barley PhyCys effects on pathogens. HvCPI-6 from barley inhibited the in vitro growth of some phytopathogenic fungi, including Magnaporthe oryzae, but Arabidopsis plants over-expressing this PhyCys showed no differences in fungal and bacteria resistance levels in comparison to non-transformed plants [47]. On the other hand, the participation of barley cystatin family members in abiotic stresses responses has been associated to a specific role modulating the degradative activity of endogenous proteases [12, 48]. The expression of barley PhyCys HvCPI-3-6 and 8–9 was induced by darkness [12], and HvCPI-2 together to HvCPI-4 showed the highest level of expression after water deprivation in barley leaves [48].
HvCPI-2 has been shown to have a relevant role in plant responses to biotic stresses, since earlier work performed by our group showed in vitro inhibition of the fungal growth of some phytopathogenic fungi like M. oryzae [47] as well as in vitro inhibitory activity of the cathepsin L- and B-like activities of several phytophagous arthropods [4]. In addition, recent work reported that tomato plants overexpressing this cystatin affect the performance of the lepidopteran Tuta absoluta [45]. HvIcy-2 gene has been also analyzed under abiotic stresses like darkness and drought. While HvIcy-2 gene is notably up-regulated under drought conditions [48] no differences were observed after light deprivation treatments [12]. An enhanced tolerance to drought at initial growing stages, together to a stay-green phenotype at the final stages of the plant life cycle was also observed in silenced HvCPI-2 lines [48]. To further explore the multiple roles of this barley PhyCys in response to both, biotic and abiotic stresses, and its effects on the cysteine proteinase-proteinase inhibitor system, we have analyzed in the current work phenotypical and molecular responses of HvIcy-2 silencing lines to a fungal stress or to a light deprivation treatment.
Results
Expression of HvIcy-2 is modified in barley leaves during the response to elicitors and M. oryzae treatments
The in vitro inhibition of the fungal growth of some phytopathogenic fungus like M. oryzae points to a relevant role for HvCPI-2 in plant responses to pathogens, [47]. To check if the expression of HvIcy-2 was up-regulated upon biotic stresses, elicitors known to activate plant defense mechanisms against bacterial and fungal were selected [49]. For bacterial response treatments, the elicitor flg22, a sequence of 22-amino acid of the conserved N-terminal portion of bacterial flagellin, was tested. For fungal response, the effect of the elicitor chitosan, a cell wall of fungi structural element, was also tried. Using mRNA quantification, the expression patterns of HvIcy-2 in response to elicitor treatments was analyzed and a molecular characterization was performed (Fig. 1a). These results revealed that the HvIcy-2 gene was significantly induced in treated leaf samples after 24 h of flg22 and chitosan treatments (Fig. 1a). Data were expressed as mRNA levels normalized to the cyclophilin gene constitutively active in barley.
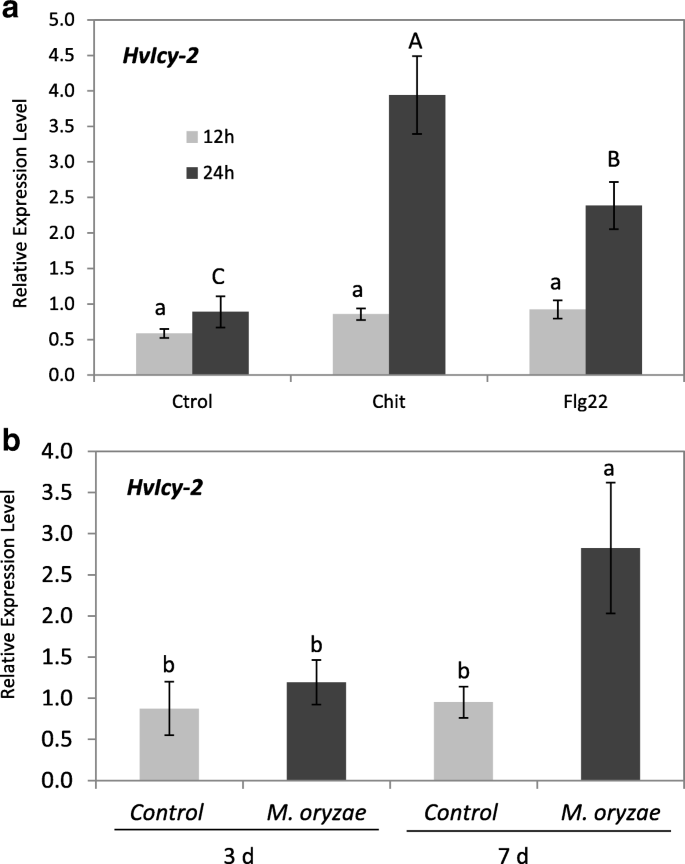
mRNA expression levels of barley HvIcy-2 gene (a) after 12 (light grey) and 24 h (dark grey) of elicitor treatments in leaves with chitosan (Chit), flagellin (Flg22), and controls (Ctrol), and (b) barley wild type plants after M. oryzae infection at three (3 d) or seven (7 d) days after treatment from leaves of infected (dark grey) or non-infected (light grey) plants. Data were determined by RT-qPCR and expressed as relative mRNA levels of HvIcy-2 gene normalized to barley cyclophilin mRNA content. Data are means ± standard error of at least three independent analyses. Different letters indicate significant differences (P < 0.05, One-Way ANOVA Student Newman-Keuls test)
Both elicitors induced the expression of HvIcy-2 gene, and the highest levels were observed after chitosan treatment, therefore, the next approach was to evaluate the effects of a fungal pathogen, M. oryzae, in treated barley leaves. Results showed no differences at 3 dpi but after 7 dpi of M. oryzae infection the HvIcy-2 gene was significantly up-regulated (Fig. 1b).
Expression of barley HvIcy-2 gene performs different under M. oryzae or darkness stresses in silencing KD Icy2 lines
Homozygous barley plants silencing the HvIcy-2 gene (KD Icy 1318, 1322, 1390 and 1399 lines) have been used to carry out in vivo experiments to test the response of modified plants towards drought [50]. To know how the expression of HvIcy-2 varies in response to different abiotic or biotic stresses, the same KD Icy2 lines were used to measure the messenger HvIcy-2 levels upon M. oryzae or darkness treatments.
In Fig. 2a it can be observed a clear induction of the HvIcy-2 gene after M. oryzae infection in HvIcy-2 silencing barley lines, as well as wild type plants, when compared with control conditions. However, after light deprivation, the HvIcy-2 gene in the transgenic lines rather than increase is down-regulated comparing to control conditions and comparing to WT, where no significant differences were observed (Fig. 2b).
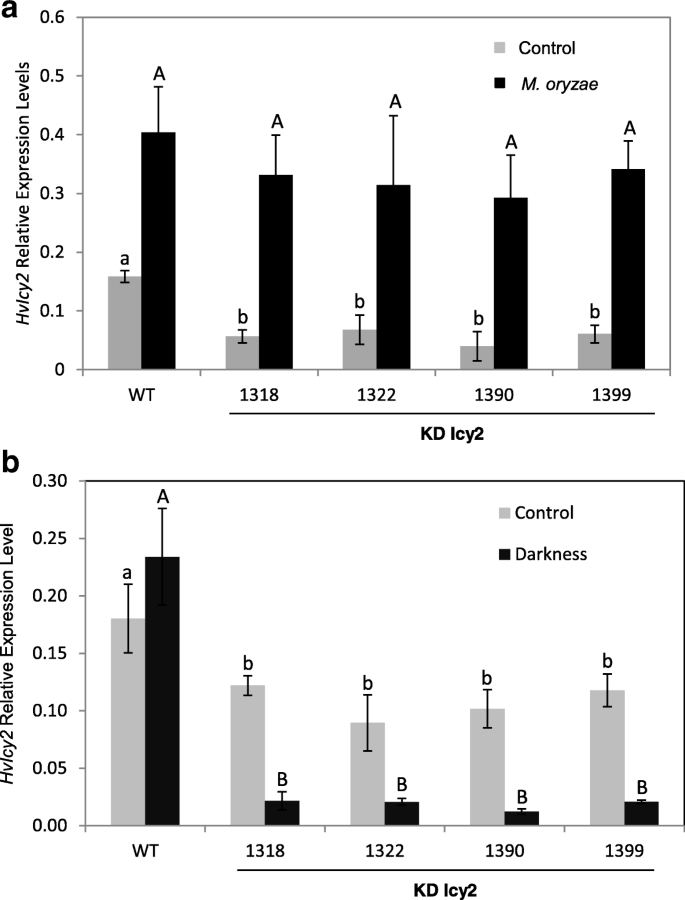
mRNA expression levels of barley HvIcy-2 gene in transgenic HvIcy2 silencing (KD Icy2, 1318, 1322, 1390 and 1399) lines, and wild type (WT) barley plants during darkness treatments (a) and M. oryzae infection (b), assayed by RT-qPCR. Total RNA was extracted from leaves after 14 days of darkness or 7 days of infection (dark grey) and non-treated/infected leaves (light grey). Data were expressed as mRNA levels of HvIcy2 gene normalized to barley cyclophilin mRNA content. Data are means ± standard error of at least three independent analyses. Different letters indicate significant differences between lines. (P < 0.01, one-way ANOVA followed by Student Newman-Keuls test)
Transgenic barley HvIcy-2 silencing lines show phenotypical differences after M. oryzae infection
HvIcy-2 seems to have a role in plant responses to M. oryzae as it was up-regulated after infection treatments. Consequently, KD Icy2 barley plants were used to test the resistance or vulnerability of modified plants towards the attack of this fungus carrying out in vivo experiments. Comparing the behavior of wild type and transgenic plants after fungus infection, the participation of the HvIcy-2 gene in the response to M. oryzae was analyzed (Fig. 3a-b). Further damage was observed in leaves from infected plants than those grown under control conditions, as was expected (Fig. 3b). Moreover, leaves from KD Icy2 lines, after 3 d of infection, showed higher damage than wild type (WT) barley plants (Fig. 3b). Subsequently, after 7 d of M. oryzae attack was more evident the highest vulnerability of KD Icy2 plants (Fig. 3b). Whole plant images highlight the reduced symptoms of damage in WT plants, which looked fewer susceptible to the fungus than KD Icy2 plants (Fig. 3a). In Fig. 4a the injured leaf area after infection was quantified in WT and transgenic infected lines, in order to compare the total damaged area. These results supported the previous observations. The WT plants, particularly at 7 days of M. oryzae infection, presented significantly lesser injured foliar area than KD Icy2 plants.

Images of the whole barley plant (a) and the oldest leaf (b) of transgenic HvIcy2 silencing (KD Icy2, 1318 and 1399) and wild type (WT) barley lines after 3 days and 7 days of M. oryzae infection or non-infection as control
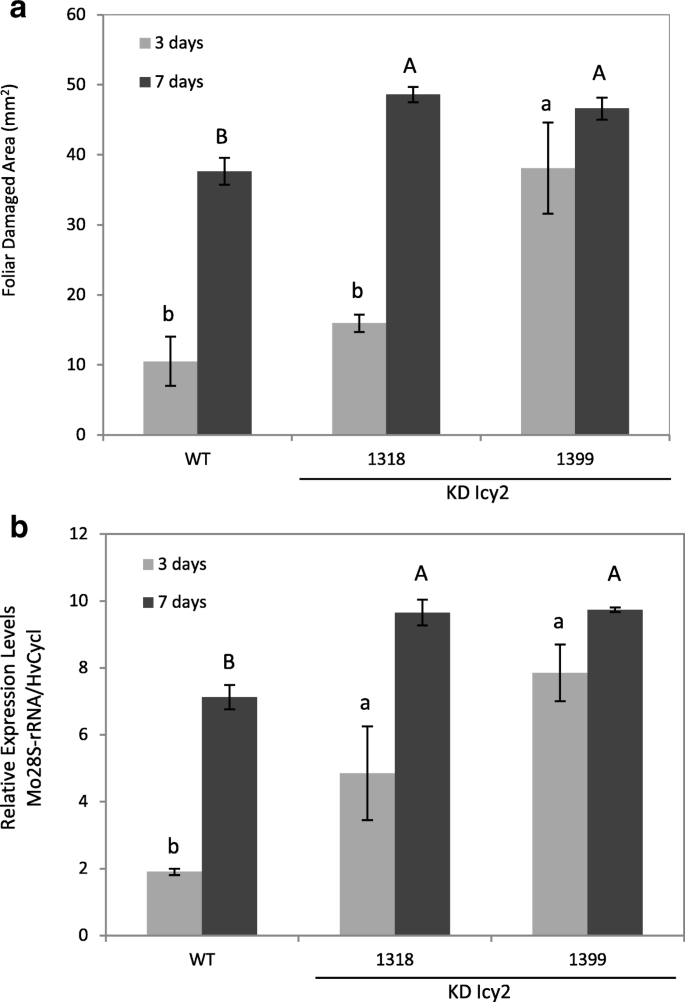
Quantification of leaf damage on barley transformed (KD Icy2 1318 and 1399) and non-transformed (WT) plants, after 3 (light grey) and 7 (dark grey) days of M. oryzae infection (a). Damage was measured as mm2 of injured foliar area and is represented as mean ± SE of seven old leaves measurements from seven independent plants per treatment. Effect of transgenic barley lines silencing the HvIcy2 gene (KD Icy2 1318 and 1399) and wild type (WT) plants on M. oryzae performance (b). Quantification of M. oryzae small subunit of ribosomal RNA (Mo28S-rRNA) mRNA expression levels, at 3 (light grey) and 7 (dark grey) days after M. oryzae infection. Total RNA was extracted after infestation and data were expressed as mRNA levels normalized to barley cyclophilin mRNA content. Different letters indicate significant differences (P < 0.01, one-way ANOVA Student Newman-Keuls test)
The existence of M. oryzae was registered by the measurement of the mRNA levels of the fungus small subunit of ribosomal RNA (Mo28S-rRNA), in order to analyze the effect of the modified barley plants on the fungus behavior (Fig. 4b). It was observed that at 3 and 7 days of infection a significantly greater amount of fungus mRNA was detected in KD Icy2 barley lines, which confirmed that these plants remained more vulnerable to M. oryzae than WT plants.
Transgenic barley HvIcy-2 silencing lines show small biochemical differences after light deprivation
Once corroborated the role of HvIcy-2 in the response to a biotic stress, we decided to further analyze the consequences of HvIcy-2 repression after darkness treatment. After 14 days of darkness treatment, no phenotypical differences were observed in KD Icy2 silencing barley lines compared to WT (Fig. 5a). The chlorophyll content of the oldest leaf was observed by detecting its autofluorescence under a confocal microscope (Fig. 5b). The highest chlorophyll fluorescence was found in the medium segment of the leaf in both, transgenic and WT plants, in control conditions. A similar fluorescence emission was detected in apex and medium in KD Icy2 lines when compared to WT in darkness conditions. Comparable patterns were also found in leaf tissues structures observed under bright field grown under control or darkness treatments (Fig. 5b). Photosynthetic pigments were also analyzed in entire aerial biomass of the plants after 14 days of darkness vs control conditions. However, significant differences were not detected between transgenic and WT samples (Fig. 6a and b). The chlorophyll content of KD Icy2 plants was similar in comparison to WT, and a reduction in the total amount of chlorophyll was observed in all light deprived-stressed plants (Fig. 6a). This result supports chlorophyll auto-fluorescence observations (Fig. 5b). For the quantification of carotenoids, similar results were found in all lines (Fig. 6b). The starch and protein contents of the leaves were also quantified (Fig. 6c and d). As expected, starch accumulation was strongly reduced in all 14 days darkness-treated leaves. Although KD Icy2 transgenic leaves grown under photoperiod had significantly lower starch than WT leaves, no remarkable differences were detected between transgenic and WT samples under darkness conditions (Fig. 6c). Differing, no significant differences in protein content were found in KD Icy2 lines and nontransgenic lines when grown under photoperiod or light deprivation conditions (Fig. 6d). Finally, using specific substrates, the cathepsin L- and B-like proteolytic activities of KD Icy2 and WT plants grown in the darkness or under control conditions were determined. When plants were grown under light conditions, no significant differences on the cathepsin L-like activity were detected between transgenic and WT lines (Fig. 6e). Curiously, under darkness conditions the cathepsin L-like activity was significantly lower in KD Icy2 lines compared to WT plants (Fig. 6e). Comparable data resulted from the analysis of cathepsin B-like activity, which was significantly lower after light deprivation in KD Icy2 than in WT plants (Fig. 6f).

Phenotypes of WT and HvIcy2 silencing (KD Icy2: 1318 and 1399 lines) barley plants grown in soil under continuous darkness or 16 h/8 h light/dark photoperiod for 14 days (a). Chlorophyll detection in the oldest leaf of transgenic and WT barley lines grown under darkness or 16 h/8 h photoperiod for 14 days (b). Leaf fragments from HvIcy2 silencing (KD Icy2: 1318 line) and WT plants were collected and observed under a Leica SP8 confocal microscope using the laser excitation lines 633 nm to detect the red autofluorescence from the chlorophyll (UV). The same images were taken under light field conditions (light) and the fluorescence signal overlap is documented (merged). Leaves were cut in two fragments, corresponding to apical and medium-basal section of the leaf, respectively. Scale bar, 200 μm
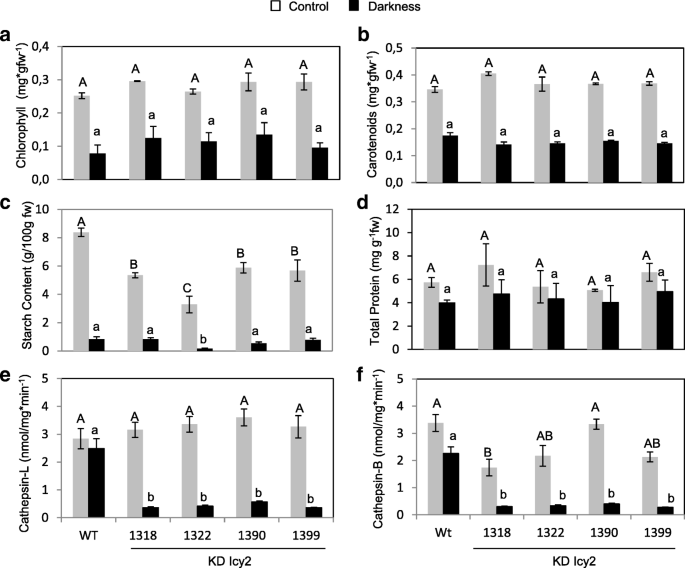
Photosynthetic pigments, chlorophyll (a) and carotenoids (b), content referred in mg of pigment per gram of initial fresh weight. Starch content (c) measured as grams of transformed starch per 100 g of fresh weight. Total protein content (d) referred in mg of total soluble protein per gram of initial fresh weight. Proteolytic activities with specific substrates to be degraded by cathepsin L/F-like (e) and B-like (f). HvIcy2 silencing (KD Icy2: 1318, 1322, 1390, 1399 lines) and wild type (WT) barley plants were grown in soil under continuous darkness or 16 h/8 h photoperiod for 14 days. Data are means ± standard error of at least three independent analyses. Different letters indicate significant differences between lines. (P < 0.05, one-way ANOVA followed by Student Newman-Keuls test)
Response to different stresses show molecular alterations with striking compensation effects at the transcriptional level
Variations in the transcript content of PhyCys may have an effect on the expression of their protease targets [48, 50]. Thus, the expression patterns for several CysProt belonging to different C1A subgroups (F-, L-, H-, and B-like cathepsins) were analysed by RT-qPCR under M. oryzae attack or light deprivation treatments (Fig. 7). Transcripts of HvPap-1 CysProt gene increased in stressed plants independently of the treatment, M. oryzae infection or darkness, with HvPap-1 levels being higher in WT than KD Icy2 after M. oryzae treatment (Fig. 7). Similarly, HvPap-19, HvPap-12 and HvPap-6 CysProt genes increase after M. oryzae infection in both, wild type and KD Icy2 plants (Fig. 7a). However, after light deprivation treatments, HvPap-19 and HvPap-12 genes were up-regulated in wild type and down-regulated in KD Icy2 when compared to control conditions and the expression of HvPap-6 gene did no change after light deprivation treatment in any line (Fig. 7a and b). HvPap-16 showed a similar pattern of expression after both stress treatments, being greater down-regulated after darkness in KD Icy2 lines than in wild type (Fig. 7b). Based on these results, the variability in plant responses against different stress treatments may underlie the specificity of CysProt genes involved in the response as well as compensation effects on proteolytic-related proteins at the transcriptional level caused by the alteration in the expression of a PhyCys.
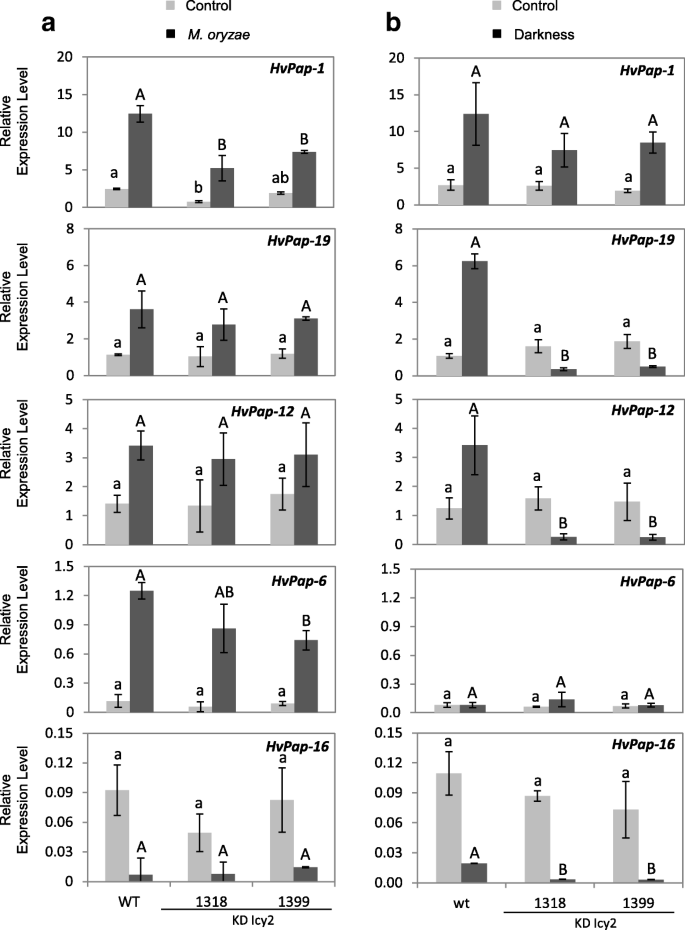
Messenger expression levels of C1A CysProt genes (HvPap-1, − 19, − 12, − 6 and − 16) in transgenic HvIcy2 silencing (KD Icy2, 1318 and 1399) lines, and wild type (WT) barley plants assayed by RT-qPCR. (a) Total RNA was extracted from leaves after 7 days of M. oryzae infection (dark grey) and non-infected leaves (light grey). (b) Total RNA was extracted from leaves of WT and KD Icy2 barley plants grown in soil under continuous darkness (dark grey) or with 16 h/8 h photoperiod (light grey) for 14 days. Data were expressed as mRNA levels of C1A CysProt genes normalized to barley cyclophilin mRNA content. Data are means ± standard error of at least three independent analyses. Different letters indicate significant differences between lines. (P < 0.05, one-way ANOVA followed by Student Newman-Keuls test)
Discussion
The participation of cystatin family members in biotic and abiotic stresses responses has been widely described [3]. Their participation is addressed to a precise regulation in which protease inhibitors have a specific role modulating the degradative activity of endogenous proteases as well as pest or pathogen proteases. However, the relevance of the role of an individual cystatin on several stresses has not been conveniently addressed. Based in previous results suggesting its participation in the response to biotic and abiotic stresses, the barley HvCPI-2 cystatin was selected to further explore the functional role of a cystatin against multiple threats [51]. Earlier work performed by our group showed in vitro inhibitory activity of HvCPI-2 on the cathepsin L- and B-like activities of several phytophagous arthropods [4], as well as in vitro inhibition of the fungal growth of some phytopathogenic fungus like M. oryzae [47]. The induction of PhyCys in plants mediated by fungal infection has been reported [33, 52], and recombinant PhyCys have been able to affect the growth of some phytopathogenic fungi in vitro [35, 40], highlighting the importance of PhyCys in response to pathogens. Likewise, transcriptional induction of HvIcy-2 after elicitor and M. oryzae treatments further support a protective role of HvCPI-2 against pathogen attack. According to this, transgenic barley HvIcy-2 silencing lines remained more susceptible to the fungus attack than the wild type lines. Although HvIcy-2 expression was not significantly different in transgenic lines after fungus treatment when compared to wild type, we still found some increase of foliage area damage in silenced fungus-infected plants. This may be due to that the decreased expression of HvIcy-2 gene in transgenic lines previous to the infection is enough to lesser protect the plant of the fungus attack. In other words, the lower level of HvIcy-2 gene in transgenic lines is responsible of the higher susceptibility of these plants to the fungus attack. Even though the plant tries to overexpress this gene after the attack, it is not enough in time and quantity to be protected at the same level of wild type plants. Therefore, we suggest that HvIcy-2 may have a role in fungal protection. Our results are in accordance with those from [36] that showed high levels of resistance against A. alternata and elevated tolerance against B. cinerea in tomato plants overexpressing the cystatin TaMDC1. On the contrary, [52] using transgenic plants silencing the cystatin-9 gene observed a reduced infection by U. maydis, but they argued that this PhyCys suppresses host immunity by inhibition of apoplastic cysteine proteases. Apart from this specific PhyCys-CysProt interaction, little is known on the physiological mechanism involved in the alteration of plant resistance/susceptibility when the expression of a cystatin is genetically modified. Two hypotheses should be taking into account. The first one is a direct toxic effect of the cystatin on the pathogen. The mechanism by which PhyCys inhibit fungi growth has not been yet elucidated. Several authors pointed out a direct inhibition of fungal cysteine proteases. The inhibitory activity of fungal growth exerted by recombinant cystatins from taro and amaranth was correlated with a partial inhibition of the cysteine protease activities of the fungal mycelium [37,38,39]. In contrast, other studies have indicated that variants of cystatins from barley and sesame lacking cysteine protease inhibitory activity had comparable ability to inhibit mycelial growth or spore germination of several phytopathogenic fungi. This suggests an alternative mechanism of action that could be associated to changes in the permeability of the fungal membrane [40, 53]. The second hypothesis is supported by the observed transcriptional reprogramming triggered by a genetic modification. Barley plants over-expressing the HvIcy-6 gene had a down-regulation in the expression of photosynthetic related genes suggesting a primed state for a faster defense response [46]. Besides, tomato plants over-expressing HvIcy-2 showed a higher expression of a tomato wound-induced serine protease inhibitor (PIN2) [45]. In any case, further research needs to be done to understand how plants over-expressing or silencing PhyCys genes respond to attacks by pathogens. HvIcy-2 gene has been also analyzed under abiotic stresses. While HvIcy-2 gene is notably up-regulated under drought conditions [48] no differences were observed after light deprivation treatments [12]. However, an unresponsive expression pattern does not mean absence of physiological role. To elucidate if HvCPI-2 activity affects darkness response, silencing HvIcy-2 plants are a key tool. Interestingly, the expression of HvIcy-2 decreased in silencing lines after dark treatment, but this lower HvIcy-2 expression was accompanied to a decrease in cathepsin activities. Besides, these changes were not translated to biochemical or phenotypical differences. This striking behavior may be due to a transcriptional reprogramming of PhyCys expression to compensate HvIcy-2 silencing. Most of the responses to abiotic stresses are a consequence of the direct inhibition of plant protease targets [13], and different PhyCys may participate in this inhibition. For instance, the expression of barley PhyCys HvIcy-3-6 and 8–9 was induced by darkness [12] and HvIcy-2 together to HvIcy-4 showed the highest level of expression after water deprivation in barley leaves [48]. Mutual compensating expression of HvIcy-2 and HvIcy-4 genes in silencing lines after water deprivation supports a cooperative role of these two cystatins [48]. Likewise, transcriptional changes in PhyCys expression may be accompanied to transcriptional variations in the expression of their CysProt targets. In fact, an opposite effect of darkness on the transcript levels of HvPap-12 and -19 between control and silenced lines was found. This effect could partially explain the lower cathepsin activity showed by silencing HvIcy-2 lines after darkness treatment and supports that responses to different stresses are accompanied to molecular alterations with striking compensation effects at the transcriptional level.
Conclusions
In this study, it has been shown how transgenic barley HvIcy-2 silencing lines perform different under biotic or abiotic stresses. Results highlight the specificity of PhyCys in the responses to diverse external prompts as well as the complexity of the regulatory events leading to the response to a particular stress. HvIcy-2 silencing lines not only behave differentially against biotic or abiotic stresses, but also against two abiotic stresses like drought and light deprivation. The mechanism of regulation of these stress responses seems to be focused in maintaining the balance of CysProt and cystatins accumulation levels, which is crucial for the regulation of the physiological processes induced by biotic or abiotic stresses. Thus, HvCPI-2 may be participating directly on the stress, which would explain the highest susceptibility of KD Icy2 barley plants to the fungal attack, or a transcriptional reprogramming of the expression of different PhyCys and CysProt may be occurring to compensate HvIcy-2 silencing, which would explain the low cysteine protease activity showed by silencing HvIcy-2 lines after darkness treatment. Further research needs to be done to decipher the putative in vivo roles of cystatins and CysProt, and to deepen on the existing knowledge about the proteolytic events underlying responses to different stresses.
Methods
Plant material and growth conditions
Source of Plants: Barley plants of H. vulgare cv. Golden Promise were used. Barley transgenic lines silencing the HvIcy-2 gene (KD Icy2) were generated as described in [50]. Grains of wild type and transgenic barley were germinated in soil and grown as described in [50], and the homozygous transgenic barley lines for the inserted constructions were correspondingly validated.
The plant specimens were taking from seeds of barley plants of Hordeum vulgare spring type cv. Golden Promise provided by the IPK Gatersleben, Plant Reproductive Biology Group. Barley transgenic lines silencing the barley Icy-2 gene (KD Icy2) were generated also in collaboration with the IPK Gatersleben, Plant Reproductive Biology Group.
The fungal isolate used in this study for infection assays was the Magnaporthe oryzae wild-type strain Guy11 [54], kindly provided by Dr. Sesma, CBGP-UPM-INIA, Madrid. Plants and fungus used in our study complied with institutional, national, or international guidelines.
Real-time RT-qPCR analysis
Total RNA was extracted from frozen barley leaves by the phenol/chloroform method and digested with DNase as described in [55]. cDNAs were synthesized from 2 μg of RNA using High Reverse Transcription kit (Applied Biosystems) following the manufacturer’s instructions. RT-qPCR analyses were performed using the SYBR Green detection system and expression levels of the M. oryzae small subunit of ribosomal RNA (Mo28S-rRNA) were quantified as described in [49]. Quantification was standardized to barley cyclophilin (HvCycl gene) mRNA levels following [12]. The primers used are shown in Additional file 1: Table S1.
Protein quantification and protease activities
Total protein was extracted from treated and control leaves as described in [56], and quantified according to the method of [57], using the bovine serum albumin as a standard. Protease activities were assayed as described in [56], by measuring the hydrolysis of substrates containing the AMC (7-amino-4-methyl coumarin) fluorophore carried out in microliter plate format.
Photosynthetic pigment measurements and starch quantification
Chlorophyll a and b, and total carotenoids (xanthophylls and carotenes) were extracted from leaves and pigment content was calculated as described in [56]. To detect the red auto-fluorescence from the chlorophyll, the oldest leaf of each transgenic and wild type plant was observed under a Leica SP8 confocal microscope (Leica, Wetzlar, Germany) with 633 nm laser excitation line. Thirty mg of fresh leaves from wild type and transgenic barley lines were used for total starch quantification using the STA20 Kit (Sigma) as described in [56].
Elicitor treatments
The flagellin peptide (flg22) with amino acid sequence QRLSTGSRINSAKDDAAGLQIA (AnaSpec laboratories) and chitosan purified from crab shells (Sigma Aldrich) were used for elicitor treatments as described in [49]. Elicitor solutions were applied over 7 days old wild type barley leaves as a foliar spray and plants were further incubated at the same growth conditions described earlier. Three independent experiments were performed and 3 pots of 3 plants each were used per treatment. Barley leaves were harvested after 12 and 24 h of elicitor treatments, frozen into liquid nitrogen and stored at − 80 °C for further analysis.
M. oryzae infections
Seven days old barley plants of wild type and transgenic lines silencing the HvIcy-2 gene were infected with the fungus M. oryzae as described in [49]. The M. oryzae wild type strain Guy11 kindly provided by Dr. Sesma (CBGP-UPM-INIA, Madrid) was the fungal isolate used. The infection assays were performed as described in [58] by spray inoculations using an airbrush nebulizer compressor in whole plant leaves. Three independent experiments were performed and seven plants were used per treatment. Barley leaves were harvested after 3 and 7 days of fungus treatment, frozen into liquid nitrogen and stored at − 80 °C for further analysis.
Damage quantification assays
M. oryzae damage observed on barley leaves were scanned using a HP Scanjet 5590 Digital Flatbed Scanner and foliar damage was analyzed as described in [49] using the Fiji-ImageJ software [59]. Three independent experiments were performed and seven replicates were analyzed. Data were represented as foliar damaged area (mm2) mean ± SE of seven measurements.
Data analysis
Statistical differences among treatments or lines were analyzed by one-way ANOVA followed by studentized range distribution of Student Newman-Keuls (SNK) multiple comparison test performed using the soft R Project (v.3.1.2) package. At least three biological replicates as well as three technical replicates were performed for all the experiments.
Abbreviations
- AMC:
-
7-amino-4-methyl coumarin
- CysProt:
-
Cysteine proteases
- flg22:
-
Flagellin peptide 22
- PhyCys:
-
Phytocystatins
- RT-qPCR:
-
Real-time quantitative PCR analysis
- SNK:
-
Student Newman-Keuls multiple comparison test
References
Martinez M, Diaz I. The origin and evolution of plant cystatins and their target cysteine proteinases indicate a complex functional relationship. BMC Evol Biol. 2008;8:198. https://doi.org/10.1186/1471-2148-8-198.
Martinez M, Cambra I, Carrillo L, Diaz-Mendoza M, Diaz I. Characterization of the entire cystatin gene family in barley and their target cathepsin L-like cysteine-oroteases, partners in the hordein mobilization during seed germination. Plant Physiol. 2009;151:1531–45. https://doi.org/10.1104/pp.109.146019.
Benchabane M, Schlüter U, Vorster J, Goulet MC, Michaud D. Plant cystatins. Biochimie. 2010;92:1657–66. https://doi.org/10.1016/j.biochi.2010.06.006.
Martinez M, Santamaria ME, Diaz-Mendoza M, Arnaiz A, Carrillo L, Ortego F, Diaz I. Phytocystatins: defense proteins against phytophagous insects and Acari. In: Int J Mol Sci, vol. 17; 2016. https://doi.org/10.3390/ijms17101747.
Neuteboom LW, Matsumoto KO, Christopher DA. An extended AE-rich N-terminal trunk in secreted pineapple cystatin enhances inhibition of fruit bromelain and is posttranslationally removed during ripening. Plant Physiol. 2009;151:515–27.
Weeda AM, Kumar GNM, Knowles NR. Developmentally linked changes in proteases and protease inhibitors suggest a role for potato multicystatin in regulating protein content of potato tubers. Planta. 2009;230:73–84.
Cambra I, Martinez M, Dader B, Gonzalez-Melendi P, Gandullo J, Santamaria ME, Diaz I. A cathepsin F-like peptidase involved in barley grain protein mobilization, HvPap-1, is modulated by its own propeptide and by cystatins. J Exp Bot. 2012;63:4615–29. https://doi.org/10.1093/jxb/ers137.
Prins A, van Heerden PD, Olmos E, Kunert KJ, Foyer CH. Cysteine proteinases regulate chloroplast protein content and composition in tobacco leaves: a model for dynamic interactions with ribulose-1,5-bisphosphate carboxylase/ oxygenase (rubisco) vesicular bodies. J Exp Bot. 2008;59:1935–50.
Zhang X, Liu S, Takano T. Two cysteine proteinase inhibitors from Arabidopsis thaliana, AtCYSa and AtCYSb, increasing the salt, drought, oxidation and cold tolerance. Plant Mol Biol. 2008;68:131–43.
Tajima T, Yamaguchi A, Matsushima S, Satoh M, Hayasaka S, Yoshimatsu K, Shioi Y. Biochemical and molecular characterization of senescence-related cysteine protease-cystatin complex from spinach leaf. Physiol Plant. 2011;141:97–116.
Chen HJ, Tsai YJ, Shen CY, Tsai TN, Huang GJ, Lin YH. Ectopic expression of sweet potato cysteine protease SPCP3 alters phenotypic traits and enhances drought stress sensitivity in transgenic Arabidopsis plants. J Plant Growth Regul. 2013;32:108–21.
Diaz-Mendoza M, Arroyo-Velasco B, Gonzalez-Melendi P, Martinez M, Diaz I. C1A cysteine protease-cystatin interactions in leaf senescence. J Exp Bot. 2014;65:3825–33. https://doi.org/10.1093/jxb/eru043.
Kunert KJ, Van Wyk SG, Cullis CA, Vorster BJ, Foyer CH. Potential use of phytocystatins in crop improvement, with a particular focus on legumes. J Exp Bot. 2015;66:3559–70.
Massonneau A, Condamine P, Wisniewski JP, Zivy M, Rogowsky PM. Maize cystatins respond to developmental cues, cold stress and drought. Biochem Biophys Acta. 2008;1729:186–99.
Kleber-Janke T, Krupinska K. Isolation of cDNA clones for genes showing enhanced expression in barley leaves during dark-induced senescence as well as during senescence under field conditions. Planta. 1997;203:332–40.
Seki M, Narusaka M, Ishida J, Nanjo T, Fujita M, Oono Y, Kamiya A, Nakajima M, Enju A, Sakurai T, Satou M, Akiyama K, Taji T, Yamaguchi-Shinozaki K, Carninci P, Kawai J, Hayashizaki Y, Shinozaki K. Monitoring the expression profiles of 7000 Arabidopsis genes under drought, cold and high-salinity stresses using a full-length cDNA microarray. Plant J. 2002;31:279–92.
Diop NN, Kidric M, Repellin A, Gareil M, d’Arcy-Lameta A, Pham Thi AT, Zuily- Fodil Y. A multicystatin is induced by drought-stress in cowpea (Vigna unguiculata (L.) Walp.) leaves. FEBS Lett. 2004;577:545–50.
Tan Y, Wang S, Liang D, Li M, Ma F. Genome-wide identification and expression profiling of the cystatin gene family in apple (Malus × domestica Borkh.). Plant Physiol Biochem. 2014;79:88–97.
Subburaj S, Zhu D, Li X, Hu Y, Yan Y. Molecular chracterization and expression profiling of Brachypodium distachyon L. cystatin genes reveal high evolutionary conservation and functional divergence in response to abiotic stresses. Front Plant Sci. 2017;8:743.
Vaseva I, Zehirov G, Stoychev V, Kirova E, Simova-Stoilova L, Sabotic J, Sustar-Vozlic VM, Kidric M. Semi-quantitative RT-PCR analysis of selected protease inhibitors in drought-stressed Triticum aestivum. Genet Plant Physiol. 2014;4:57–67.
Quain MD, Makgopa ME, Márquez-García B, Comadira G, Fernandez-Garcia N, Olmos E, Schnaubelt D, Kunert KJ, Foyer C. Ectopic phytocystatin expression leads to enhanced drought stress tolerance in soybean (Glycine max) and Arabidopsis thaliana through effects on strigolactone pathways and can also result in improved seed traits. Plant Biotechnol J. 2014;12:903–13.
Tan Y, Li M, Yang Y, Sun X, Wang N, Liang B, Ma F. Overexpression of MpCYS4, a phytocystatin gene from Malus prunifolia (Willd.) Borkh., enhances stomatal closure to confer drought tolerance in transgenic arabdiopsis and apple. Front Plant Sci. 2017. https://doi.org/10.3389/fpls.2017.00033.
Van der Vyver C, Schneidereit J, Driscoll S, Turner J, Kunert K, Foyer CH. Oryzacystatin I expression in transformed tobacco produces a conditional growth phenotype and enhances chilling tolerance. Plant Biotechnol J. 2003;1:101–12.
Je J, Song C, Hwang JE, Chung WS, Lim CO. DREB2C acts as a transcriptional activator of the thermo tolerance-related phytocystatin 4 (AtCYS4) gene. Transgenic Res. 2014;23:109–23.
Gatehouse JA. Prospects for using proteinase inhibitors to protect transgenic plants against attack by herbivorous insects. Curr Protein Pept Sci. 2011;12:409–16.
Green TR, Ryan CA. Wound-induced proteinase inhibitor in plant leaves: a possible defense mechanism against insects. Science. 1972;175:776–7. https://doi.org/10.1126/science.175.4023.776.
Schlüter U, Benchabane M, Munger A, Kiggundu A, Vorster J, Goulet MC, et al. Recombinant protease inhibitors for herbivore pest control: a multitrophic perspective. J Exp Bot. 2010;61:4169–83. https://doi.org/10.1093/jxb/erq166.
Carrillo L, Martinez M, Alvarez-Alfageme F, Castanera P, Smagghe G, Diaz I, Ortego F. A barley cysteine-proteinase inhibitor reduces the performance of two aphid species in artificial diets and transgenic Arabidopsis plants. Trans Res. 2011a;20:305–19. https://doi.org/10.1007/s11248-010-9417-2.
Carrillo L, Martinez M, Ramessar K, Cambra I, Castanera P, Ortego F, Diaz I. Expression of a barley cystatin gene in maize enhances resistance against phytophagous mites by altering their cysteine-proteases. Plant Cell Rep. 2011b;30:101–12. https://doi.org/10.1007/s00299-010-0948-z.
Santamaria ME, Cambra I, Martinez M, Pozancos C, González-Melendi P, Grbic V, et al. Gene pyramiding of peptidase inhibitors enhances plant resistance to the spider mite Tetranychus urticae. PLoS One. 2012;7:e43011. https://doi.org/10.1371/journal.pone.0043011.
Martinez M, Cambra I, Gonzalez-Melendi P, Santamaria ME, Diaz I. C1A cysteine-proteases and their inhibitors in plants. Physiol Plant. 2012;145:85–94. https://doi.org/10.1111/j.1399-3054.2012.01569.x.
Van der Linde K, Hemetsberger C, Kastner C, Kaschani F, van der Hoorn RA, Kumlehn J, et al. A maize cystatin suppresses host immunity by inhibiting apoplastic cysteine proteases. Plant Cell. 2012a;24:1285–300. https://doi.org/10.1105/tpc.111.093732.
Dutt S, Pandey D, Kumar A. Jasmonate signal induced expression of cystatin genes for providing resistance against Karnal bunt in wheat. Plant Signal Behav. 2011;6(6):821–30.
Martinez M, Abraham Z, Gambardella M, Echaide M, Carbonero P, Diaz I. The strawberry gene Cyf1 encodes a phytocystatins with antifungal activity. J Exp Bot. 2005;56:1821–9.
Lima AM, dos Reis SP, de Souza CR. Phytocystatins and their potential to control plant diseases caused by fungi. Protein Pept Lett. 2015;22:104–11.
Christova PK, Christov NK, Mladenov PV, Imai R. The wheat multidomain cystatin TaMDC1 displays antifungal, antibacterial, and insecticidal activities in planta. Plant Cell Rep. 2018. https://doi.org/10.1007/s00299-018-2279-4.
Wang KM, Kumar S, Cheng YS, Venkatagiri S, Yang AH, Yeh KW. Characterization of inhibitory mechanism and antifungal activity between group-1 and group-2 phytocystatins from taro (Colocasia esculenta). FEBS J. 2008;275:4980–9.
Valdes-Rodriguez S, Guerrero-Rangel A, Melgoza-Villagomez C, Chagolla-Lopez A, Delgado-Vargas F, Martinez-Gallardo N, Sanchez-Hernandez C, Delano-Frier J. Cloning of a cDNA encoding a cystatin from grain amaranth (Amaranthus hypochondriacus) showing a tissue-specific expression that is modified by germination and abiotic stress. Plant Physiol Biochem. 2007;45:790–198.
Yang AH, Yeh KW. Molecular cloning, recombinant gene expression, and antifungal activity of cystatin from taro (Colocasia esculenta cv. Kaosiung no.1). Planta. 2005;221:493–501.
Martinez M, Lopez-Solanilla E, Rodriguez-Palenzuela P, Carbonero P, Diaz I. Inhibition of plant-pathogenic fungi by the barley cystatin Hv-CPI (gene Icy) is not associated with its cysteine-proteinase inhibitory properties. Mol Plant-Microbe Interact. 2003;16:876–83.
Sainsbury F, Varennes-Jutras P, Goulet MC, D'Aoust MA, Michaud D. Tomato cystatin SlCYS8 as a stabilizing fusion partner for human serpin expression in plants. Plant Biotechnol J. 2013. https://doi.org/10.1111/pbi.12098.
Grosse-Holz F, Madeira L, Zahid MA, Songer M, Kourelis J, Fesenko M, Ninck S, Kaschani F, Kaiser M, van der Hoorn RAL. Three unrelated protease inhibitors enhance accumulation of pharmaceutical recombinant proteins in Nicotiana benthamiana. Plant Biotechnol J. 2018. https://doi.org/10.1111/pbi.12916.
Santos RB, Chandrasekar B, Mandal MK, Kaschani F, Kaiser M, Both L, van der Hoorn RAL, Schiermeyer A, Abranches R. Low protease content in Medicago truncatula cell cultures facilitates recombinant protein production. Biotechnol J. 2018. https://doi.org/10.1002/biot.201800050.
Alvarez-Alfageme F, Martinez M, Pascual-Ruiz S, Castanera P, Diaz I, Ortego F. Effects of potato plants expressing a barley cystatin on the predatory bug Podisus maculiventris via herbivorous prey feeding on the plant. Trans Res. 2007;16:1–13. https://doi.org/10.1007/s11248-006-9022-6.
Hamza R, Pérez-Hedo M, Urbaneja A, Rambla JL, Granell A, Gaddour K, Beltrán JP, Cañas LA. Expression of two barley proteinase inhibitors in tomato promotes endogenous defensive response and enhances resistance to Tuta absoluta. BMC Plant Biol. 2018;18:24. https://doi.org/10.1186/s12870-018-1240-6.
Santamaria ME, Diaz-Mendoza M, Perez-Herguedas D, Hensel G, Kumlehn J, Diaz I, Martinez M. Overexpression of HvIcy6 in barley enhances resistance against Tetranychus urticae and entails partial transcriptomic reprogramming. Int J Mol Sci. 2018. https://doi.org/10.3390/ijms19030697.
Carrillo L, Herrero I, Cambra I, Sánchez-Monge R, Diaz I, Martinez M. Differential in vitro and in vivo effect of barley cysteine and serine protease inhibitors on phytopathogenic microorganisms. Plant Physiol Biochem. 2011c;49:1191–200. https://doi.org/10.1016/j.plaphy.2011.03.012.
Velasco-Arroyo B, Diaz-Mendoza M, Gomez-Sanchez A, Moreno-Garcia B, Santamaria ME, Torija-Bonilla M, Hensel G, Kumlehn J, Martinez M, Diaz I. Silencing barley cystatins HvCPI-2 and HvCPI-4 specifically modifies leaf responses to drought stress. Plant Cell Environ. 2018. https://doi.org/10.1111/pce.13178.
Diaz-Mendoza M, Velasco-Arroyo B, Santamaria ME, Diaz I, Martinez M. HvPap-1 C1A protease participates differentially in the barley response to a pathogen and an herbivore. Front Plant Sci. 2017;8:1585. https://doi.org/10.3389/fpls.2017.01585.
Diaz-Mendoza M, Dominguez-Figueroa J, Velasco-Arroyo B, Cambra I, Gonzalez-Melendi P, Lopez-Gonzalvez A, et al. HvPap-1 C1A protease and HvCPI-2 cystatin contribute to barley grain filling and germination. Plant Physiol. 2016;170:2511–24. https://doi.org/10.1104/pp.15.01944.
Velasco-Arroyo B, Diaz-Mendoza M, Santamaria ME, Gonzalez-Melendi P, Gomez-Sanchez A, Arnaiz A, Martinez M, Diaz I. Senescence-associated genes in response to abiotic/biotic stresses. Prog Bot. 2017. https://doi.org/10.1007/124_2017_1.
Van der Linde K, Mueller AN, Hemetsberger C, Kashani F, van der Hoorn RA, Doehlemann G. The maize cystatin CC9 interacts with apoplastic cysteine proteases. Plant Signal Behav. 2012b;7:1397–401. https://doi.org/10.4161/psb.21902.
Cheng ML, Tzen JTC, Shyu DJH, Chou WM. Functional characterization of the N-terminal and C-terminal domains of a sesame group II phytocystatin. Bot Stud. 2014;55:18. https://doi.org/10.1186/1999-3110-55-18.
Leung H, Borromeo ES, Bernardo MA, Notteghem JL. Genetic analysis of virulence in the rice blast fungus magnaporthe grisea. Phytopathology. 1988;78, 1227–33.
Oñate-Sánchez L, Vicente-Carbajosa J. DNA-free RNA isolation protocols for Arabidopsis thaliana, including seeds and siliques. BMC Res Notes. 2008;1:93. https://doi.org/10.1186/1756-0500-1-93.
Velasco-Arroyo B, Diaz-Mendoza M, Gandullo J, Gonzalez-Melendi P, Santamaria ME, Dominguez-Figueroa JD, et al. HvPap-1 C1A protease actively participates in barley proteolysis mediated by abiotic stresses. J Exp Bot. 2016;(14):4297–310. https://doi.org/10.1093/jxb/erw212.
Bradford MM. A rapid and sensitive method for the quantification of microgram quantities of protein utilizing the principle of protein-dye binding. Anal Biochem. 1976;72:248–54.
Sesma A, Osbourn AE. The rice leaf blast pathogen undergoes developmental processes typical of root-infecting fungi. Nature. 2004;431:582–6. https://doi.org/10.1038/nature02880.
Schindelin J, Arganda-Carreras I, Frise E, Kaynig V, Longair M, Pietzsch T, et al. Fiji: an open source platform for biological-image analysis. Nat Methods. 2012;9:676–82. https://doi.org/10.1038/nmeth.2019.
Acknowledgements
We acknowledge Dr. Ane Sesma and Dr. Julio Rodriguez-Romero from the CBGP-UPM-INIA for their kind advices on the M. oryzae handling.
Funding
This work was supported by projects from the Ministerio de Economia y Competitividad of Spain (project BIO2014–53508-R). The funding body has no role in the design of the study, the collection, analysis, and interpretation of data and in writing the manuscript.
Availability of data and materials
Most of the data pertaining to the present study has been included in the tables/figures of the manuscript. The authors are pleased to share the rest of the raw data upon request.
Author information
Authors and Affiliations
Contributions
ID, MM and MDM conceived the research. BVA and MDM performed the experimental research. All authors contributed to final version of the manuscript. All authors read and approved the final manuscript.
Corresponding author
Ethics declarations
Ethics approval and consent to participate
The plant specimens were taking from seeds of barley plants of Hordeum vulgare spring type cv. Golden Promise provided by the IPK Gatersleben, Plant Reproductive Biology Group. Barley transgenic lines silencing the barley Icy-2 gene (KD Icy2) were generated also in collaboration with the IPK Gatersleben, Plant Reproductive Biology Group.
The fungal isolate used in this study for infection assays was the Magnaporthe oryzae wild-type strain Guy11 [54], kindly provided by Dr. Sesma, CBGP-UPM-INIA, Madrid. Plants and fungus used in our study complied with institutional, national, or international guidelines.
Consent for publication
Not applicable.
Competing interests
The authors declare that they have no competing interests.
Publisher’s Note
Springer Nature remains neutral with regard to jurisdictional claims in published maps and institutional affiliations.
Additional file
Additional file 1:
Table S1. List of primers. (DOCX 17 kb)
Rights and permissions
Open Access This article is distributed under the terms of the Creative Commons Attribution 4.0 International License (http://creativecommons.org/licenses/by/4.0/), which permits unrestricted use, distribution, and reproduction in any medium, provided you give appropriate credit to the original author(s) and the source, provide a link to the Creative Commons license, and indicate if changes were made. The Creative Commons Public Domain Dedication waiver (http://creativecommons.org/publicdomain/zero/1.0/) applies to the data made available in this article, unless otherwise stated.
About this article

Cite this article
Velasco-Arroyo, B., Martinez, M., Diaz, I. et al. Differential response of silencing HvIcy2 barley plants against Magnaporthe oryzae infection and light deprivation. BMC Plant Biol 18, 337 (2018). https://doi.org/10.1186/s12870-018-1560-6
Received:
Accepted:
Published:
DOI: https://doi.org/10.1186/s12870-018-1560-6