
Abstract
Purpose
Travel time predictions are of importance for individual trip planning as well as for logistics applications. Since travel time and travel speed have a one-one correspondence, the modeller has the choice to model travel times directly or model the corresponding travel speeds and infer the associated time from the speed predictions. A priori it is not clear which of these is the superior approach. In this paper we investigate the implications of the choice of the methodology for the accuracy of the travel time predictions.
Methods
For a selection of links, travel time prediction models, both in a direct way as well as indirectly via the implied link travel speeds, are obtained. The respective predictions are compared on a validation data set with respect to their accuracy as measured by mean error, root mean square error, mean percentage error as well as mean absolute percentage error. Additionally, the accuracy of route travel time predictions is evaluated based on the raw GPS data from the floating taxis.
Results
The empirical results overwhelmingly make the case for using direct modelling if the goal of prediction is to obtain a RMSE-optimal prediction. If the MAPE is to be minimized, however, the indirect method provides the better results.
Conclusion
Thus the goal of the prediction determines the better method of modelling: if one is interested in minimizing the RMSE, then, for the data investigated in this paper, the direct method should be selected. However, if one is interested in obtaining a small MAPE, the indirect method achieves better results.
1 Introduction
Travel time predictions are increasingly important both, for commercial traffic (in order to minimize costs due to suboptimal planning) and individual traffic (in order to reduce congestion levels and minimize the risk of incurring penalties due to being unpunctual).
In order to obtain travel time predictions for every trip in an urban network substantial data is required to cover the whole network. This is typically represented as a directed graph containing links (the street segments) and nodes (mostly but not exclusively intersections). Route travel time predictions are usually obtained as the sum of link travel time predictions for all links in the considered route. For an extensive survey of approaches to travel time prediction see for example [14].
Using this approach, link travel times for the whole network are needed which are most often obtained from floating vehicle measurements. Roadside sensors such as radar measurements or loop counter-based measurements only provide instantaneous speeds on a small number of links, and hence do not provide information for the whole network (see for example [3] for a survey). Additionally, point speed measurements carry a number of unwanted drawbacks including the assumption of homogeneity (are the speeds at the sensor representative for the whole link?). A profound discussion of some problems with point speed estimation can be found for example in chapter 3, [10]. Bluetooth sensors [8] provide point-point travel times but only for a very limited set of routes.
Movement within a city is too complex in order to scale travel times for a small number of routes to provide estimates for all possible routes. This leaves floating vehicles as the main source of information for this approach. Early examples in this respect are taxi floating car measurements established as early as 2004 in Vienna [9]. Hereby taxis are equipped with GPS sensors that record the location of the taxi typically with a small sampling rate of approximately one minute due to technical restrictionsFootnote 1. Modern systems based on floating devices (mainly smartphones) provide a much higher temporal frequency of measurement.
Both data sources carry many different error sources: for low frequent taxi floating car data, interpolation between measured points reduces accuracy [5], for high frequent observations of smartphone locations, the transportation mode of the carrier of the smartphone needs to be inferred [16].
Based on the location information over time, algorithms for inferring link travel times have been discussed in the literature (see for instance [12] for a discussion using the same data base as in this paper). Typically link travel time estimates are temporally aggregated into time-of-day-intervals for every given link. This generates panel data sets containing observations for many (link, day, time-of-day-interval) combinations.
Based on such data, in the literature the object to be modelled has been either the link travel time per se or the corresponding local speed. Clearly there exists a one-to-one relation between these two objects. However, as models involve measurement and model errors, and as the relation is non-linear, the corresponding results differ.
In the literature a preference for modelling local speeds has been motivated by the fact that speeds have been found to be normally distributed while the corresponding travel times show a substantial skewness [2, 7, 13, 15].
From a statistical point of view, normality of the measurements is not a necessary prerequisite for least squares estimation. For non-normal errors estimates will also be consistent, unbiased and coefficient estimators will be asymptotically normal (see for example chapter 4 and 5 of [17]). For a large number of observations the inefficiency of the least squares compared to the maximum likelihood estimator is not much of a concern. In small samples, however, the higher estimation efficiency achieved by using maximum likelihood estimation (which coincides with least squares for normal errors) might be beneficial. It is not clear how large a sample needs to be so that loss in efficiency is negligible.
Secondly, it is easier to compare speeds across different links since link travel times depend on the length of the links while the local speeds do not. However, investigating travel time per meter travelled in seconds per meter also allows for easy comparisons across links.
Thus in the literature we do not find strong and convincing arguments for direct modelling of travel times or indirect modelling of travelling speeds when the prime motivation for the modelling is the accuracy of the corresponding predicted route travel times. For example [7] state that travel times have been found to be skewed but nevertheless modelling uses the normality assumption.
In this paper the issue is investigated empirically for a large floating taxi dataset in Vienna. We apply the modelling methodology of [12] to local speeds and link travel times. We demonstrate that it depends on the measure of accuracy whether modelling speeds or travel times directly leads to better performance. Therefore it is the application, for which travel times are predicted, that defines the preferred method.
The paper is organised as follows: in the next section the data is presented. Section 3 describes the modelling while Section 4 discusses the results. Finally Section 5 draws conclusions.
2 Data set and descriptive analysis
In this paper an excerptFootnote 2 from the floating taxi data set collected by AIT Austrian Institute of Technology in Vienna since 2004 is used. The data has been collected by fleets of approximately 3500 taxis which submit their position roughly every minute. The locations are map matched and interpolated linearly resulting in estimated routes as well as link entry and exit times. The raw measurements of link travel times are aggregated in 15-min time intervals providing for each link and each 15-min interval an average link travel time as well as a count of taxis contributing to the travel time measurement. More details on the data collection process can be found in [12].
The data set used in this paper comprises a total of 761 days (1.7.2008 to 31.7.2010) of observed link travel times for all links in the Vienna urban road network consisting of more than 60 000 links according to the Teleatlas map representation used in this paper. Although the data set is somewhat dated at the time of writing our results will essentially depend on the features of the distribution of travel time measurements, in particular on the observed skewness. These features have already been observed by [2] and hence appear to be a stylized fact for travel time data. Thus the age of the data set does not appear to be of importance for our findings.
The floating taxi data for four somewhat arbitrarily picked locations is used to evaluate the models (see Fig. 1 for details on the locations):
-
(a)
Hietzing (H): 191 links around the main arterial in the West of the city leading past the tourist attraction Schönbrunn Palace, covering a total of 19.4 km.
Fig. 1 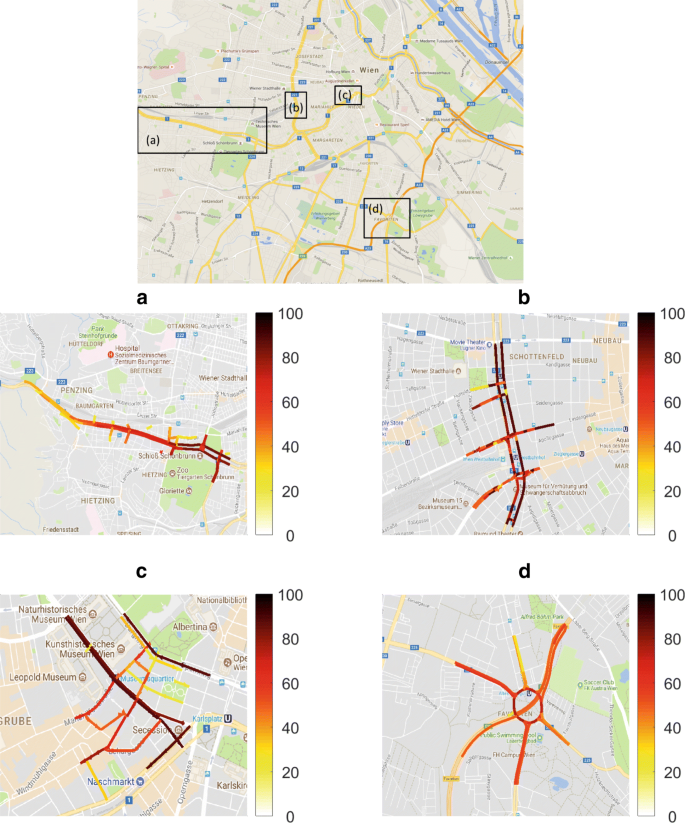
Location of the test sites. a Hietzing, b Westbahnhof, c Ring, d Südosttangente. The colour of the arrows indicates for a given link the percentage of time intervals for which at least one observation is obtained (white=0%, orange = 50%, black = 100%). Background image: ⒸGoogle maps
-
(b)
Westbahnhof (WBH): 122 links in the area of the Westbahnhof railway station. This area marks the limit between the inner city with the shopping street Mariahilferstrasse and the outer city, covering 6.1km. The train station lies on a very busy inner city arterial, the Gürtel (the ‘belt’).
-
(c)
Ring (R): 79 links in the innermost city with lots of tourist attractions, covering 6.4km.
-
(d)
Südosttangente (SOT): 58 links on the inner city highway including a number of feeder links, covering 7.0km. Südosttangente literally means ‘south-east tangent’.

The motivation for sub-sampling lies in the sheer size of the data set. This fact does not allow for a full analysis with the software used in this paper. From a statistical point of view, the pared down data sets dealt with in this paper are still to be considered large enough as the details on the sample sizes for the various estimated models below demonstrate.
The four locations contained in this paper have been selected in order to include a number of different neighbourhoods ranging from city highways, via main arterials to inner city regions which hence are likely to contain many different traffic scenarios.
Overall, the dataset used in this paper contains approximately 32.9 million taxi observations. The average data availability over links, days and time-of-day-intervals is plotted in Fig. 2. Data availability is defined as the number of 15-min intervals with at least one (valid) taxi observation divided by the total number of 15-min intervals; therefore a data availability of 0.5 for one link means that for this link on half of the observed 15-min intervals observations occur; for days it implies that for half of the possible (link, time-of-day-interval) combinations observations exist; for time-of-day-intervals a relative frequency of 0.75 means that in this interval for 75% of (link, day) combinations data has been observed. In addition to data availability, Fig. 2 also depicts the ECDFs (empirical cumulative distribution function) of the number of observations per time interval.

Empirical cumulative distribution functions (ECDF) for data availability for a links, b days, c time-of-day-intervals given as relative frequency of observations. d provides ECDFs for the number of taxi observations per link per day per interval. Hietzing (blue), Westbahnhof (black, dotted), Ring (red, dashed), Südosttangente (green, dash-dotted)
It can be seen in plot (b) (value at x=0) that the four datasets all show a value of approximately 8.5% of days on which no observations exist. Data availability on links varies from roughly 20% up to almost 90% (see plot (a)). The SOT shows the lowest coverage. All intervals (except for interval 96, which is not covered in the database excerpt due to a coding error) are roughly identically covered (cf. plot (c)). Approximately 19% of measurements (in all four datasets) are based on only 1 taxi observation, 12% on two observations, only 15% are based on more than 4 taxis (with WBH and R showing higher numbers of close to 24% and H and SOT only 9% and 3% respectively; see plot (d)).
Figure 3 provides information on the typical speed measurements: (a) provides the ECDF of the average speed (averaged over all days and time-of-day-intervals with observations for one link) for all links in m/s. It can be seen that for a number of links on the city highway Südosttangente higher average speeds are observed. In the inner city slow average speeds are observed (R). Plot (b) provides an exemplary plot of the data grouped across time-of-day-intervals (with confidence intervals superimposed) for a randomly chosen link in Hietzing showing a number of characteristic features: at 5:00 a sharp decrease in average speed is observed which is most likely due to changes in signal timing. Throughout the day congestion reduces the speed. For this link the evening peak appears more pronounced than the morning peak, indicating that the link is leading out of the city. Furthermore the length of the confidence intervals varies a lot over the course of the day. During midday variation is a substantial fraction of the average speed at roughly 14km/h. For a normal distribution this would correspond to a standard deviation of roughly 10km/h.

a ECDF of average speed for all links (in m/s). Hietzing (blue), Westbahnhof (black, dotted), Ring (red, dashed), Südosttangente (green, dash-dotted). b Typical grouped (over intervals) plot of link speed measurements in km/h (including confidence intervals) for one link in Hietzing
3 Modelling
In this paper we follow the methodology of [12] to obtain long-term (longer than one hour) predictions of expected travel time by decomposing:
where Eεl,d,i=0 and Xd,i∈RK contains day and time-of-day-interval specific regressors. Here l=1,…,L denotes the link modelled, d=1,…,D the day and i=1,…,95 the time-of-day-interval of 15 min.
The regressor Xd,i contains a constant, a weekday dummy (split into school days and school holiday periods) and sine and cosine terms to account for seasonal patterns (the smallest five non-zero Fourier frequencies are chosen, such that the corresponding signals show yearly cycles). Note that the regressor does not depend on the link whereas the coefficients are specific to the modelled link and the time-of-day-interval (so that a different daily pattern for each link is modelled) and a day category denoted as c(d). The day category is used in order to separate the model into a total of fourteen categories, one for each weekday separately for school holidays and school days. For details see [12].
The dependent variable yl,d,i here can equal the local speed measurements spl,d,i (in m/s) or the corresponding link travel times LTTl,d,i=Ll/spl,d,i (where Ll denotes the length in meters of the l-th link). In order to make the models comparable, link travel times are divided by the length of the links to obtain \(\overline {LTT}_{l,d,i}= 1/{sp}_{l,d,i}\) in seconds per meter.
This model is estimated using weighted least squares where the weights equal the inverse of the estimated variance as a function of the number of observations nl,d,i (in order to account for different measurement noise due to differing number of observations for one time-of-day-interval) and the mean travel time:
Here the parameters \(\hat \phi _{l,c(d),l}\) and \(\hat \delta _{l,c(d),i}\) are restricted to be non-negative. Different parametric forms of the dependence on the number of observations nl,d,i have been tested with the square root formulation leading to the best fit.
The most relevant regressors are selected using extensive model selection techniques based on information criteria minimization. Again, details are contained in [12].
Once the estimates are obtained, predictions of link travel times can be obtained. If link travel times are modelled directly, then the prediction equals
It is straightforward to see that we obtain the same predictions if \(\overline {LTT}_{l,d,i}\) are used as the dependent variable. If speeds are modelled, predictions can be obtained from:
which are different from \(\hat {LTT}_{l,d,i}^{dir}\) in general.
Here an issue arises due to the non-linearity of the mapping x↦1/x: The predictor used above has been termed ‘plug-in’ predictor, as it simply transforms the expectation via the non-linear mapping. Alternatively it would be possible to estimate the expectation of the non-linearly transformed quantity. For a log-normal distribution with expectation ν and variance η2 for the logarithm, for example, the expectation of the original random variable equals exp(ν+η2/2). However, as the distribution of the speed estimates are contaminated by strongly heteroskedastic measurement noise, it is not obvious how to incorporate the distribution into the prediction. We will see below that in some sense this seemingly omission is actually beneficial.
Finally when route travel time predictions are needed, these can be obtained from simply summing the link travel time predictions:
where ‘x’ stands for ‘dir’ or ‘indir’. The model above implies that the variance of the dependent variable is modelled as a function of the number of observations within one time-of-day-interval as well as the typical traffic condition. Moreover it varies over links, day categories and time-of-day-intervals. A companion paper deals with a more detailed investigation of the components of this variability as well as ways to assess the route travel time uncertainty for which also the covariances of link travel time estimates are of importance. For details see [1].
4 Results
Given that there are two different options to calculate the predictions, the question arises as to which of these two methods performs better in predicting the travel times for any given route or link. To investigate this question the data set is split into an estimation period (the first 701 days) and a validation period (the last 60 days). For all four locations link travel time predictions for all links have been obtained by estimating the model on the estimation data set and evaluating it on the validation set. The direct and the indirect method have been applied.
Figure 4 provides a kernel density estimate for the residuals of the link travel times from the direct and the indirect method for all links and all time-of-day-intervals on the validation period for all settings. Superimposed in the figure, the normal densities with corresponding mean and standard deviation are plotted (dashed lines). It is clearly visible that the direct method leads to skewed residuals (with a negative mode) that definitely are not normally distributed. The indirect method shows a pronounced bias underestimating the link travel times on average leading to positive average for the residuals. Plot (b) shows the same for the local link speed. Here it is clearly visible that the normality assumption is more plausible. In this plot the direct method shows a positive bias and mode related to the smaller estimated local speeds that result in higher estimated travel times. In this respect one might note that the expectation of the inverse is not the inverse of the expectation such that the differences in the mean values are to be expected.

Kernel density estimate for residuals of link travel times (a, c, e, g) and link speeds (b, d, f, h) for all links, all time-of-day-intervals on the validation set for Hietzing (a, b), Westbahnhof (c, d), Ring (e, f) and Südosttangente (g, h). Indirect method in blue, direct method in red. Estimated means are indicated as dash dotted lines, normal densities as broken lines
It is of interest to note that this property does not depend on the method of measuring as long as the skewness of the travel time distribution is captured by the measurements. The results below essentially root in this skewness and hence are expected to also hold true for other measurements of travel times or speeds.
In order to obtain a quantified comparison of the two methods it is necessary to first set a criterion for measuring accuracy. Four of the most often used criteria are the mean error (ME), the root mean squared error (RMSE), the mean percentage error (MPE) and the mean absolute percentage error (MAPE). All four criteria are used routinely in statistics as well as transportation, see also [6]. All measure the extent of the deviations from the expected value. For all criteria, less error is better. The main difference between these measures lies in the fact that the MPE and MAPE are relative error measures while the RMSE and the ME are absolute measures meaning that a 10 s error on a 100 s route induces the same RMSE/ME as a 10 s misprediction on a 1000 s long route while the MAPE/MPE is 10% in the first case and only 1% in the second.
Which of the criteria is more desirable depends on the application: for commercial route planning one might argue that RMSE/ME is the more relevant criterion as the commercial vehicle will be used on a number of routes on any given day. Hence, for planning the day schedule, the deviation from the schedule is important independent of the duration of every single trip. For individual route planning, however, the MAPE/MPE might be considered to be more appropriate as individuals performing only one trip will more readily accept ten minute deviation in travel time estimation for a two hour long trip than for a trip of just ten minutes.
Correspondingly in this section we report the results of prediction accuracy for all measures with the direct and the indirect estimation method. This will be done for the prediction of link travel times first. Subsequently a number of routes will be analysed.
As we are interested in finding statistically significant differences in prediction accuracy, we test whether one method is superior to the other method using a Diebold-Mariano [4] test. This test is essentially a t-test for the mean of the difference of the accuracy measures. In performing the tests, correlation between different observations are accounted for by using HAC-scheme estimators for the variance rather than the sample variance.
4.1 Prediction of link travel times
Limited preliminary results documented in [11] indicate that the direct method shows – as expected from OLS theory – better performance than the indirect method when using the RMSE as a measure of accuracy. This is also indicated by the fact seen in Fig. 4 that the residuals from the direct method do not show a bias contrary to the residuals of the indirect method. Therefore in the following we are interested in testing the null hypothesis H0,RMSE that the direct method has smaller or equal RMSE. For the MAPE the opposite has been proposed. Therefore we use the null hypothesis H0,MAPE that the MAPE of the indirect method is smaller or equal to the MAPE of the direct method.
These hypotheses can be investigated on different levels of aggregation. Table 1 shows the results on the most disaggregate level of using data from one link in one time-of-day-interval over all days in the sample. For the estimation sample we obtain on average (over all time-of-day-interval and link combinations) between 354 and 461 observations on which to base the tests. For the RMSE, the average Diebold-Mariano test for accuracy of the indirect minus accuracy of the direct method (\(\bar {DM}_{R}\)) here attains roughly a value of 3 indicating that the direct method is more accurate. Almost in all cases the null hypothesis H0,RMSE is not rejected. For the MAPE the average DM statistic (\(\bar {DM}_{M}\)) equals roughly -9, while in no case is the null hypothesis H0,MAPE rejected.
On the validation sample, the sample size is much smaller at approximately 59 observations and hence one might argue that the power of the tests here is not large. DM test values for RMSE now average roughly 1.4 and -2.5 for the MAPE (except for Hietzing). Also here the null is only rejected in less than 4% of the cases at confidence level 5%.
An interesting result is the average value of 4.27 for the MAPE in the Hietzing data set. This value is due to one single (link,time-of-day-interval) observation where only two raw observations (two days) are contained providing a DM test statistic of 11764. Omitting this value, the average DM statistic drops to -2.22.
Figure 5 provides plots of the ECDFs for the RMSE (a) and the MAPE (b) based DM test statistics for all links and all time-of-day-intervals on the validation sample. The four settings show a remarkably stable picture. The Diebold-Mariano tests asymptotically are standard normally distributed. Therefore the null hypothesis that the RMSE of the direct method is better than the one of the indirect method is rejected for values smaller than − 1.64. The figure shows that the bulk of the (link, time-of-day-intervals) show positive values, only rarely do values below − 1.64 occur. For the MAPE with the opposite ordering as the null hypothesis, values above 1.64 are extremely rare. Consequently the evidence from the link travel time investigation overwhelmingly underpins the hypotheses that for minimizing the RMSE the direct method is the preferred choice while with respect to the MAPE the indirect method is clearly superior.

ECDF for the DM test statistics for the validation sample and all (link,time-of-day-interval) combinations. a RMSE based, b MAPE based. Hietzing (blue), Westbahnhof (black, dotted), Ring (red, dashed), Südosttangente (green, dash-dotted)
Figure 6 provides an explanation for this behaviour: in plot (a) it is visible that for all time-intervals the direct method shows much less pronounced bias, while the indirect method underestimates the travel time. The downward bias in estimating the travel times for the indirect method obviously helps in terms of the MPE, as seen in plot (b): here the indirect method does not show a bias while the direct method on average shows a negative percentage error.

Average mean error (ME) and mean percentage error (MPE) for the validation sample averaged over links. a ME, b MPE. Hietzing (blue), Westbahnhof (black, dotted), Ring (red, dashed), Südosttangente (green, dash-dotted). Results for the indirect method in bold, results for the direct method in normal line width
4.2 Prediction of route travel times
Beside the comparison of link travel time predictions, route travel time predictions are also of interest. In this respect a set of eight routes in the four datasets is investigated. The location of the routes can be seen in Fig. 7. The route characteristics are collected in Table 2.

Routes considered in the four settings. First route in red, second route in green. a Hietzing b WBH c Ring d SOT
For every given route R=(l1,..,lr) consisting of links l1,…,lr the predicted route travel time is given as
These predicted travel times are in the following compared to estimated travel times on the basis of single taxis. For each taxi the inferred route as well as estimated link entry and exit times are contained in the raw data set.
In that matter we only have limited information at our disposal. For nine randomly selected days in 2012 the AIT Austrian Institute of Technology provided detailed information on taxis on the routes. Note that this is a tough validation of the models as it not only refers to out-of-sample predictions but also the data does not correspond to sum of link travel times but to directly measured route travel times.
Table 3 collects results corresponding to the prediction of route travel times. It can be seen that, in all cases but for the SOT data set, for both methods the average route travel time is overestimated on average. To put the numbers into perspective note that 50 km/h corresponds to a travel time of 0.072 s per meter. It can be seen that in particular in the inner city settings (WBH and R) the ME and the standard deviation is strong, while on the city highway SOT both are less pronounced. Due to the smaller ME, the RMSE for the indirect method is slightly better than the one from the direct method, contrary to the results of the last subsection. Here the DM test statistics indicate the superiority of the indirect method in all cases but the SOT setting. Remarkably, in this case, except for the SOT data set, in all other data sets the indirect method achieved better ME and better standard deviations.
In terms of the MPE and MAPE values, the indirect method achieves substantially smaller values again except in the SOT routes. This is also mirrored in the DM test statistics. In particular for the WBH data set, the MAPEs of the direct method are huge while arterial travel times are predicted better.
The results for one day are visible in Fig. 8. Here for each setting for one route all route travel times measured on Wednesday 1 February 2012 are compared to the predicted route travel times for Wednesday 26 January 2010, the most comparable day in the sample. It can be seen that on all but the SOT setting route travel times are overestimated somewhat. The indirect method results in less ME due to general smaller predicted travel times. For the SOT case this effect is reversed. But note that the average travel time on the SOT due to the shorter route is smaller than for the other cases.

Comparison of measured route travel times (in seconds) versus predicted (blue: direct, red: indirect method) for four routes. a Hietzing b WBH c Ring d SOT
5 Conclusion & outlook
In this paper we investigated the effects of modelling travel times directly or indirectly via implied speed for the prediction of travel times. The indirect approach has been slightly favoured by us a priori due to the more plausible assumption of local speeds to be normally distributed while travel times clearly possess skewed distributions.
The results on the level of link travel times unambiguously show that the direct modelling leads to smaller mean error and root mean square errors. The indirect approach of modelling local speeds leads to better predictions in terms of mean percentage error and mean absolute percentage error. It is argued that this result is a property of the distribution of travel times and hence is robust with respect to measurement technology (unless the measurement noise is so strong that it distorts the distribution). In particular it is expected that the results also hold true for current times and are not limited to our somewhat dated sample. Therefore the purpose of the prediction determines which modelling method is to be preferred.
On the level of route travel times the results in this paper indicate that, with respect to MPE or MAPE as an accuracy measure, again the indirect method provides better performance while the superiority of the direct method with respect to ME and RMSE could not be verified based on the validation data available to us. This difference in validation results might be due to small samples in terms of validation days such that abnormal conditions on these days (for example, icy or snow conditions on the road) could influence the results.
In combination, our results indicate that, for the prediction of route travel times, local link speeds are a viable basis for modelling. The implied travel times have better prediction accuracy in terms of MPE and MAPE and show slightly less accurate estimates in terms of ME and RMSE. This is mainly due to a slight downward bias which helps in terms of percentage error for the skew travel time distribution.
This result is of importance for routing devices as they typically optimize routes by minimizing the sum of the expected link travel times. More accurate predicted link travel times will lead to better routes and hence save time and costs. Our results indicate that the user should provide information on the preferred accuracy measure in order to choose the optimal method for predicting link travel times as the input to the routing: If one is interested in minimizing the mean squared error (as is relevant for logistics applications), then the direct method should be selected. However, if one is interested in obtaining a small mean absolute percentage error (as is arguably of more interest for individual travel time predictions), then the indirect method achieves better results.
Notes
Locations of taxis are used for dispatching, which is operated via radio channels showing a restricted bandwidth.
The excerpt has been provided by the AIT Austrian Institute of Technology for the dissertation project of Mirsad Tulic. The same excerpt is also used in the companion paper [1] focusing on the modelling of route travel time uncertainty.
References
Bauer D, Tulic M, Scherrer W (2017) Modelling Travel Time Uncertainty in Urban Networks based on Floating Taxi Data. Bielefeld University, Tech. rep.
Berry DS, Belmont DM (1951) Distribution of vehicle speeds and travel times In: Second Berkeley Symposium on Mathematical Statistics and Probability, 589–602.
Cipriani E, Nigro M, Fusco G, Colombaroni C (2014) Effectiveness of link and path information on simultaneous adjustment of dynamic O-D demand matrix. Eur Transp Res Rev 6:139–148.
Diebold FX, Mariano RS (1995) Comparing Predictive Accuracy. J Bus Econ Stat 13:253–263.
Jenelius E, Koutsopoulos HN (2013) Travel time estimation for urban road networks using low frequency probe vehicle data. Transp Res B 53:64–81.
Jenelius E, Koutsopoulos HN (2018) Urban network travel time prediction based on a probabilistic principal component analysis model of probe data. IEEE Trans Intell Transp Syst 19(2):436–445.
Kaparias I, Bell MG, Belzner H (2008) A New Measure of Travel Time Reliability for In-Vehicle Navigation Systems. J Intell Transp Syst 12(4):202–211.
Moghaddam S, Hellinga B (2013) Quantifying measurement error in arterial travel times measured by bluetooth detectors. Transp Res Rec J Transp Res Board 2395:111–122.
Toplak W, Koller H, Dragaschnig M, Bauer D, Asamer J (2010) Novel road classifications for large scale traffic networks In: Proceedings of the IEEE Conference on Intelligent Transportation Systems.. IEEE.
Treiber M, Kesting A (2013) Traffic flow dynamics: Data, models and simulation. Springer, Berlin Heidelberg.
Tulic M, Bauer D, Scherrer W (2013) Route Travel Time Prediction and Variability Estimation in an Urban Network Based on Taxi Floating Car Data In: hEART 2013 - 2nd Symposium of the European Association for Research in Transportation.
Tulic M, Bauer D, Scherrer W (2014) Link and Route Travel Time Prediction Including the Corresponding Reliability in an Urban Network Based on Taxi Floating Car Data. Transp Res Rec J Transp Res Board 2442:140–149.
Van Lint J, Van Zuylen HJ, Tu H (2008) Travel time unreliability on freeways: Why measures based on variance tell only half the story. Transp Res A Policy Prac 42(1):258–277.
Vlahogianni EI, Karlaftis MG, Golias JC (2014) Short-term traffic forecasting: Where we are and where we’re going. Transp Res C Emerg Technol 43(May 2016):3–19.
Wang Y, Dong W, Zhang L, Chin D, Papageorgiou M, Rose G, Young W (2012) Speed modeling and travel time estimation based on truncated normal and lognormal distributions. Transp Res Rec J Transp Res Board 2315:66–72.
Widhalm P, Nitsche P, Brändle N (2012) Transport Mode Detection with Realistic Smartphone Sensor Data In: Proceedings of the 21st International Conferene on Pattern Recognition (ICPR), 573–576.. IEEE.
Wooldridge JM (2014) Introduction to Econometrics. Cengage Learning, Andover.
Acknowledgements
Part of this work originated in the thesis work of Mirsad Tulic to which Wolfgang Scherrer from the TU Vienna contributed many insights as supervisor. The data set generated mostly by Hannes Koller from the AIT Austrian Institute of Technology has been provided by Taxi 31300 (taxi31300.at) and Taxi 40100 (taxi40100.at) which is gratefully acknowledged. We further acknowledge support for the Article Processing Charge by the Deutsche Forschungsgemeinschaft and the Open Access Publication Fund of Bielefeld University. Finally we are thankful to Ross MacDonald for proofreading the paper.
Author information
Authors and Affiliations
Contributions
MT prepared the data set and conducted the initial modelling. DB finalized the analysis and drafted the paper. Both authors contributed in equal parts to the final version of the paper. Both authors read and approved the final manuscript.
Corresponding author
Ethics declarations
Competing interests
The authors declare that they do not have competing interests.
Publisher’s Note
Springer Nature remains neutral with regard to jurisdictional claims in published maps and institutional affiliations.
Rights and permissions
Open Access This article is distributed under the terms of the Creative Commons Attribution 4.0 International License (http://creativecommons.org/licenses/by/4.0/), which permits unrestricted use, distribution, and reproduction in any medium, provided you give appropriate credit to the original author(s) and the source, provide a link to the Creative Commons license, and indicate if changes were made.
About this article

Cite this article
Bauer, D., Tulic, M. Travel time predictions: should one model speeds or travel times?. Eur. Transp. Res. Rev. 10, 46 (2018). https://doi.org/10.1186/s12544-018-0315-7
Received:
Accepted:
Published:
DOI: https://doi.org/10.1186/s12544-018-0315-7