
Abstract
This study presents audio based vehicle-verification as a new area of research. The task involves verifying the claim that an acoustic sample belongs to a vehicle. Audio based vehicle verification has the potential to impact research in the areas of vehicle forensics and in-vehicle speech systems. For this task, a new corpus (UTD-CAR-NOISE) that consists of noise from 20 vehicles under 8 distinct noise environments (∼8 hours of data). Our approach towards vehicle verification hypothesizes that some specific environments are more suited for vehicle verification. Towards this goal, four diverse in-vehicle noise conditions are identified on the basis of their frequency of occurrence. Additionally, four different verification systems are proposed based on their complexity and modeling strategies. Our evaluation shows that A/C on with windows closed condition is the most conducive for vehicle verification (98 %). The proposed systems were evaluated on approximately 100,000 trials, achieving performances in the range of (75–98 %) for different vehicle environments.
1 Introduction
Vehicle environments have emerged as a prime location for conducting voice based commerce in dialog systems, information exchange, and other business or entertainment exchanges. Drivers are spending more time commuting to work, and the need/desire to multi-task has resulted in increased voice-interactive engagement within the vehicle. One of the main challenges faced by speech and audio systems today is maintaining performance under varying acoustic environmental conditions. The diversity and rich structure of audio acoustic environments create the need for application specific robust speech solutions. Interactive speech solutions are a key area in robust speech system studies since they provide convenience and safety in mobile applications. These benefits of interactive speech systems have led to widespread deployment of mobile speech technology in vehicle environments. It has been estimated that 60 % of all cell phone calls initiated in the USA in 2005 were in vehicle environments. Efficient use of speech technology in the vehicle requires that technology be robust across acoustic conditions observed in vehicle environments. This is a challenging task because diversity in transportation platforms and operating conditions lead to significant acoustical variations for in-vehicle environments. The variation in transportation platforms are primarily due to different makes and models of vehicles. Furthermore, the operating environment such as road characteristics and weather contribute to overall variations. Road characteristics are a significant source of noise in the vehicle, and the surface properties of the road can change the in-vehicle noise (e.g., asphalt vs. concrete, and smooth vs. cracks or potholes). Also, vehicle noise characteristics depend on weather conditions such as rain, snow, wind, etc. Depending on the severity, these conditions can sometimes mask other noise events/types in the vehicle.
There have been several efforts in the past to study and model the vehicle acoustic and driver environment. An example of an international study is Takeda et al. (2011) where driver behavior is modeled empirically along with various other in-vehicle parameters. Studies specializing in in-vehicle noise include Ban et al. (2002) where model for vehicle noise is proposed that is a function of engine and road friction noises. This model was used to synthesize vehicle noise where engine noise was modeled using a long term spectral average and the friction noise was modeled as white noise with varying power. There have also been studies on perception of vehicle noise for various applications. Camacho et al. (2008) analyzed vehicle noise psycho-acoustics for roughness of perception, where it was found that the peak amplitude range of vehicle noise is linearly related to perceived roughness. Reducing noise in cars by modifying the interior acoustic properties, with specific focus on increased passenger comfort as well as to enable and improve the use of modern communication devices within the vehicle, is an active research topic in car interior design. Psycho-acoustical analysis of car noise on passengers has been studied by Ishimitsu et al. (2012). An overview of designing quiet car environments from an acoustics point of view is presented by Trainham (2005). However, it has also been found that a drastic reduction in ambient car noise compromises safety as shown by Horswill and Plooy (2008). By means of simulating video based driving scenes, Horswill showed that reducing the volume of car noise increases the reaction time to in-vehicle events. From this study, it is evident that the vehicle interior noise has cues which aid driving, and is important for overall safety. This suggests that a completely noise free vehicle environment is undesirable as some noise is important for safety. More recent interest in vehicle noise has also occurred due to the increased number of hybrid vehicles on the road. As a result, multimedia and speech systems in the vehicle can expect to be impacted by noise, which necessitates designing speech and audio systems that are robust to noise.
To enable a systematic analysis of the sources, characteristics, and the variability of noise in the vehicle environment, the acoustic environment inside a vehicle is divided into a finite set of classes of observable events. A typical example of events within the vehicle acoustic environment can be described as an acoustic tree structure as shown in Fig. 1. The position of a specific noise in the tree structure is determined on the basis of the information content available from the noise. For example, the most generic information that can be extracted from noise is if the source of noise is the vehicle itself, which forms the most abstract information about noise. The next two levels of the tree structure provide information of noise events such as the windows being open/closed, and the air-conditioner being switched ON or OFF. The information about the noise type is progressively more specific at lower levels of the tree hierarchy and the most specific information is available at the leaves of the acoustic tree structure. As seen from the noise tree structure, it is evident that noise in vehicle environments (\(\hat{n}_{ce}\)) is a function of event-specific but vehicle-independent (n e ) and vehicle-dependent event-specific noise component (n ce ), represented as,
Examples of event-specific-noise (n e ) include road friction noise, and wind noise. Additionally, vehicle specific noise (n ce ) include examples such as air-conditioner system and the car-horn where a large component of such noise varies between vehicles. There have been studies focused on detecting environment-events (n e ) independent of the car type, where this kind of event detection is also known as environment awareness in research. Previous research has shown that platform independent environment awareness (\(\hat{n}_{ce}\)) has been performed with a high degree of accuracy.

A knowledge based car noise tree structure. The leaves have most specific information
In this study, environmental information is employed in the vehicle to perform vehicle platform identification. This study compares various environments within the vehicle, and ranks these environments based on their accuracy in vehicle-identification. This new information can be easily exploited in vehicle identification systems, where the different environments are first identified, and subsequently the most conducive environments are used for identification. Previous approaches towards speech system robustness in car environments [Sect. 2] have tended to be limited as they consider event-variability within a vehicle, but ignore event variability across vehicles. However, for mobile speech applications, it is necessary to accommodate all variations across vehicle environments. It was noted by Hansen (2002) that the acoustic properties of vehicles vary with the make and driving conditions. This represents the motivation for a study on the variation in vehicle environments across different vehicles, since different vehicles have different acoustic properties under different driving conditions (Hansen 2002). In this study, for the first time, the variability of environmental noise across vehicles as well as vehicle-events is studied and modeled. This newly acquired knowledge is then used to determine a vehicle from an acoustic sample of its noise (vehicle verification systems). To the best of our knowledge, this is the first attempt for vehicle verification using acoustic samples. In the proposed vehicle verification system, acoustic samples from vehicles are used to train statistical models and determine specifics of the unknown vehicle based on the presented test data. Our verification setup is evaluated on 20 vehicles (vehicles and SUVs) with over 10,000 distinct test trials. For each vehicle, an analysis of in-vehicle acoustic events is performed and separability across vehicles/sessions is analyzed using the KL (Kullback-Leibler) distance. The separability analysis reveals good separation and motivates the use of various statistical algorithms for verification, namely, correlation, Mahanalobis, Likelihood, and KL based metrics. Based on the resulting accurate vehicle verification results, the proposed vehicle-verification system can be used to customize generic speech applications. Examples of such approaches include performing condition dependent model evaluations as proposed by Xu et al. (2006, 2007). Specific to the vehicle environment, knowledge of vehicle-events was leveraged in noisy ASR where vehicle event specific acoustic-models were dynamically chosen for decoding noisy speech (Environmental Sniffing by Akbacak and Hansen 2007). Using a similar paradigm in a speaker verification task, the knowledge of vehicle-make was used in correctly identifying the speaker by exploiting the constraint that for short periods of time a speaker (driver/passenger) is localized within their environment (vehicle) (Leonard and Hansen 2008). These examples outline a general strategy of exploiting vehicle-specific information for robust speech systems such as ASR, speaker recognition, speech enhancement, speech coding among others. The proposed work realizes this strategy by providing a viable means to obtain vehicle-specific information. The knowledge of the vehicle type/model and its environment can also serve as an extremely useful tool for acoustic platform forensics. An example of such a study includes Li et al. (2012) where noise properties of a car are used to identify car mechanical anomalies. Other applications including Kitzen et al. (1988), Taghia et al. (2011), Krishnamurthy and Hansen (1990) and Degan and Prati (1988), use noise specific information to improve audio playback and speech communications in environments including in car communications.
The study of variability in vehicle environments for vehicle verification or identification task is presented in the Sect. 2 of this paper. Here, given the acoustic sample and condition, the sample is scored against all different vehicle models with the highest scoring vehicle model is chosen. Section 3 describes the processes for corpus collection to facilitate experiments and the four different acoustic conditions for the given task. Several verification schemes have been proposed for the tasks along with a study of their advantages and shortcomings under varied conditions.
2 Previous research
2.1 Speech systems with vehicles
A number of research studies have considered various aspects of in-vehicle acoustic environments to improve performance of speech systems in vehicle noise. One approach is to exploit the unique properties of the car environment to enhance speech. Examples of such studies are provided in Lecomte et al. (1989), where the car noise is modeled as AR filters, and the estimated noise AR parameters is used for AR parameter estimation in noisy speech. These AR parameters were then used to provide car specific speech enhancement for noisy speech recognition. In another approach, Mokbel and Chollet (1995) proposed a feature enhancement/adaptation strategy where the characteristics of the Mel Frequency Cepstral Coefficients (MFCCs) in car environment were utilized to derive a non-linear Spectral Subtraction (SS) scheme. For perception centric systems, Arslan et al. (1995) suggested adaptive noise suppression algorithms for mobile applications and tested them on simulated car noise. Meyer and Simmer (1997) used the incoherence of car noise to perform a split spectrum enhancement of speech with a Wiener filter for higher frequencies and spectral subtraction for lower frequencies. Other approaches for robust speech systems in cars include multi-microphone solution proposed by Grenier (1992) and Martin and Vary (1992), where adaptive beam-forming is used to isolate speech from ambient noise. This approach was further improved by Zhang and Hansen (2003) by constraining the array processing separately in speech and noise activities during beam-forming. Additional applications of microphone array processing include combined solutions for echo cancellation and noise suppression as suggested by Kellermann (1997). These approaches either propose a car-independent solution to noise, or propose car event specific front-ends for better separation of noise and speech. Alternatively, the development of robust speech systems in the car has also been addressed by model based approaches such as noise aware speech systems. Akbacak and Hansen (2007) proposed Environmental Sniffing to automatically detect and characterize the acoustic environment and speech as a means of developing smart combined environment and speech solutions for robust interactive systems. Their approach uses different detectors to characterize noise, as well as a novel noise language model to incorporate statistically the long-term evolution of the acoustic environments. They applied this framework for automatic speech recognition (ASR) in a manner that utilizes a separate model for each noise event in the car environment, thus emulating matched test-training conditions. Kim and Hansen (2007) have proposed a joint speech-noise model that utilizes noise transition information based on a noise language model for noisy speech/model compensation.
It should be noted that model based approaches require specialized speech corpora for different car environments. Several speech corpora have been collected for in-vehicle environments in the past. The speech corpora from Kawaguchi et al. (2000) focuses on spontaneous conversational Japanese where the speech data is collected under car idling and driving conditions. Another corpus, CU-MOVE (Hansen et al. 2000) focused on speech data collection under diverse acoustic conditions in the car environment, with noisy speech collected in 6 different vehicles. The core portion of this speech corpus includes over 500 speakers from six US cities, with five speech style scenarios including interactive route navigation dialogs. The next section describes data collection for the proposed vehicle based analysis/modeling solutions, as well as for the subsequent experimental evaluation.
2.2 Event detection
The focus of the current research is on environmental event detection including event classification and improved models for acoustic noise. Environmental noise information can be used to leverage speech systems. Examples include Kates (1995), where environment information is used to improve hearing aid performance, as well as Ma et al. (2003) who performed acoustic background noise classification for generic context aware applications. In the car environment specifically, El-Maleh et al. (1999) proposed frame level noise classification for mobile acoustic environment, and Akbacak and Hansen (2007) formulated a comprehensive framework which was applied to the car scenario entitled “environment sniffing”, for supervised and unsupervised speech systems.
3 Corpus development
For the purposes of vehicle verification, a corpus of various vehicle sounds is required across different models of vehicles. A new vehicle noise corpus was established which consists of a range of conditions as described below to create the UTD-CAR-NOISE corpus and employed for analysis in this study (Krishnamurthy et al. 2012). This corpus is the first of its kind, and offers unique in-vehicle research opportunities. The corpus consists of data from 20 vehicles under the following conditions,
-
NAWC: No Air-Conditioning with Windows Closed
-
ACWC: Air-Conditioner engaged with Windows closed
-
NAWO: No Air-Conditioning with Windows Open
-
HNK: Windows closed with Car Horn
-
TRN: Turn signal engaged
-
IDL: Engine idling
-
REV: Engine revving
-
LDR/RDR: Left/Right door opening and closing
The specific driving route was fixed for all recordings to minimize the number of independent variables such as external noise and road noise. The average speed of the vehicle during recordings was 40 miles/hr, and data was collected on a route of duration 4 miles consisting of concrete roads. The route was selected to consist of a combination of 6-lane city roads with higher traffic density, and 2-lane concrete community roads with lower traffic density. The vehicle noise data recording was timed so as to minimize external traffic noise due to peak hours. The data was recorded using a Shure MX 391S far-field microphone fixed on the driver side sun-visor. Figure 2 shows the configuration of the data collection equipment in the vehicle. All acoustic recorded data was partitioned into the 8 classes previously noted. The conditions with windows closed, and windows open with the A/C disengaged constituted the bulk of the recordings since these represent a majority of the most frequently observed environmental conditions in vehicles.

The far-field microphone (B) is at the driver sun visor and the close-talking microphone (A) was head-worn
4 Analysis
As discussed in Sect. 1, the vehicle noise environment is a function of noise sources active in the vehicle, as well as the acoustic environment of the vehicle itself. In other words, the resultant vehicle noise is a function of vehicle-independent noise types (n e ), including ambient road noise and street noise, and vehicle dependent noise (n ce ), examples of such noise types include air conditioning and car noise. In this study, a simple additive model for (\(\hat {n}_{ce}\)) is assumed as shown in Fig. 3. Depending on the relative dominance of the constituent noises, the overall resultant noise observed can be classified into one of the three primary types.
-
Vehicle Internal Dominant: If vehicle dependent sounds such as air conditioning, horn, and engine sounds dominate, then the resulting noise (n e ) is unique to the specific vehicle producing the sound (i.e., if n e ≪n ce then \(\hat{n}_{ce} = n_{ce}\)). For purposes of vehicle verification, this forms the most conducive scenario.
-
Vehicle Environment Dominant: If the observed sound is the sound of the vehicle interacting with its environment, such as the sound of wheels on the road or wind noise, then the resulting vehicle noise is less vehicle specific/dominant (i.e. n ce <n e ). This scenario is less favorable for vehicle verification than the previous case.
-
Environment Dominant: Finally, noise sources external to the vehicle such as a horn from a nearby vehicle or engine sounds from a passing truck are considered outside the scope of this study. This is because these sounds are the least vehicle specific (if n ce ≪n e then \(\hat{n}_{ce} = n_{e}\)), and would cause increased confusability in acoustic vehicle platform identification. This condition is suggested for future studies.
In practice, it is very difficult to obtain these noise types in isolation, since all noise sources cannot be controlled simultaneously in naturalistic driving. However, in the process of vehicle noise data collection, careful selection of the recording conditions was exercised in order to minimize external noise. In practice, majority of times one of the noise types can be assumed to be dominant.

Model of the acoustic environment in the vehicle
Here, three noise conditions in the same vehicle are analyzed for their spectral content and their variability. These conditions consist of: NAWC, ACWC and NAWO as shown in Fig. 4. These environments were chosen because of their high probability of occurrence. Furthermore, these noise scenarios represent unique environments because the dominant sounds in each case are different (e.g., in ACWC, AC is dominant).

Vehicle Acoustic Environments: (1) Road and engine noise is predominantly low frequency, (2) Road, Engine and Air-conditioning shows structure in higher frequencies, (3) Wind noise wipes out all structure and only the aggregate remains
The spectral content of the vehicle acoustic environments under ACWC, NAWC, and NAWO conditions are shown in Fig. 4. As seen in Fig. 4(b), when the A/C is on and windows closed, the car noise is least time varying. The main noise sources in this environment are A/C, car engine, and road noise but the A/C is the most dominant source of noise. As seen from the corresponding spectral slope estimates, the ACWC scenario has the most high frequency content compared to the other two noise types. Also, this condition is the most conducive for vehicle verification since the AC and the fan/air blower are the most dominant noise sources. In the other two cases, wind noise and road noise are the main noise sources. When A/C is turned off, as seen in Fig. 4(a), vehicle noise is a mixture of road and engine noises. The only vehicle dependent noise type when the A/C is off and windows closed is the vehicle engine noise which is masked by the road noise. Finally, the last plot shows NAWO conditions where, the main noise sources are wind noise, road noise, and engine noise. NAWO has the least vehicle dependent information as compared to the other two environments since wind noise is external to the vehicle and masks all vehicle dependent information. The NAWO noise is dependent on the size of the window and its lowering, since the window sizes of most of the sedans are similar, and the noise was the most affected by external influences such as environmental conditions, differences in window in noise in our corpus did not correlate to the car types and was the least separable.
As seen from these experiments, vehicle dependent noise types are the best indicators of vehicle types and the vehicle dependent A/C noise, which can be viewed as a potential excitation source for the interior vehicle compartment, enables the noise to carry more car dependent information. To study the uniqueness and the variability in different acoustic conditions across cars, the acoustic data was modeled using N dimensional Gaussians (Features are described in Sect. 5) with the Kullback-Leibler distance employed to analyze the in-class and across-vehicle differences. This is illustrated in Fig. 5, where solid areas represent the acoustic space for a single vehicle in a particular environment, and the smaller shaded areas represent models of the session to session variability in the same acoustic event. Here, each session is modeled using a Gaussian pdf,
To estimate the separability across different vehicles, the in-class, and across-class KL distances are measured. The distance that is used here is the symmetric KL distance. The KL distance is a measure of separability of the pdfs. Let C i (μ i ,σ i ) and C j (μ j ,σ j ) be two Gaussians representing vehicle events, then the KL distance is given by,
To ensure the metric is symmetric the following operation is performed:
If the vehicle sound events are separable within this framework, the average in-class distances will be much lower than the out-of-class distances. These distances are evaluated for three vehicles and box plots of these distances are presented in Fig. 6. As seen for each of these vehicle conditions, the in-class (IS) distances are clearly separable from the out-of-class (OS) distances, indicating that these spectral based features are very useful for vehicle verification. Two additional noise types of interest are vehicle idle noise and horn noise type. Figure 7 shows the idling environment, which consists of primarily low frequency vehicle engine sound. This is interesting because it is the most basic of vehicle sounds and represents a base component of all other noise environments in the vehicle. This sound consists of the harmonics of the engine revving and is a function of engine size and properties of the engine. The other noise observed here is the horn of the vehicle. This consists of the engine idling sound in the lower frequencies along with harmonics of the horn sound. This noise type is intriguing because, the source is located outside the cabin whereas, the data is collected in the cabin. The dotted lines in Fig. 7 show the first standard deviation in the vehicle sound spectra. It is observed that the mechanical origin (engine and horn) have highly deterministic structure. However, these sounds are masked in most of the noise conditions making their analysis difficult.

Illustration of in-class vs. out-of-class distances for each noise event in a car. Each dotted region denotes a car and it encloses solid regions that denote session instances

KL distance statistics for in-class and out-of-class car noise for ACWC. Since, in-class and out-of-class distances are very separable, good verification is expected

(1) Vehicle engine noise concentrated in low frequency and is stationary, higher frequencies are noise. (Note: the frequency range is 0–1000 Hz.) (2) The vehicle horn consists of harmonics and the engine low frequency components (note: the frequency range in 0–4000 Hz)
In the next section, four separate verification strategies are proposed using the analysis methods studied here. This is followed by an evaluation for different acoustic environments.
5 Modeling and classifier design
Here, vehicle verification problem is proposed as a binary hypothesis problem where,
The claim is that a given set of acoustic samples X=X 1,X 2,X 3,…,X n belongs to a particular vehicle C. With this, the sample X∈H 0 occurs when the claim is true, and X∈H 1 when the claim is false. This involves measuring the distance of X from the model for vehicle C. The test statistic (f(X;μ,σ)) from the acoustic samples is compared to a threshold, and is used to determine the claim,
where μ and σ are the model mean and variances. Four different types of classifiers of varying complexity are studied here.
-
Normalized Euclidean Distance (EUC): Fig. 8 illustrates the essential components of this classifier with training and evaluation stages. In the training phase, features for the vehicle are modeled by a Gaussians using the mean (μ=E{X}) and variance (σ=E{X 2}−E{X}2). During the verification stage, the distance of each feature is evaluated from the model,
$$ {d_i}^2 = (X_i - \mu)^T{\varSigma^{-1}}(X_i - \mu) = \hat{d}\cdot \hat{d}^t $$(8)and verified by,
$$ E\bigl\{ {d_i}^2\bigr\} \lessgtr^{H_0}_{H_1} \tau. $$(9)The distance d i obtained using Eq. (8) is averaged to obtain a score for the session E{d i 2} using Eq. (9). This distance is compared with a threshold τ for vehicle verification. The smaller the distance, the closer the match between test and target vehicle.
Fig. 8 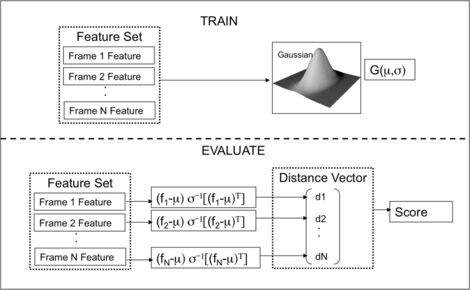
EUC: Normalized Euclidean distance based vehicle verification
-
Correlation Based Verification (CORR): As shown in Fig. 9, the correlation based detector employs a training phase where the acoustic features are averaged to obtain the train and test features. The correlation coefficient measure between the two is evaluated as,Footnote 1
$$ \rho= \frac{E\{X_{tr} X_{ev}\}}{|E\{X_{tr}\}||E\{X_{ev}\}|} $$(10)and
$$ \rho\lessgtr^{H_1}_{H_0} \tau. $$(11)The higher the value of the correlation co-efficient, the higher the similarity between the train and evaluation features.
Fig. 9 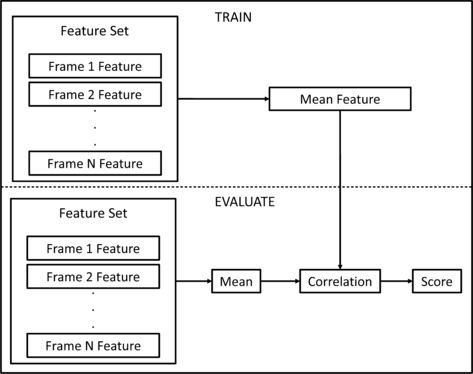
CORR: Correlation based vehicle verification system
-
Likelihood Based Detection (LIK): The Likelihood Based Detection is shown in Fig. 10. In this case, a vehicle specific as well as a Universal Vehicle Model is trained a priori. The car specific model is obtained from the training data and modeled using a Gaussian N(μ tr ,Σ tr ). The Universal vehicle model is a Gaussian N(μ un ,Σ un ) where the training data from all vehicles is pooled together. Each acoustic feature is scored against both models where the average Log-likelihood ratio computed as,
$$\begin{aligned} h(X_{i}) &= \frac{1}{2}(X_{i}-\mu_{tr})^{T} \varSigma_{tr}^{-1}(X_{i}-\mu _{tr}) \\ &\quad {}- \frac{1}{2}(X_{un}-\mu_{un})^{T} \varSigma_{un}^{-1}(X_{un}-\mu _{un}) \\ &\quad {} + \frac{1}{2} \ln\biggl(\frac{|\varSigma_{tr}|}{|\varSigma_{un}|}\biggr) \end{aligned}$$(12)with
$$ E\bigl\{ h({X}_i)\bigr\} \lessgtr^{H_0}_{H_1} \tau . $$(13)Here, the higher likelihood implies that the hypothesis is true.
Fig. 10 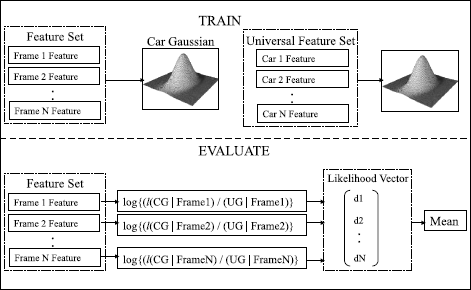
LIK: Likelihood Ratio based verification system where car model likelihoods (CG) are normalized by universal model likelihoods (UG)
-
Kullback-Leibler Distance (KLD): In this method (illustrated in Fig. 11) both training and evaluation data are modeled using Gaussians N(μ tr ,Σ tr ) and N(μ ev ,Σ ev ) respectively. The distance between the train (tr) and the evaluation Gaussians is given by,
$$\begin{aligned} &d(C_i,C_j) \\ &\quad {}= \frac{1}{2}\biggl(\log\biggl( \frac{|\varSigma_2|}{|\varSigma_1|}\biggr) - (\mu_1 - \mu_2) \varSigma^{-1}(\mu_1 - \mu_2)^t - n \biggr), \end{aligned}$$(14)where the verification is performed as,
$$ E\bigl\{ {d^2}\bigr\} \lessgtr^{H_0}_{H_1} \tau. $$(15)Here, both the evaluation and training data variances are used when evaluating the distances.
Fig. 11 
KLD: Kullback Leibler (KL) based vehicle verification system


Having considered the four modeling/classification methods, features are considered. The acoustic features that have been used are spectral based features and the process of feature extraction is explained in Fig. 12. Here, the temporal based analysis assumes a 50 % frame overlap, where each frame is indexed as “i”. The X i th feature is extracted as,
where, s i is the ith speech frame. This feature extraction is commonly used in speech processing to separate the low quefrency vocal tract structure along with the high quefrency excitation. The excitation in the speech signal in voiced speech is modeled by an impulse train. This impulse train is filtered by the vocal tract resonant structure. These coefficients provide a means to model this interaction. Similar to the speech case our simplistic model uses car noise as excitation that is mixture of harmonics and noise which is filtered by the car interior channel. Here, the low quefrency cepstrum is assumed to contain the vehicle acoustic structure and high quefrency components are expected to contain the noise components. The first cepstral component is considered, since it is a function of the spectral power and choose the first 9 cepstral coefficients as features for vehicle verification. To evaluate the performance of the vehicle-verification system, a detection error tradeoff (DET) curve is plotted for each verification task. DET plots are obtained as the probability of false-accept (P false ) vs. the probability of miss-detection (P miss ) as the threshold (τ) is varied.
The calculation of the error probabilities is described in Fig. 13 where the pdfs of the true scores and false claims are illustrated as dotted and solid lines respectively. Performance of the verification system varies with the choice of the threshold t. For example, for a threshold such as t 0 in Fig. 13, all true claims will be correct since the threshold is lower than the least true claim. This implies that P miss is 0 and P false is 1. However, for the threshold like t 2 in Fig. 13, all false claim scores are below the threshold implying P miss is 1 and P false is 0. In general, there would exist an equal error threshold t 1 where the areas under the pdfs to the left and right of the decision surface are equal (e.g., P miss =P false which is referred to as the equal error rate (EER)). DET curves allow for an overall system comparison without the requirement of knowing a specific required false accept or miss rate, and the EER allows for a meaningful single number for comparison.

Feature extraction for the vehicle verification system

Likelihood Ratio based verification system where car model likelihood scores are normalized by universal model likelihoods
6 Results
Vehicle verification is performed for a set of 20 vehicles across 4 different environmental conditions. Each vehicle has approximately 15 minutes of data sampled at 8 kHz. This data is windowed using 20 ms frames with no overlap. For the generation of DET plots, a total of 6,080 True and 104,000 False test cases were used. As seen from Fig. 14, the acoustic scenario consisting of the air-conditioning on with windows closed (ACWC) has the maximum amount of vehicle separability, and the air-conditioning off with windows open (NAWO) conditions has the least amount of vehicle separability. The performance of the horn (HNK) and the NAWC conditions are very close but these conditions are not as discriminating for vehicle verification as ACWC. In NAWC, the CORR and KLD systems have similar performance; whereas the LIK and EUC systems had comparable performance. In HNK, the four systems have the most variation in performance. While the KLD system has the best performance, and the LIK system has the poorest performance. The performance pattern in NAWO is similar to NAWC where KLD and COR systems have higher performance than EUC and LIK. Finally, ACWC has the best EER (2.5 %), with all proposed statistical systems performing equally well. The four DET curves illustrate that the particular noise condition in the vehicle (i.e., ACWC vs. NAWC, HNK, NAWO) is more significant than the choice of the classifier (e.g., compare EERs).

Vehicle verification DET curves showing the performance of the four verification systems. Clockwise from the top DET curves for A/C on windows closed (ACWC), A/C off Windows Closed (NAWC), Horn (HNK), and A/C off windows open (NAWO)
The above observations suggest low session variability for ACWC as argued in Sect. 3. This is expected in scenarios where the specific noise n e component dominates in \(\hat{n}_{ce}\). Alternatively, it is noted that the conditions where the internal vehicle noises dominate, the vehicle verification performance is very good. Furthermore, among the proposed models, the KL based verification system performs consistently across all scenarios. This indicates that the random process is very ergodic, (i.e., statistical parameter estimation is very reliable). On the other hand, the Likelihood based verification and the Euclidean distance based systems are inconsistent across all conditions. This is seen from Fig. 14 where only in ACWC, is the performance of LIK and EUC comparable to the other two systems. This indicates that it is better to either exclude variances in the verification process or include it in test as well as train. This intuition is substantiated since the CORR as well as KLD based schemes perform consistently well in all conditions.
The relatively lower performance of HNK condition is particularly interesting. Good performance is expected because even though the horn itself is vehicle structure dependent, the acoustic source is located outside the vehicle. This implies that the acoustic filtering through the vehicle has a significant impact on the spectral structure of HNK, resulting in lower performance. To summarize, these experimental results demonstrate the necessity of identifying differential treatment towards various vehicle events. In other words, vehicle verification is closely tied to the acoustic event under consideration. Furthermore, the effective performance of the proposed systems for vehicle verification implies that relatively inexpensive and computationally efficient solutions are possible. Finally, the use of more sophisticated techniques may be beneficial, but not always necessary for vehicle/environment identification.
6.1 Dependence on training and test data
In this section, the dependence of the verification algorithms and environmental scenarios on the amount training and test data is evaluated. Here, the variation in EERs (equal error rates) with a change in the number of train and test frames is observed. Lower EERs imply better system performance. The EER experiment was performed in two stages; Initially, the entire training data set was used and test data was varied from 2 frames to 50 frames. In the second stage, all test data was used and training data was varied from 2 frames to 50 frames. Figure 15 shows results for both stages of the experiment for the dependence of EER on the amount of training and test data. The dotted lines are EERs when the test data was varied and the train data was kept constant; and the solid lines are the EERs when train data was varied and all test data was used for evaluation. To ensure that different data points are used in different trials, the frames were randomized before use. Ideally, when all the test and training data is used, the dotted and solid lines should converge. As seen from the plots, the dotted lines are lower than the solid lines for the same verification system in most cases. This implies that the systems are more robust to variations in the amount of test data than train data. Moreover, larger improvements are obtained when the amount of train data is gradually increased. Additionally, the KLD and the COR based systems have a lower mismatch for test vs. training data variation than the EUC and the LIK detection schemes. This suggests that the EUC and the LIK schemes have a higher sensitivity for data variability, but that the other two schemes overcome this by using data statistics. This implies that the use of data statistics is more robust than the use of the raw data itself. In the ACWC and HNK cases, the gains in performance is almost monotonic and performance stabilizes with about 15-20 frames of data. It can be seen that in NAWC and NAWO conditions there is no definite structure in the performance curves for 20 frames. This indicates that for a reduced number of frames, an increment in data quantity does not stabilize data statistics due to the non-stationarity of the data.

The dependence of the test (dotted lines) and training (solid lines) data quantity for the EER for four conditions and four verification systems. In general, the systems require about 50 frames for stable performance. Each frame is 20 ms in width. ACWC: AC on windows closed. NAWC: AC off windows closed. HNK: Horn. NAWO: No AC windows open
These observations imply the following: (i) The process of randomizing frame selection in the above experiment demonstrates that non contiguous data can be used to perform vehicle verification equally well, (ii) we require only 0.4 s (20 frames) of data to obtain stable vehicle verification in each of the environments.
7 Impact on future in-vehicle systems
It is clearly out of scope of this paper to demonstrate quantitatively the impact of knowledge obtained from such platform identification technology in speech systems. In this section, commonly used processing configuration which leverage such information in a variety of in vehicle systems is presented (Fig. 16). In general, the input noise/noisy-speech signal would be processed using methods described in this study to obtain platform information as well as event ID. This information is used primarily in two ways (a) for selection of optimal operating conditions for the speech processing algorithm (e.g., VAD, Enhancement), and (b) for selection of previously trained code-books or acoustic models appropriate for those noise environmental scenarios. Here, we describe previous research for speech systems where such information is used by considering different speech systems in no particular order.
- VAD (Voice Activity Detection)::
-
Sangwan et al. (2008) used environment dependent optimal parameters for high performance voice activity detection systems.
- Enhancement::
-
In vehicle environments, either vehicle noise specific enhancement solutions can be provided as described by Lecomte et al. (1989) (vehicle dependent AR noise parameters are stored in a codebook) or vehicle noise model based speech enhancement can be employed as described by Sameti et al. (1998). In model based enhancement solutions, it is possible to either adapt the HMM models to the observed noise or to use the most accurate noise model for the observed signal. Examples of model based enhancements include Srinivasan et al. (2007) where code books of AR parameters for noise and speech are used to enhance noisy speech.
- ASR::
-
An overview of early methods for car noise compensation in ASR is provided in Ruehl et al. (1991). For speech recognition, either matched models (models with comparable noise and noise type to input) can be used for decoding the observed noisy speech, or approaches to speech enhancement such as that proposed by Alexandre and Lockwood (1993) where root cepstral analysis is performed to obtain improvements in isolated word recognition, or Hansen and Clements (1991) which employ noise dependent Auto-LSP enhancement for large vocabulary speech recognition front-ends. Lockwood and Boudy (1992) use noise parameter based HMM adaptation as examples for improving speech recognition in noise.
- Speaker ID::
-
This is an interesting application which can leverage platform information. Where platform ID is used to leverage Speaker ID performance as shown by Leonard and Hansen (2008). Also, the study by Hansen and Varadarajan (2009) showed that different noise types and levels have a distinct signature of Lombard effect on speech, and they employed this to improve speaker ID performance in Lombard effect scenarios.
- Generic Solutions::
-
In the absence of exact platform dependent model/parameters such information can be used to select the best alternate parameters/models for the given task. Such an approach can be seen in the study by Xu et al. (2006).
It is an important observation that different speech systems need not utilize all the platform/environment information available. Based on the complexity of the approach and the resolution of the noise space required, different speech applications would generally employ different levels of information. As an example application, a coarse estimate of the platform type might be required for a VAD as opposed to speaker ID systems, where an accurate noise ID is required to leverage the speaker ID performance. As seen from the above list, multimodality and distributed speech systems necessitate solutions that are robust across environments such applications will have an immediate benefit from such additional platform information. Apart form maintaining robustness, this information can also be used to develop intelligent speech solutions by distributing the compute resources available based on the SNR and the type of noise. Krishnamurthy and Hansen (2006) used such an approach to utilize/redistribute compute/memory resources for enhancement. Another such approach is by Akbacak and Hansen (2007) where platform ID is used to reduce the computational requirements of the ROVER based ASR in cars. The above mentioned studies describe the usage of platform ID information for robust and intelligent speech solutions. Many such approaches are possible and the above mentioned list is not exhaustive.

Vehicle information is extracted from noise and noise dependent strategies are used for optimal speech system performance
Apart from complementing speech systems, accurate performance in vehicle verification offers many exciting opportunities for research. The technology developed here can be used in the field of audio forensics. This technology can be adapted for low cost fault identification and monitoring in vehicles. Additionally, these technologies form the ground work for psycho-acoustical analysis of the relative comfort of vehicle nose types and events. Finally, the proposed techniques can be used to assist in-vehicle communication systems and the design of effective Human vehicle voice interfaces. As an enhancement of this study, CRSS-UTD continues to collect data across additional acoustic conditions to develop a diverse vehicle corpus for effective in-vehicle systems. By sharing such corpora, advances in areas noted in this section will occur at an increased pace.
8 Conclusions
In this study, an audio based vehicle verification system was proposed. It was shown that it is possible to uniquely identify a previously enrolled vehicle from its sample acoustic noise. The performance of the proposed acoustic vehicle verification system in four different environments was illustrated. It was shown that the vehicle-dependent noise types such as the engine and air-conditioner noise are the most discriminative, and therefore most useful for vehicle verification. It was also shown that the A/C on windows closed noise condition is the most conducive environment for vehicle verification. Four different verifications systems were proposed for the given task. It was observed that a correlation based metric performs best (98 % accuracy). Furthermore, the correlation based scheme is the most reliable, and for real time systems that require frame by frame processing Euclidean and likelihood based systems are the most effective solutions. The extremely accurate performance of simple yet robust vehicle verification systems show promise in many future speech/human-machine applications. The proposed technologies can impact many fields including forensics, in-vehicle psychoacoustics, automatic monitoring of the vehicle, and in-vehicle human machine systems.
Notes
Note “tr” represents training data, and should not be confused with the “trace” of a matrix, and “ev” stands for evaluation data.
References
Akbacak, M., & Hansen, J. H. L. (2007). Environmental sniffing: noise knowledge estimation for robust speech systems. IEEE Transactions on Audio, Speech, and Language Processing, 15(2), 465–477.
Alexandre, P., & Lockwood, P. (1993). Root cepstral analysis: a unified view. Application to speech processing in car noise environments. Speech Communication, 3, 277–288.
Arslan, L., McCree, A., & Viswanathan, V. (1995). New methods for adaptive noise suppression. In ICASSP-95, Detroit, MI, USA (Vol. 1, pp. 812–815).
Ban, Y., Banno, H., Takeda, K., & Itakura, F. (2002). Synthesis of car noise based on a composition of engine noise and friction noise. In ICASSP-02, Orlando, USA (Vol. 2, pp. 2105–2108).
Camacho, A., Pinero, G., De Diego, M., & Gonzalez, A. (2008). Exploring roughness perception in car engine noises through complex cepstrum analysis. Acta Acustica, 94, 130–140.
Degan, N. D., & Prati, C. (1988). Acoustic noise analysis and speech enhancement techniques for mobile radio applications. Signal Processing, 15(1), 43–56.
El-Maleh, K., Samouelian, A., & Kabal, P. (1999). Frame level noise classification in mobile environments. In ICASSP-99, Phoenix, USA (pp. 237–240).
Grenier, Y. (1992). A microphone array for car environments. In ICASSP-92, San Francisco, USA (Vol. 1, pp. 305–308).
Hansen, J., & Clements, M. (1991). Constrained iterative speech enhancement with application to speech recognition. IEEE Transactions on Signal Processing, 39, 795–805.
Hansen, J. H. L. (2002). Getting started with the CU-Move corpus. Robust Speech Processing Group (RSPG-CSLR).
Hansen, J. H. L., & Varadarajan, V. (2009). Analysis and compensation of lombard speech across noise type and levels with application to in-set/out-of-set speaker recognition. IEEE Transactions on Audio, Speech, and Language Processing, 17(2), 366–378.
Hansen, J. H. L., Plucienkowski, J., Gallant, S., Pellom, B., & Ward, W. (2000). CU-MOVE: robust speech processing for in-vehicle speech systems. In ICSLP-00, Beijing, China (Vol. 1, pp. 524–527).
Horswill, M. S., & Plooy, A. M. (2008). Auditory feedback influences perceived driving speeds. Perception, 37(7), 1037–1043.
Ishimitsu, S., Takami, K., Nakagawa, S., & Soeta, Y. (2012). Sound quality evaluation of car interior noise using brain magnetic field. Watermark 1.
Kates, J. M. (1995). Classification of background noises for hearing aid applications. The Journal of the Acoustical Society of America, 97, 461–470.
Kawaguchi, N., Matsubara, S., Iwa, H., Kajita, H., Takeda, K., Itakura, F., & Inagaki, F. (2000). Construction of speech corpus in moving car environment. In ICSLP-00, Beijing, China (Vol. 3, pp. 362–365).
Kellermann, W. (1997). Strategies for combining acoustic echo cancellation and adaptive beamforming microphone arrays. In ICASSP-97, Munich, Germany (Vol. 1, pp. 219–222).
Kim, W., & Hansen, J. H. L. (2007). Feature compensation employing model combination for robust speech recognition in in-vehicle environments. In DSP for in-vehicle and mobile systems, Istanbul, Turkey.
Kitzen, W. J., Kemna, J. W., Druyvesteyn, W. F., Knibbeler, C. L. & van de Voort, A. T. (1988). Noise-dependent sound reproduction in a car: application of a digital audio signal processor. Journal of the Audio Engineering Society, 36(1/2), 18–26.
Krishnamurthy, N., & Hansen, J. H. L. (1990). Trainable noise subtraction filters for speech enhancement in car. In Fifth European signal processing conference, Barcelona, Spain (pp. 1111–1114).
Krishnamurthy, N., & Hansen, J. H. L. (2006). Noise update modeling for speech enhancement: when do we do enough? In Interspeech-06, Pittsburgh, USA (pp. 1431–1434).
Krishnamurthy, N., Lubag, R., & Hansen, J. (2012). In-vehicle speech and noise corpora. New York: Springer.
Lecomte, I., Boudy, J., & Tassy, A. (1989). Car noise processing for speech input. In ICASSP-89, Glasgow, UK (pp. 512–515).
Leonard, M., & Hansen, J. H. L. (2008). In-set/out-of-set speaker recognition: leveraging the speaker and noise balance. In ICASSP-08, Las Vegas, USA (pp. 1585–1588).
Li, H., Zhao, Q., & Wen, B. (2012). Identification of the vehicle noise source by sound intensity method. Advanced Materials Research, 346, 634–638.
Lockwood, P., & Boudy, J. (1992). Experiments with a nonlinear spectral subtractor (nss), hidden Markov models and the projection, for robust speech recognition in cars. Speech Communication, 11(2–3), 215–228.
Ma, L., Smith, D., & Milner, B. (2003). Environmental noise classification for context-aware applications. In Lecture notes in computer science. Database and expert systems applications (pp. 360–370).
Martin, R., & Vary, P. (1992). A symmetric two microphone speech enhancement system theoretical limits and application in a car environment. In The digital signal processing workshop (pp. 4.5.1–4.5.2).
Meyer, J., & Simmer, K. U. (1997). Multi-channel speech enhancement in a car environment using Wiener filtering and spectral subtraction. In ICASSP-97, Munich, Germany (Vol. 2, pp. 1167–1170).
Mokbel, C., & Chollet, G. F. A. (1995). Automatic word recognition in cars. IEEE Transactions on Speech and Audio Processing, 3(5), 346–356.
Ruehl, H., Dobler, S., Weith, J., Meyer, P., Noll, A., Hamer, H., & Piotrowski, H. (1991). Speech recognition in the noisy car environment. Speech Communication, 10(1), 11–22.
Sameti, H., Sheikhzadeh, H., Deng, L. L., & Brennan, R. (1998). HMM-based strategies for enhancement of speech signals embedded in nonstationary noise. IEEE Transactions on Speech and Audio Processing, 6, 445–455.
Sangwan, A., Krishnamurthy, N., & Hansen, J. H. L. (2008). Environmentally aware voice activity detector. In Interspeech-08, Antwerp, Belgium (pp. 2929–2932).
Srinivasan, S., Samuelsson, J., & Kleijn, W. (2007). Codebook-based Bayesian speech enhancement for nonstationary environments. IEEE Transactions on Audio, Speech, and Language Processing, 15(2), 441–452.
Taghia, J., Taghia, J., Mohammadiha, N., Sang, J., Bouse, V., & Martin, R. (2011). An evaluation of noise power spectral density estimation algorithms in adverse acoustic environments (pp. 4640–4643).
Takeda, K., Hansen, J. H. L., Boyraz, P., Abut, H., Malta, L., & Miyajima, C. (2011). An international large-scale vehicle corpora for research on driver behavior on the road. IEEE Transactions on Intelligent Transportation Systems.
Trainham, J. (2005). Quieter rides. Automotive Engineering International, 113, 83.
Xu, H., Dalsgaard, P., Tan, Z., & Lindberg, B. (2006). Robust speech recognition from noise-type based feature compensation and model interpolation in a multiple model framework. In ICASSP-06, Toulouse, France (Vol. 1, pp. 1141–1144).
Xu, H., Dalsgaard, P., Tan, Z., & Lindberg, B. (2007). Noise condition-dependent training based on noise classification and SNR estimation. IEEE Transactions on Audio, Speech, and Language Processing, 15(8), 2431–2443.
Zhang, X., & Hansen, J. H. L. (2003). CSA-BF: a constraint switched adaptive beamformer for speech enhancement and recognition in real car environments. IEEE Transactions on Audio, Speech, and Language Processing, 11(6), 733–745.
Author information
Authors and Affiliations
Corresponding author
Rights and permissions
Open Access This article is distributed under the terms of the Creative Commons Attribution License which permits any use, distribution, and reproduction in any medium, provided the original author(s) and the source are credited.
About this article
Cite this article
Krishnamurthy, N., Hansen, J.H.L. Car noise verification and applications. Int J Speech Technol 17, 167–181 (2014). https://doi.org/10.1007/s10772-013-9215-3
Received:
Accepted:
Published:
Issue Date:
DOI: https://doi.org/10.1007/s10772-013-9215-3