
Abstract
We explore the network topology arising from a dataset of the overnight interbank transactions on the e-MID trading platform from January 1999 to December 2010. In order to shed light on the hierarchical structure of the banking system, we estimate different versions of a core–periphery model. Our main findings are: (1) the identified core is quite stable over time in its size as well as in many structural properties, (2) there is also high persistence over time of banks’ identified positions as members of the core or periphery, (3) allowing for asymmetric ‘coreness’ with respect to lending and borrowing considerably improves the fit and reveals a high level of asymmetry and relatively little correlation between banks’ ‘in-coreness’ and ‘out-coreness’, and (4) we show that the identified core–periphery structure could not have been obtained spuriously from random networks. During the financial crisis of 2008, the reduction of interbank lending was mainly due to core banks reducing their numbers of active outgoing links.


Notes
Systemic risk is closely related to financial contagion, see de Bandt and Hartmann (2000), and implies that an idiosyncratic shock causing the failure of one or few institutions may destabilize the entire system.
See also Allen and Gale (2000).
The density of a network is simply the fraction of existing links, relative to the maximum possible number of links. Ignoring the diagonal elements, the density can be calculated as \(M/(N^2 - N)\), with \(M\) being the number of observed links and \(N\) the number of active nodes (banks).
The in-degree is the number of incoming links, while the out-degree is the number of outgoing links per bank.
See Fricke et al. (2013) for an extensive discussion of the degree assortativity in scale-free networks.
We should mention another interesting approach in using network-based measures for financial regulation: Markose et al. (2010) use the eigenvector centrality in order to construct a ‘super-spreader’ tax.
The authors use comprehensive statistics from the so-called ‘Gross- und Millionenkreditstatistik’ (statistics on large loans and concentrated exposures) from the Deutsche Bundesbank. In Germany, financial institutions have to report (on a quarterly basis) their total exposure to each counterparty to whom they have extended credit of at least 1.5 million Euros or 10 % of their liable capital to the Bundesbank. These reports include outstanding claims of any maturity.
We cannot carry out such an analysis since we do not observe bank IDs, see below.
In the following, matrices will be written in bold, capital letters. Vectors and scalars will be written as lower-case letters.
Directed means that \(d_{i,j}\ne d_{j,i}\) in general. Sparse means that at any point in time the number of links is only a small fraction of the \(N(N-1)\) possible links. Valued means that interbank claims are reported in monetary values as opposed to 1 or 0 in the presence or absence of a claim, respectively.
The vast majority of trades (roughly 95 %) is conducted in Euro.
This development is driven by the fact that the market is unsecured. The recent financial crisis made unsecured loans in general less attractive, with stronger impact for longer maturities. See below. It should be noted, that there is also a market for secured loans called e-MIDER.
The minimum quote size could impose an upward bias for participating banks. It would be interesting to check who are the quoting banks and who are the aggressors. Furthermore it would be interesting to look at quote data, as we only have access to actual trades.
More details can be found on the e-MID website, see http://www.e-mid.it/.
Note that the density in the German interbank data analyzed by Craig and von Peter (forthcoming) is smaller for two reasons: first, the number of active banks is much larger, so it is more likely to observe missing links. Second, in our analysis we focus on overnight trades only, while Craig and von Peter (forthcoming) use aggregate credit volumes of all maturities (probably only with a small fraction of overnight trades). It seems plausible that the probability of observing a link between any two banks should be inversely related to the maturity of the loan.
Everett and Borgatti (2000) include the possibility of multiple cores.
The diagonal elements will be ignored in all that follows, since the network is not self-referential. Note that the arrangement of the adjacency matrix as in Eq. (1) is merely for the sake of illustration. The empirical implementation does not depend on such an arrangement.
See Doreian et al. (2005).
Note that in order to have a core, \(N_c\) has to be \(\ge \) 2. Also note the difference between \(\mathcal {C}\) and \(c\): \(\mathcal {C}\) is the set of core banks and thus is a vector of dimension \(N_c\), while \(c\) is a vector of zeros and ones. Of course, both \(\mathcal {C}\) and \(c\) carry the same information.
The maximum number of possible inconsistencies in this block would be \(N_c (N_c-1)\) since the main diagonal is ignored. This upper bound is obviously never reached since otherwise there would be no core–periphery structure.
Note that \(M\) is the maximum error possible in a network consisting only of a periphery.
This could be implemented by using standard algorithms for numerical optimization. Here we used a trust-region algorithm.
We also tried to fit the core–periphery models to the raw network matrices, however, the high level of skewness in the data results in a very poor fit in general. These results are hardly comparable to those presented below, see the online appendix to this article.
Estimating the continuous model with binary rather than discrete network matrices yields very similar results, see the online appendix to this article. The correlation of around 0.75 between both specifications can, thus, mainly be seen as the imprint of the rounding of continuous coreness values towards 0 and 1 by the discrete model.
Table 1 Correlations between individual coreness vectors of different models Recall that the number of banks in the German market is roughly 1800, so the network is at least 10 times larger than the Italian network. Thus it is not surprising, that the density is much higher in the Italian case. Since the e-MID sample presumably contains mainly large banks, our core might be the core of the overall banking network. The online appendix to this article contains a network illustration for one particular quarter.
Fig. 5 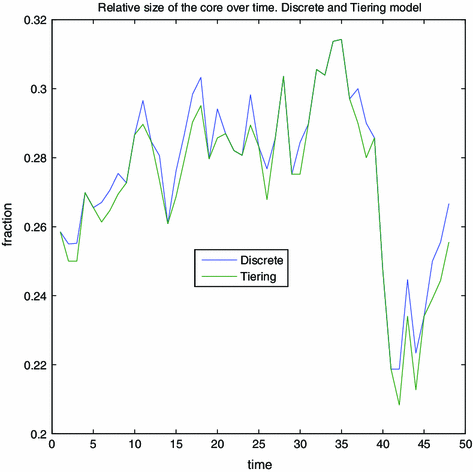
Relative size of the core over time. A Chow-test indicates that there is a structural break after quarter 39 at all sensible significance levels. An additional CUSUM test indicates that this break is marginally significant at the 5 % level. (Color figure online)
Fig. 6 
Density of the entire network, CC/PP blocks (left), and off-diagonal blocks (right). Individual Chow-tests indicate that there is a structural break in the time-series in the left panel after quarter 39 at all sensible significance levels (see also Fig. 2). Additional CUSUM-tests indicate that the structural breaks are significant at all sensible significance levels, with the PP-density apparently containing an additional structural break around quarter 10. In contrast, we cannot reject the hypothesis of no structural break in the time-series of the right panel. (Color figure online)
Results from the tiering model are available upon request. We checked that the results from the tiering model are statistically not distinguishable from the results of the discrete model.
See the online appendix to this article for analytical results on the expected core size and error score in ER networks.
In actual interbank networks, the observed scaling parameters vary between 2 and 3. Here we take the value reported by De Masi et al. (2006) for the e-MID data. We emphasize, however, that these values are chosen only for the sake of defining a scale-free benchmark model. In a companion paper (Fricke and Lux 2013) we revisit the question of a power-law distribution of the degrees in this dataset and find no evidence in favor of anything similar to a scale-free distribution.
Interestingly, Craig and von Peter (forthcoming) found that the error scores for the German interbank market are significantly smaller than those obtained for synthetic SF networks. Thus, it seems remarkable that the SF error scores are typically smaller than the actual ones in the Italian case; however, when we impose the restriction that the SF cores be of the same size as the actual ones, the SF error scores will always exceed the actual ones.
Recall that the coreness values from the continuous model are standardized values.
Obviously the fit has to be better in the AC model, since we have twice as many parameters. Interestingly, the fit is mostly more than twice as good as the fit of the SC model.
Fig. 11 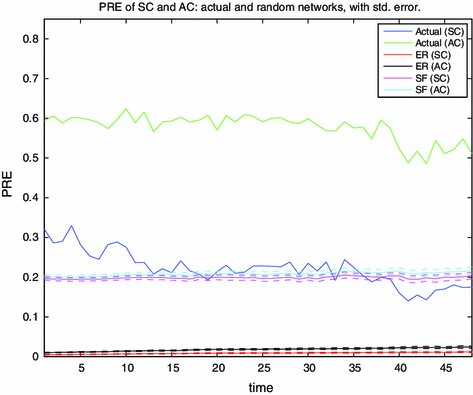
PRE for the SC and the AC model, actual and random graphs. A Chow-test indicates that there is a structural break after quarter 39 at all sensible significance levels for the PRE of the AC model. The results from an additional CUSUM-test are also in favor of the existence of a structural break. The PRE of the SC model appears to display an additional structural break after quarter 10. For the SF networks we used a scaling parameter of \(\alpha =2.3\) both for the in- and out-degrees. (Color figure online)
In this approach, we first generated directed random ER and SF networks as explained above. Then, we randomly assigned observed transaction volumes from the actual networks (log-transformed) to the random ones. The results are essentially identical with and without replacement. Here we present the results without replacement. The last step consists of fitting the continuous CP models to the synthetic networks.
Note that the PREs of the AC model are always larger than those from the SC model, both for the actual and the random networks (even though for the random networks not always significantly). This is driven by the higher number of parameters (degrees of freedom) in the AC model.
Again the results for the tiering model are very similar and available upon request.
It would be interesting to analyze the interest rates charged in the different blocks in more detail. This is, however, beyond the scope of this paper. Here we just note that the (volume-weighted) interest rates charged in the CC-block are typically quite large. Thus, it seems that core banks price in the systemic importance of other core banks. Interestingly, the interest rates in the CP-block are statistically indistinguishable from those in the CC-block, while the interest rates in the PC-blocks are significantly smaller. This indicates that core banks benefit from their role by borrowing relatively cheap from the periphery and lending at a higher rate to both core and periphery banks.
See De Masi et al. (2006).
Interestingly, the number of reciprocal links, i.e. the fraction of links pointing in both directions, goes down due to the GFC. This is somewhat surprising, since we would expect that bilateral relationships become closer in crisis times.
The increase in the number of trades in the PC-block after the GFC is even more impressive, ending up above the pre-GFC level.
Interestingly, core banks lend more money than they borrow from the periphery, thus the core is a net lender to the periphery.
In fact, this bank (ID number ‘IT0278’) was in the core during the complete sample period.
These numbers just underline the observed asymmetry between the CP- and PC-blocks.
It would be interesting to see the quote data, rather than the transaction data. We suspect, that many quotes are simply never executed during the GFC.
Note that communities are usually defined as very dense subgraphs, with few connections between them. The periphery is thus more of an anti-community.
We also checked several standard community detecting algorithms for the Italian interbank network. The main finding is that, for the entire market, we find two separate communities consisting of foreign and Italian banks, respectively. Interestingly, it is impossible to split these communities further into smaller subcommunities.
For example, in a scientific network, the core agents are the highly productive agents being cited by many others. See Mullins et al. (1977).
Persitz (2009) provides a formal model for a power-based core–periphery network. The basic idea is that linking preferences are such that all agents prefer establishing links to ‘superior’ agents relative to ‘inferior’ agents.
For banks, the comparative advantage may stem from economies of scope and scale, but also from very frequent interactions on the market which small periphery banks usually do not have.
Note that the highest efficiency is realized in star-like configurations, while the highest resilience is related to the avoidance of short loops and degree homogeneity. See also Netotea and Pongor (2006).
Note that this is equivalent to the benchmark against which the error reduction by the continuous core–periphery model is measured.
See also Markose et al. (2010).


References
Acemoglu, D., Carvalho, V. M., Ozdaglar, A., & Tahbaz-Salehi, A. (2012). The network origins of aggregate fluctuations. Econometrica, 80(5), 1977–2016.
Affinito, M. (2012). Do interbank customer relationships exist? And how did they function in the crisis? Learning from Italy. Journal of Banking and Finance, 36(12), 3163–3184.
Akram, Q., & Christophersen, C. (2013). Norwegian overnight interbank interest rates. Computational Economics, 41(1), 11–29.
Allen, F., & Gale, D. (2000). Financial Contagion. Journal of Political Economy, 108(1), 1–33.
Barabasi, A.-L., & Albert, R. (1999). Emergence of scaling in random networks. Science, 286(5439), 509–512.
Beaupain, R., & Durré, A. (2012). Nonlinear liquidity adjustments in the Euro area overnight money market, working paper series 1500, European Central Bank.
Bech, M., & Atalay, E. (2010). The topology of the federal funds market. Physica A, 389(22), 5223–5246.
Borgatti, S. P., & Everett, M. G. (2000). Models of core/periphery structures. Social Networks, 21(4), 375–395.
Boss, M., Elsinger, H., Summer, M., & Thurner, S. (2004). Network topology of the interbank market. Quantitative Finance, 4(6), 677–684.
Boyd, J. P., Fitzgerald, W. J., & Beck, R. J. (2006). Computing core/periphery structures and permutation tests for social relations data. Social Networks, 28, 165–178.
Boyd, J. P., Fitzgerald, W. J., Mahutga, M. C., & Smith, D. A. (2010). Computing continuous core/periphery structures for social relations data with MINRES/SVD. Social Networks, 32(2), 125–137.
Braeuning, F. (2011). Relationship lending and peer monitoring: Evidence from interbank payment data, Tinbergen Institute, Mimeo
Brede, M., & de Vries, B. J. (2009). Networks that optimize a trade-off between efficiency and dynamical resilience. Physics Letters A, 373(43), 3910–3914.
Brusco, M. (2011). An exact algorithm for a core/periphery bipartitioning problem. Social Networks, 33(1), 12–19.
Caccioli, F., Catanach, T. A., & Doyne Farmer, J. (2011). Heterogeneity, correlations and financial contagion. ArXiv [E-prints].
Christley, R. M., Pinchbeck, G. L., Bowers, R. G., Clancy, D., French, N. P., Bennett, R., et al. (2005). Infection in social networks: Using network analysis to identify high-risk individuals. American Journal of Epidemiology, 162(10), 1024–1031.
Cocco, J. F., Gomes, F. J., & Martins, N. C. (2009). Lending relationships in the interbank market. Journal of Financial Intermediation, 18(1), 24–48.
Colander, D., Goldberg, M., Haas, A., Juselius, K., Kirman, A., Lux, T., et al. (2009). The financial crisis and the systemic failure of academic economics. Critical Review, 21(2–3), 249–267.
Craig, B., & von Peter, G. (forthcoming). Interbank tiering and money center banks. Journal of Financial Intermediation.
de Bandt, O., & Hartmann P. (2000). Systemic risk: A survey, working paper series 35, European Central Bank.
De Masi, G., Iori, G., & Caldarelli, G. (2006). Fitness model for the Italian interbank money market. Phys. Rev. E, 74(6), 66112.
Doreian, P., Batagelj, V., & Ferligoj, A. (2005). Generalized blockmodelling. New York: Cambridge University Press.
Everett, M. G., & Borgatti, S. P. (2000). Peripheries of cohesive subsets. Social Networks, 21(4), 397–407.
Finger, K., Fricke, D., & Lux, T. (2013). Network analysis of the e-MID overnight money market: The informational value of different aggregation levels for intrinsic dynamic processes. Computational Management Science, 10(2–3), 187–211.
Finger, K., & Lux T. (2014). The evolution of the banking network: An actor-oriented approach, mimeo.
Freixas, X., Parigi, B. M., & Rochet, J.-C. (2000). Systemic risk, interbank relations and liquidity provision by the central bank. Journal of Money, Credit and Banking, 32(3), 611–638.
Fricke, D., Finger, K., & Lux, T. (2013). On Assortative and disassortative mixing in scale-free networks: The case of interbank credit networks, Kiel working paper 1830, Kiel Institute for the World Economy.
Fricke, D., & Lux, T. (2013). On the distribution of links in the interbank network: Evidence from the e-MID overnight money market, Kiel working paper 1819, Kiel Institute for the World Economy.
Goh, K.-I., Kahng, B., & Kim, D. (2001). Universal behavior of load distribution in scale-free networks. Physical Review Letters, 87, 278701.
Haldane, A. (2009). Rethinking the financial network, Speech delivered in April 2009 at the Financial Student Association, Amsterdam.
Haldane, A. G., & May, R. M. (2011). Systemic risk in banking ecosystems. Nature, 469(7330), 351–355.
Ho, T. S. Y., & Saunders, A. (1985). A micro model of the federal funds market. Journal of Finance, 40(3), 977–988.
Inaoka, H., Ninomyia, T., Taniguchi, K., Shimizu, T., & Takayasu, H. (2004). Fractal network derived from banking transaction—an analysis of network structures formed by financial institutions, Bank of Japan working papers, pp. (04-E-04), 1–22.
Iori, G., De Masi, G., Precup, O. V., Gabbi, G., & Caldarelli, G. (2008). A network analysis of the Italian overnight money market. Journal of Economic Dynamics and Control, 32(1), 259–278.
Iori, G., Jafarey, S., & Padilla, F. G. (2006). Systemic risk in the interbank market. Journal of Economic Behavior and Organization, 61(4), 525–542.
Kernighan, B. W., & Lin, S. (1970). An efficient heuristic procedure for partitioning graphs. The Bell System Technical Journal, 49(1), 291–307.
Langfield, S., Liu, Z., & Ota, T. (2012). Mapping the UK interbank system, Bank of England, working paper.
Luo, F., Li, B., Wan, X.-F., & Scheuermann, R. (2009). Core and periphery structures in protein interaction networks. BMC Bioinformatics, 10(Suppl 4), S8.
Markose, S., Giansante, S., Gatkowski, M., & Shaghaghi, A. R. (2010). Too interconnected to fail: Financial Contagion and systemic risk in network model of CDS and other credit enhancement obligations of US banks, Economics Discussion Papers 683, University of Essex, Department of Economics.
Martinez-Jaramillo, S., Alexandrova-Kabadjova, B., Bravo-Benitez, B., & Solorzano-Margain, J. P. (2012). An empirical study of the Mexican banking system’s network and its implications for systemic risk, working papers 2012–07, Banco de Mexico.
Mistrulli, P. E. (2007). Assessing financial Contagion in the interbank market: Maximum entropy versus observed interbank lending patterns, Temi di discussione (Economic working papers) 641, Bank of Italy, Economic Research Department.
Mullins, N. C., Hargens, L. L., Hecht, P. K., & Kick, E. L. (1977). The group structure of cocitation clusters: A comparative study. American Sociological Review, 42(4), 552–562.
Muniz, A. S. G., & Carvajal, C. R. (2006). Core/periphery structure models: An alternative methodological proposal. Social Networks, 28(4), 442–448.
Muniz, A. S. G., Raya, A. M., & Carvajal, C. R. (2011). Core periphery valued models in input–output field: A scope from network theory. Papers in Regional Science, 90(1), 111–121.
Netotea, S., & Pongor, S. (2006). Evolution of robust and efficient system topologies. Cellular Immunology, 244(2), 80–83.
Persitz, D. (2009). Power in the heterogeneous connections model: The emergence of core–periphery networks, working papers 2009.42, Fondazione Eni Enrico Mattei.
Sheldon, G., & Maurer, M. (1998). Interbank lending and systemic risk: An empirical analysis for Switzerland. Swiss Journal of Economics and Statistics (SJES), 134(IV), 685–704.
Snijders, T. A. B. (1996). Stochastic actor-oriented dynamic network analysis. Journal of Mathematical Sociology, 21, 149–172.
Snijders, T. A. B. (2001). The statistical evaluation of social network dynamics. Sociological Methodology, 31(1), 361–395.
Soramäki, K., Bech, M. L., Arnold, J., Glass, R. J., & Beyeler, W. (2007). The topology of interbank payment flows. Physica A, 379, 317–333.
Stolzenburg, U., & Lux, T. (2011). Identification of a core–periphery structure among participants of a Business Climate Survey. Eur. Phys. J. B., 84, 521–533.
Summer, M. (2013). Financial contagion and network analysis. Annual Review of Financial Economics, 5, 277–297.
Trichet, J. (2011). Intellectual challenges to financial stability analysis in the era of macroprudential oversight. Financial Stability Review, 15, 139–149.
Upper, C., & Worms, A. (2004). Estimating bilateral exposures in the German interbank market: Is there a danger of Contagion? Cross-Border Bank Contagion in Europe, European Economic Review, 48(4), 827–849.
van Lelyveld, I., & in ’t Veld, D. (2012). Finding the core: Network structure in interbank markets, DNB working papers 348, Netherlands Central Bank, Research Department.
Vriend, N. J. (1995). Self-organization of markets: An example of a computational approach. Computational Economics, 8(3), 205–231.
Wilhite, A. (2001). Bilateral trade and ‘small-world’ networks. Computational Economics, 18(1), 49–64.
Acknowledgments
The article is part of a research initiative launched by the Leibniz Community. We also acknowledge support by the European Union Seventh Framework Programme FP7/2007-2013 under CRISIS-ICT-2011 grant agreement no. 288501 and THEME-SSH-2013 grant agreement no. 612955. We are grateful to the participants of the SNA Workshop 2011 at the Vrije Universiteit Amsterdam, seminar participants at the Kiel Institute for the World Economy, Karl Finger, Sheri Markose, Uli Stolzenburg, and two anonymous referees for their helpful and detailed comments.
Author information
Authors and Affiliations
Corresponding author
Electronic supplementary material
Below is the link to the electronic supplementary material.
Rights and permissions
About this article
Cite this article
Fricke, D., Lux, T. Core–Periphery Structure in the Overnight Money Market: Evidence from the e-MID Trading Platform. Comput Econ 45, 359–395 (2015). https://doi.org/10.1007/s10614-014-9427-x
Accepted:
Published:
Issue Date:
DOI: https://doi.org/10.1007/s10614-014-9427-x