Abstract
There is increasing evidence that behavioral flexibility is associated with the ability to adaptively respond to environmental change. Flexibility can be advantageous in some contexts such as exploiting novel resources, but it may come at a cost of accuracy or performance in ecologically relevant tasks, such as foraging. Such trade-offs may, in part, explain why individuals within a species are not equally flexible. Here, we conducted a reversal learning task and predation experiment on a top fish predator, the Northern pike (Esox lucius), to examine individual variation in flexibility and test the hypothesis that an individual’s behavioral flexibility is negatively related with its foraging performance. Pikes were trained to receive a food reward from either a red or blue cup and then the color of the rewarded cup was reversed. We found that pike improved over time in how quickly they oriented to the rewarded cup, but there was a bias toward the color red. Moreover, there was substantial variation among individuals in their ability to overcome this red bias and switch from an unrewarded red cup to the rewarded blue cup, which we interpret as consistent variation among individuals in behavioral flexibility. Furthermore, individual differences in behavioral flexibility were negatively associated with foraging performance on ecologically relevant stickleback prey. Our data indicate that individuals cannot be both behaviorally flexible and efficient predators, suggesting a trade-off between these two traits.
Introduction
Behavioral flexibility is a key trait influencing an animal’s ability to adaptively respond to rapid environmental change (reviewed in Wright et al. 2010), yet not all species or populations are flexible. For example, some species will readily adopt new foraging techniques, incorporate novel foods into their diet, and generally modify their behavior in the face of environmental change (Timmermans et al. 2000; Sergio et al. 2011), whereas others are slower or resistant to change. These differences often have fitness-related consequences, and there is growing evidence that species that are more flexible in their behavior tend to be more successful in novel and rapidly changing environments (Sol and Lefebvre 2000; Sol et al. 2002; Wright et al. 2010). Thus, understanding variation in behavioral flexibility can be a powerful predictor of a species’ response to the growing number of anthropogenic environmental changes (Tanner et al. 2011; Blumroeder et al. 2012).
There is also increasing evidence for variation in behavioral flexibility among individuals within a population of a single species (Koolhaas et al. 1999; Laland and Reader 1999a, b; Boogert et al. 2006; Dally et al. 2008). For example, individual rainbow trout differ in the speed at which they respond and adapt to changes in the location of food resources (Ruiz-Gomez et al. 2011); some individuals are more flexible and responsive to change, whereas others are less flexible. Such behavioral differences have been interpreted as differences in coping styles, whereby some individuals are cautious and flexible (“reactive” individuals), whereas other individuals are bold and more routinized (“proactive” individuals) (Verbeek et al. 1994; Koolhaas et al. 1999; Bolhuis et al. 2004; Coppens et al. 2010). These interindividual differences in flexibility can have differential fitness consequences depending on environmental conditions, such as population density and food availability (Koolhaas et al. 1999), and can be important predictors of the response of individuals to human-induced environmental changes (Sih et al. 2011; Sih 2013).
While the ability to flexibly modify behavior might be advantageous in a new or rapidly changing environment, it could come at the cost of accuracy or performance in ecologically relevant tasks such as foraging. Indeed, there is increasing evidence of a trade-off between speed and accuracy, along with interindividual variation in these traits; some individuals are consistently “fast and sloppy,” while others are “slow and meticulous” (Chittka et al. 2009). For example, natural populations of guppies contain individuals that are consistently “hasty” and make more mistakes in a spatial learning task compared to other individuals that are consistently “careful” and make significantly fewer errors in the same task (Burns and Rodd 2008). Similarly, there are consistent individual differences in speed and accuracy in many social bee species, such that some individuals make fast decisions on where to forage but with low accuracy, whereas others are more accurate but slower decision makers (Chittka et al. 2003; Burns and Dyer 2008). Together, the literature on coping styles and the negative relationship between speed and accuracy suggest that there may be a trade-off between behavioral flexibility and foraging performance. Such behavioral trade-offs may, in part, contribute to our understanding of why individuals are not equally flexible and how individual variation in behavioral traits is maintained over time.
Tests of reversal learning are frequently used as one measure of an organism’s behavioral flexibility (Day et al. 1999; Boogert et al. 2010; Tebbich et al. 2012). Traditionally, tests of reversal learning involve simultaneously presenting an individual with two stimuli, one that is associated with a reward and one that is not. Once the individual has experienced the stimuli a predetermined number of times or until it has reached a learning criteria, then the stimulus that is rewarded is reversed. The ability to choose the newly rewarded stimulus over the previously rewarded stimulus provides a measure of how easily a learned behavior can be modified (i.e., behavioral flexibility). For example, reversal learning tasks have demonstrated that actively foraging lizards are more flexible than sit-and-wait foragers when visually discriminating the location of food resources (Day et al. 1999). As a result, actively foraging lizards are faster at responding to and finding food when resource distribution changes in the environment. Similarly, tests of reversal learning have demonstrated differences in flexibility of predatory bats to respond to changes in the associations they use to avoid lethal, toxic prey (Page and Ryan 2005).
Here, we used a reversal learning task and an ecologically relevant foraging task to test the hypothesis that behavioral flexibility is negatively correlated with foraging performance of a top fish predator, the Northern pike (Esox lucius). Specifically, we predicted that individuals that are more flexible and faster to modify a learned behavior will be less efficient foragers on live ecologically relevant prey (three-spine stickleback, Gasterosteus aculeatus). Pike exhibit consistent individual differences in foraging behavior and diet through time and across ecological contexts (Beaudoin et al. 1999; Nyqvist et al. 2012; McGhee et al. 2013). Interindividual variation in behavioral flexibility could have important consequences for pike population dynamics when faced with changes in the composition and availability of prey species (Venturelli and Tonn 2006; Bolnick et al. 2010, 2011). The ability of pike to incorporate alternative or new prey, in particular, has important implications for understanding the success of Northern pike as a non-native invasive species in ecosystems where it has been recently introduced (Patankar et al. 2006). Additionally, pikes are known to have strong top–down effects on freshwater food webs, and thus variation in predation rates (as a consequence of differences in behavioral flexibility and foraging performance) across prey species not only can affect the dynamics and composition of prey but also may have indirect effects on basal resources.
Methods
Overview of the experiments
In the reversal learning experiment, we trained Northern pike to associate a color (blue or red) with a food reward (single live goldfish) over a 15-day training period. Every day, individuals were presented with both a red and a blue cup (pike possess color vision; Jokela-Maatta et al. 2007). For half of the individuals, the blue cup contained a food reward, and for the other half of the individuals, the red cup contained the food reward. The unrewarded (i.e., incorrect) cup contained only water. Then during the following 15-day reversal testing period, we reversed the cup color that was rewarded for each individual.
To test whether discrimination between the rewarded and unrewarded cup was based on color and not the brightness of the color, we measured reflectance of the red and blue cup. Specifically, we measured reflectance using an Ocean Optics USB4000 spectrophotometer and PX-2 pulsed xenon light source. We used a bifurcated reflectance probe (R200-7) that connected to both the light source and the spectrophotometer. The probe consisted of six illumination fibers (through which the light is emitted) and one read fiber (which sends the signal back to the spectrophotometer). The reflectance probe was held at a 45-degree angle via a reflection probe holder (Ocean Optics RPH-1). To calibrate the reflectance measurements, we took a dark reading (no light entering the probe) and a bright reading. For the bright reading, we used a Spectralon white reflectance standard (Ocean Optics WS-1) with the probe held at a 45-degree angle. The data were truncated between 350 and 650 nm. We calculated the average reflectance over 2-nm steps. We took three replicate measures of each colored cup. Means and standard deviations are reported. We report brightness as the average reflectance across the 350- to 650-nm wavelength range.
In the predation experiment, a random subset of the pike in the reversal learning experiment was repeatedly measured for their ability to capture a single live three-spine stickleback, a species that Northern pike prey upon in nature. For each individual pike, we estimated their average prey capture time across multiple encounters with single sticklebacks as a measure of their foraging performance. We then related individual differences in foraging performance during the predation experiment to individual differences in behavioral flexibility during the reversal learning experiment.
Experimental animals and housing
Pikes were hatchery-reared (Spirit Lake Fish Hatchery, Iowa) and transported to the University of Illinois by car 5 weeks prior to being used in experiments. These pikes were accustomed to eating only live minnow prey. We used 18 pikes that ranged in size from 16.5 to 22.7 cm in length. Pikes were housed singly in 83.3 L tanks (107 × 33 × 24 cm) and individual pikes were tracked throughout the experiment (“pikeID”). Each pike tank had a gravel bottom, two plastic plants, two pieces of PVC on the bottom and two PVC standpipes on the back wall for prey refuge. Experiments were conducted within each pike’s home tank. Water was cleaned in all tanks via a recirculating flow-through system with particulate, biological, and UV filters (Aquaneering, San Diego, CA). Approximately 10 % of the water volume in the tanks was replaced each day. Given that learning can differ between the sexes (Voyer et al. 1995; Jonasson 2005) and can vary with brain size (Lefebvre et al. 1997; Reader and Laland 2002), sex and brain size were determined by dissection at the end of the experiments.
Pre-experiment phase
Before any experiments began, pikes were accustomed to receiving food (either a live goldfish or juvenile stickleback depending on availability, but all pikes experienced the same prey species on a single day) from white opaque cups every day for approximately 2 weeks. To reduce the chances that pike would position themselves directly below the feeding cup, we used two cups at each feeding positioned at either end of the tank (separated by ~80 cm): one cup contained a single live fish in water and the other cup contained only water. The contents of the cups were poured simultaneously into opposite ends of the tank. We followed a similar feeding protocol in both the reversal learning experiment and predation experiment (described below).
Reversal learning experiment
Color discrimination training period
During the reversal learning experiment, all pikes were presented with both a red and blue cup once per day between 12 and 1 pm. Each individual pike was randomly assigned to receive food (a single live goldfish in water) from either the red or the blue cup during the entire 15-day color discrimination training period. Pikes were not fed outside of the experiment. For half of the pike (N = 9 individuals), the rewarded cup was red during the training period. For the other half of the pike (N = 9 individuals), the rewarded cup was blue during the training period; in analyses below, “rewarded color” refers to the color of the rewarded cup. The unrewarded cup contained only water.
Both the red and blue cups were simultaneously lowered approximately 1 cm into the water, one cup at either end of the tank (separated by ~80 cm). The cups were held in the tank for a maximum of 60 s during which time the experimenter recorded how long it took the individual pike to orient (both head and eyes pointed toward the cup) toward either cup (“latency to orient”), the color of the cup to which the pike oriented, and if the pike oriented toward the unrewarded cup first, the time it took for the pike to switch from orienting to the unrewarded cup to orienting to the rewarded cup (“switch time”). We also recorded whether the pike initially oriented to the unrewarded cup on each day (“mistakes”), and whether they attacked or bit the cup (“attacks”). While improvement in latency to orient to the rewarded cup might be due to pike learning the intended color-reward association, an alternative possibility is that pike simply learned to recover from mistakes quickly (i.e., they learned to switch faster from the unrewarded cup to the rewarded cup over time). To examine this possibility, we also calculated the proportion of pike that made a mistake on each day.
As soon as the pike oriented toward the rewarded cup, the contents of the cup (goldfish + water) were poured into the tank toward the pike and both cups were removed. If the pike initially oriented to the unrewarded cup, the contents of the cup (water only) were poured into the tank toward the pike and the unrewarded cup was removed from the tank. The rewarded cup was not removed from the tank until the pike oriented to the rewarded cup or until 60-s elapsed, after which the contents of the cup (goldfish + water) were poured in the tank. Data was recorded in real-time by the observer holding the cups. The objective of this 15-day training period was to train pike to associate a particular cup color with a food reward. To ensure that pikes were not associating a particular side of the tank with a food reward, the rewarded cup was placed on alternate sides of the tank each day. The procedure was repeated daily for 15 consecutive days (“experiment day”). The order in which individual pikes were tested each day was randomized by drawing tank numbers out of a cup.
Color discrimination reversal testing period
During the reversal testing period, trials were conducted in the same way as in the training period but the rewarded cup color was reversed for each pike. In other words, individuals that had the red cup rewarded during the training period had the blue cup rewarded during the reversal testing period, and vice versa. Trials were conducted for 15 consecutive days (“experiment day”). We recorded all the same behavioral measures as in the training period (latency to orient, switch time, mistakes, and attacks). As before, the side of the tank with the rewarded cup was alternated daily, and the order in which individual pikes were tested each day was randomized.
Predation experiment
Prior to being tested in the reversal learning experiment, 12 of the 18 pikes were used in a predation experiment to examine the interaction between pike predators and juvenile three-spine stickleback prey (standard length: 30.7 ± SE 0.4 mm). Methods are described in detail in McGhee et al. (2012), but briefly, individual pike interacted with progeny of field-collected stickleback mothers. These stickleback mothers had been either exposed to a model predator or not (maternal treatment), as part of a separate study looking at maternal effects on stickleback behavior and survival. Details of the maternal treatment protocol and the results of the maternal effect on stickleback behavior and survival are discussed elsewhere (McGhee et al. 2012). Only 12 pikes were used for this foraging experiment for practical reasons. However, all 18 pikes were used in the learning experiment because we suspected that individual differences in learning would be more subtle than differences in foraging. Because individual pike interacted with a similar number of stickleback from each maternal treatment and in a random order, we ignore maternal treatment in this study and use pike averages across all stickleback prey individuals regardless of maternal treatment. Interactions where the stickleback was captured by the pike immediately upon release (<20 s) were excluded from the dataset (5 of 163 trials excluded).
Predation assays were conducted in the pikes’ tanks. We used two identical white opaque feeding cups: a decoy cup containing only water and a cup containing water and a single live stickleback. The cups were held on opposite sides of the tank (separated by ~80 cm) and the one containing the stickleback was positioned so that it was furthest from the pike. The cups were partially submerged in the water, and their contents were simultaneously poured out gently into the tank, as in the pre-experiment phase. The cups were removed and data recording began immediately. Data was recorded live by an observer using JWatcher software, which is a manual event logger (Blumstein et al. 2006; Blumstein and Daniel 2007). Trials lasted until the stickleback was successfully captured or a maximum of 10 min. Pikes in the predation experiment (N = 12) were tested once per day in a random order for 10 days. Pikes that were not used in the predation experiment (N = 6) were fed as described above with either a single live stickleback or goldfish, depending on availability.
During the trial, we recorded the time until the pike captured the stickleback (“capture time”). Unlike the goldfish in the learning experiment, the sticklebacks exhibited high levels of antipredator behavior (freezing, jerky swimming, hiding, etc.) and presented a foraging challenge for the pike. For example, while goldfish were captured in, on average, less than 22 s following introduction into the pike’s tank, sticklebacks were captured in, on average, 207 s. We calculated the average capture time over the entire predation experiment for each individual pike. We then examined whether there was an association between individual differences in the average capture time and individual differences in behavioral flexibility as assessed in the reversal learning experiment. We used these data to test the hypothesis that individual pike that quickly captured sticklebacks were behaviorally less flexible.
Data analysis
We used linear mixed models to explain variation in the latency to orient to the rewarded color, as well as the proportion of mistakes and attacks made by pike, in the training period and reversal testing period separately. Rewarded color, experiment day, and their interaction were fitted as fixed effects. Because pikes were repeatedly used, pike ID was fitted as a random effect. We used a general linear model to explain variation in the time it took pike to switch from the unrewarded to the rewarded color (switch time). Rewarded color and experiment day were fitted as fixed effects, but because not all pikes experienced the same order of rewarded colors (i.e., some experienced the blue cup as the rewarded color first, while others experienced the red cup as the rewarded color first), experiment day was nested within period (“order effect”) to account for variation due to the order in which the pike experienced each cup color as the reward. We used t-tests to compare cup colors in how often they were attacked during the training and reversal testing periods. We used one-sample t tests to compare whether the likelihood of mistakenly choosing the unrewarded cup during either the training or reversal testing period differed from chance level (50 % mistakes was our null hypothesis). t Tests were conducted in JMP®, version 9.0; the rest of the analyses in R, version 2.15.3.
For all response variables, we evaluated model assumptions by examining the residuals. Only latency to orient was log-transformed to fit normality assumptions. We explored the effect of body mass and sex on latency to orient to the rewarded color, likelihood of attacks, switch time, and average capture time. We found no significant effect of either body mass or sex on any of the four dependent variables (results not shown) and thus do not include them in the full analyses. However, we note that only five of the 18 pikes were males (i.e., 13 females), and we had limited statistical power to detect sex differences. We also explored the effect of brain mass, on latency to orient and switch time (controlling for body mass), and found no significant relationships (latency to orient: training period r = −0.17, p = 0.62; testing period r = 0.22, p = 0.39; switch time: r = 0.19, p = 0.23).
Estimating repeatability
Repeatability measures the extent to which individuals differ in behavior and if those differences in behavior are consistent over time (Lessells and Boag 1986). We calculated repeatabilities of latency to orient and switch time from the mean squares of general linear models using the protocol in Lessells and Boag (1986). Specifically, we used general linear models to examine whether pike identity accounted for a significant amount of the variation in latency to orient and switch time across the training and reversal testing periods. For latency to orient and switch time, we also accounted for mean level differences in cup color and experiment day by including both factors as fixed effects. Thus, we calculated corrected repeatability estimates following Nakagawa and Schielzeth (2010). Standard errors and 95 % confidence intervals were estimated as in Becker (1992) and Nakagawa and Schielzeth (2010).
Ethical note
Allowing predators to interact freely with their prey was essential to quantify normal predatory and antipredator behavior; however, we provided numerous refuges in the pikes’ tanks in order to give stickleback an opportunity to hide or escape from the pike. Additionally, pike would only eat live prey (i.e., would not consume a dead animal or invertebrate when added to the tank; LMP and KEM, personal observation, but see Milinski et al. 1997). These particular pikes were used in several different experiments (e.g., McGhee et al. 2012, 2013), and this study was simply a modification of the daily feeding protocol required to maintain the pike in the laboratory. Thus, no additional fish were used as prey other than the single fish the pike received as part of their daily feeding regime. Each individual pike ate approximately 25 goldfish and 18 stickleback between the pre-experiment and experiment phase of the study. For the original maternal effects study (McGhee et al. 2012), we used power analyses based on a previous study (Giesing et al. 2011) to minimize the number of sticklebacks used [Animal Behavior Society/Association for the Study of Animal Behavior (ABS/ASAB) guidelines 2004–2007; ABS/ASAB 2003]. This experiment and the use of live prey was in accordance with university and US rules and approved by the Animal Care and Use Committee of University of Illinois (protocol #09204).
Results
Reflectance of red and blue experimental cups
The blue cup (lambda max. ~ 442 nm) and red cup (lambda max. ~ 648 nm) differed greatly with respect to color. The cups differed in brightness (assessed as the average reflectance between 350 and 650 nm) as well, with the blue cup being brighter (average reflectance ± SD = 20.3 ± 1.47) than the red cup (average reflectance = 7.9 ± 0.44), under standardized lighting conditions and in isolation of the perceptual abilities of the pike predator. Maximal percent reflectance did not differ between the cups (blue = 56.69, red = 58.04).
Reversal learning experiment
Latency to orient to the rewarded color
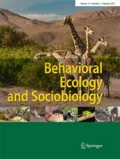
During the training period, pike became significantly faster at orienting to the rewarded cup through time (Table 1, Fig. 1). Pike that received the food reward from the red cup tended to orient faster than pike that experienced blue as the rewarded color, although the difference was not statistically significant (Table 1, average ± SE; latency to orient: rewarded red cup: day 1 = 43.2 ± 8.7 s, day 15 = 16.33 ± 8.5 s; rewarded blue cup: day 1 = 48.1 ± 7.9 s, day 15 = 33.7 ± 6.8 s). There was not a significant interaction between the rewarded color and experiment day (Table 1).

The average latency to orient to the rewarded color over the 15-day training period and 15-day reversal testing period. Shown are averages ± SE. Color of the bars stated in the legend represents the color of the rewarded cup. The dotted line indicates when the color of the rewarded cup was switched for an individual pike (i.e., pike receiving a reward from the blue cup during the training period received its reward from the red cup in the reversal testing period)
During the reversal testing period, pike became significantly faster at orienting to the rewarded color (Table 1, Fig. 1), but only when the blue cup was rewarded (latency to orient to rewarded blue cup: day 16 = 41.0 ± 7.9 s; day 30 = 25.0 ± 8.8 s). Pike whose reward came from the red cup did not decrease their latency to orient to the rewarded cup over time (Table 1, latency to orient to rewarded red cup: day 16 = 8.3 ± 5.0 s; day 30 = 17.0 ± 8.3 s). However, the interaction between the rewarded color and experiment day was not statistically significant.
Although all pikes tended to improve in their latency to orient to the rewarded color through time, there was a significant effect of pike identity on latency to orient to the rewarded cup (general linear model, pike identity: F 17,539 = 5.65, p < 0.0001). Thus, some individual pikes consistently oriented to the rewarded color faster than others: the repeatability of the latency to orient to the rewarded color over the training and reversal testing periods combined was 0.12 ± SE 0.05; upper 95 % CI = 0.23, lower 95 % CI = 0.04.
Mistakes
During the training period, pike made significantly fewer mistakes overall when the red cup was rewarded (Table 2, Fig. 2). Pike made fewer mistakes as the training period progressed regardless of the rewarded color (i.e., there was a significant effect of experiment day). There was no significant interaction between the rewarded color and experiment day (Table 2). During the reversal testing period, pike whose reward came from the red cup made significantly fewer mistakes than those whose reward came from the blue cup (Table 2, Fig. 2). Overall, there was no significant improvement through time in the number of mistakes for either rewarded color during the reversal testing period (Table 2). There was no significant interaction between the rewarded color and experiment day (Table 2).

The average proportion of mistakes (i.e., the pike oriented toward the unrewarded cup first) over the 15-day training period and 15-day reversal testing period. Details are as in Fig. 1
If pikes were learning the color-reward association, the proportion of mistakes should decrease over time as pike learned to orient to the rewarded cup first. Alternatively, if pikes were learning to switch from an unrewarded cup (rather than to avoid the unrewarded cup altogether), the proportion of mistakes should not decrease over time, and instead remain fairly constant. During the training period, only pike whose reward came from the red cup made fewer mistakes than predicted by chance [i.e., chose the unrewarded cup less than 50 % of the time; mean proportion of mistakes on unrewarded blue = 0.33 ± 0.03; one sample t test: t = −2.17, p (<0.50) = 0.03, p (>0.50) = 0.96, N = 9; Fig. 2]. Pikes whose reward came from the blue cup, however, made more mistakes than predicted by chance and chose the unrewarded red cup 83 % of the time over the 15 days of the training period [mean proportion of mistakes on unrewarded red = 0.83 ± 0.04; one sample t test: t = 5.60, p (<0.50) = 0.99, p (>0.50) < 0.001, N = 9]. Finally, during the reversal testing period, pike made fewer mistakes than expected by chance, but again, only if the rewarded cup was red [mean proportion of mistakes on unrewarded blue = 0.32 ± 0.04; one sample t test: t = −2.69, p (<0.5) = 0.014, p (>0.5) = 0.98, N = 9; Fig. 2]. Pike whose reward came from the blue cup continued to first orient toward the unrewarded red cup 76 % of the time over the 15 days of the reversal testing period [mean proportion of mistakes on unrewarded red = 0.76 ± 0.04; one sample t test: t = 6.64, p (<0.50) = 0.99, p (>0.50) < 0.001, N = 9].
Attacks on red color cup
Not only were pikes more likely to orient toward the red cup than the blue cup, but they were also more likely to aggressively approach and attack or bite it. During the training period, pike attacked or bit the red cup a total of 56 times, whereas they attacked or bit the blue cup eight times (difference between cup colors in number of attacks over the 15 days: t = 3.33, p = 0.003, N = 18). Similarly, during the reversal testing period, pike attacked or bit the red cup 125 times, whereas they attacked or bit the blue cup 18 times (difference between cup colors in number of attacks over the 15 days: t = 11.19, p < 0.001, N = 18). This pattern is consistent with a bias for the color red. During the training period, pike significantly increased their attacks of the red cup over time regardless of which color was rewarded, i.e., pike whose reward came from the blue cup attacked the red cup just as often as pike whose reward came from the red cup (Table 3, Fig. 3).

The average proportion of pike that attacked or bit the red cup over the 15-day training period and 15-day reversal testing period. Details are as in Fig. 1
During the reversal testing period, there was no significant effect of the color of the rewarded cup, experiment day, or their interaction on whether pike attacked the red cup (Table 3). Pikes were equally likely to attack the red cup regardless of the color of the rewarded cup (Fig. 3).
Behavioral flexibility (switch time)
We had initially thought that an appropriate measure of behavioral flexibility would be simply the time it took a pike to switch from the unrewarded to rewarded cup regardless of the color that was rewarded during the reversal testing period. However, our finding that pikes have an overall bias for orienting toward and attacking red suggested that learning to switch from the unrewarded cup to the rewarded cup was particularly challenging and largely occurred only when the blue cup was rewarded (and the red cup was unrewarded). For example, each pike, on average, first chose the unrewarded red cup ten out of 15 times when the blue cup was rewarded (range = 4–13). This is in contrast to when the red cup was rewarded and pike only chose the unrewarded blue cup three out of 15 times, on average (range = 0–7).
All pikes improved in their ability to overcome their bias for red and over time, they became increasingly better at switching from the unrewarded red cup to the rewarded blue cup quickly [testing and training period together: Pearson’s r = −0.492, p = 0.006; testing period: r = −0.42, p = 0.12; training period: r = −0.56, p = 0.03; switch time: day 1 = 39.5 ± 6.2 s, day 15 = 25.0 ± 5.1 s, Table 4, Fig. 4]. It is important to note here that half of the pike had the blue cup rewarded in the training period and half of the pike had the blue cup rewarded in the reversal testing period. However, whether the blue cup was rewarded during the training period or during the reversal testing period did not affect switch time and there was no significant order effect (Table 4, Fig. 4). Additionally, it should be noted that after pike attacked the unrewarded red cup, they almost immediately switched to the rewarded blue cup (i.e., they switched before the contents of the unrewarded red cup were emptied into the tank and thus before they saw it was unrewarded).

The average amount of time it took pike to switch from the unrewarded red cup (for which they have a bias) to the rewarded blue cup (“switch time”) significantly decreased over time in both the training and reversal testing periods. Lines indicate best fit line
Although all pikes improved in their ability to switch from the unrewarded red cup (for which they all have a bias) to the rewarded blue cup, there was a significant effect of pike identity on switch time (general linear model, pike identity: F 17,234 = 3.31, p < 0.0001). Thus, some individuals consistently switched faster from the unrewarded red cup to the rewarded blue cup than others, although the repeatability of switch time was low (0.18 ± SE 0.08; upper 95 % CI = 0.34, lower 95 % CI = 0.03).
Predation experiment
There were clear differences among individual pike in the average time it took to capture live stickleback prey. For example, some individual pikes captured sticklebacks in 67.5 s, on average, across all their prey, while others took as long as 365.6 s, on average, across all their prey. We found a significant negative correlation between a pike’s average switch time and the average capture time of stickleback prey (r p = −0.60, p = 0.042, N = 12; Fig. 5). In other words, pikes that were able to overcome their bias for red and were fast to switch from the unrewarded red cup to the rewarded blue cup in the reversal learning experiment were slower at capturing live stickleback prey in the predation experiment.

The average switch time when blue was rewarded in the reversal learning experiment was negatively correlated with the average speed at which that individual could capture live stickleback prey in the predation experiment. The line indicates best fit line
Discussion
Pike improved over time in their latency to orient to the rewarded cup in both the training period and the reversal testing period. However, our results suggest that the improvement did not arise from individuals simply learning to associate a particular color with a reward. Instead, pike learned the reward association in two steps, the first of which was influenced by an underlying bias. Specifically, pike learned to (1) orient toward and attack red first and then (2) switch to the blue cup immediately if blue was rewarded. That a bias for red affected the learned association is supported by our findings that pike did not learn to avoid red even when it was unrewarded (i.e., 80 % of pike continued to choose and attack incorrectly) and instead continued to increasingly attack the red cup over the course of the experiment, i.e., pike incorporated attacking the red cup into their feeding behavior. Thus, the improvement in latency to orient to the rewarded blue cup was a result of pike learning and improving upon their ability to overcome the red color bias quickly and switch from the unrewarded red cup to the rewarded blue cup after first attacking the red cup. It is likely that pike did not learn to avoid or not attack the unrewarded red cup because there was no consequence for the mistake, as long as they switched to the rewarded blue cup. Thus, although pike did not learn the intended color-food reward association, we suggest they did indeed exhibit learning. Pike learned that to receive a food reward when the blue was the rewarded cup, they had to switch from the unrewarded red cup to the rewarded blue cup within 60 s, otherwise they would receive no reward at all.
Additionally, there were consistent differences among individuals, whereby pike differed in how long it took them to overcome their red bias and turn away from the unrewarded red cup in order to orient toward the rewarded blue cup (i.e., some switched faster from the unrewarded red cup to the rewarded blue cup than others). Admittedly, repeatability of this behavior was low relative to the average repeatability found in other studies (average r = 0.37, Bell et al. 2009). Still, we suggest that although pike did not learn the reverse of a previously learned reward contingency (i.e., the standard reversal-learning paradigm), they did demonstrate learning, and hence flexibility. Rather, they learned to overcome their inherent bias toward red to receive the food reward from the blue cup. We suggest that this represents a measure of an individual’s behavioral flexibility. Overcoming a pre-experiment bias, such as for a particular color, has been used in other studies as evidence of learning and learning flexibility (Danisman et al. 2010; Miller and Pawlik 2013). Therefore, in this experiment, we interpret the ability of pike to switch from the rewarded red cup (for which they have a bias) to the rewarded blue cup as behavioral flexibility and this flexibility was captured by our measure of “switch time.” Switch time for each pike measured how quickly an individual switched to the blue rewarded cup in trials where they chose the unrewarded red cup first and was averaged across all trials. Behaviorally flexible pike that were easily able to overcome their red bias made the switch from red to blue quickly (i.e., had smaller switch times) compared to pike that were less flexible and had difficulty overcoming their red bias (i.e., had larger switch times).
While pikes showed consistent intraspecific behavioral variation in the learning assay, they all showed a very strong bias toward the color red. The reflectance data on the cups suggests that this is a bias for the color red rather than a bias for the brightest cup (which was blue). This suggests that pike may have a general search image for the color red. Other fish species, including cichlids, sticklebacks, and guppies, have all shown a preference for red or yellow (i.e., carotenoid pigments) in the foraging context as well as the mating context (Reznick and Endler 1982; Smith et al. 2004; Hurtado-Gonzales et al. 2010). Since there is little sexual dimorphism in pike and none at all in coloration (Becker 1983; Casselman 1996; Crossman 1996), it is unlikely that the bias for red, we observed, is related to mate choice. Instead, it seems more likely that the red-bias is related to diet. Carotenoids cannot be synthesized by animals and must be obtained in the diet. Important functions, such as immune response, water balance, growth, and cell differentiation, all require carotenoids (Olsen and Owens 1998). Young-of-the-year pike forage heavily on carotenoid-pigmented copepods (i.e., plankton) and their foraging success has been shown to be dependent on prey pigmentation relative to the visual conditions in the water (Jonsson et al. 2011). Furthermore, foraging success in this planktivorous stage has been shown to be directly related to growth and success into piscivory (Bry 1996). Thus, a bias for red in adult pike may be associated with a requirement in the diet for carotenoids in juveniles.
Consistent with our predictions, these individual differences in behavioral flexibility were negatively associated with the average time it took to capture an ecologically relevant prey. From previous work, we know that individual pike show consistent differences in their foraging performance on stickleback (McGhee et al. 2013). Thus, our data provide support for the hypothesis that there is a negative correlation between behavioral flexibility and foraging performance and suggest that individuals cannot be both flexible and efficient foragers at the same time.
The inability of pike to be both flexible in terms of learning and efficient foragers on challenging prey suggests that there may be a trade-off between the two behaviors, similar to trade-offs that have been documented in the literature on coping styles (Verbeek et al. 1994; Koolhaas et al. 1999; Bolhuis et al. 2004) and speed accuracy trade-offs (Chittka et al. 2003, 2009; Burns and Dyer 2008; Burns and Rodd 2008). In other words, evolutionarily, fitness benefits associated with flexibility in foraging may come at the expense of fitness benefits associated with efficiency at capturing a particular prey type. Trade-offs between these behaviors might be generated by a variety of mechanisms. For example, individual variation in pike foraging flexibility might be associated with differences in diet specialization, such that specialists are less flexible but more efficient foragers on fewer prey types than generalists (MacArthur and Levin 1967; Levin 1968; Wilson and Yoshimura 1994), Alternatively, there may be limits to memory and learning (Healy 1992; Bélisle and Cresswell 1997) that prevent flexible individuals from mastering the skills required to efficiently forage on all prey types. This might be particularly true if skills for one prey type cannot be transferred easily to another. For example, flexible individuals may be better able to adjust to novel or fluctuating food resources, but their performance on new or alternative prey types may be hindered if all prey are dissimilar, i.e., skills from one species are nontransferable to another (Hazlett 1995; Hughes and O’Brien 2001). Thus, trade-offs may occur directly between behaviors or arise as a consequence of other traits (i.e., cross-correlation between flexibility, fast/efficient foraging, and memory capabilities).
In addition, our results suggest that there can be substantial variation among individuals within a population in both their behavioral flexibility and foraging performance. The variation in behavioral flexibility and foraging performance observed here might be maintained by multiple factors. For example, variation likely depends on the relative costs of each behavior/trait, which is often determined by the complexity or variability of the environment. For behaviors involved in foraging, flexibility is often beneficial when prey resources are highly variable and relatively unpredictable (Reader and MacDonald 2003). Alternatively, prey abundance or relative abundance might influence the relative benefits of different foraging behaviors. Following optimal foraging theory, when preys are scarce, predators should accept all prey types (Stephens and Krebs 1986). Whereas when preys are abundant, predators should ignore preys that are suboptimal and only accept the most profitable prey. If predators select only a few prey types while preys are abundant, they may become more specialized in terms of the traits that allow them to exploit these resources most efficiently. Thus, variation in pike-foraging behaviors might be maintained because there are contexts where behavioral flexibility might be favored over efficiency and vice versa.
Variation in behavioral flexibility and foraging performance likely has numerous ecological consequences and can play an important role in responding to anthropogenic changes in the environment (Sih et al. 2011; Sih 2013). For example, it is possible that behaviorally flexible foragers may be more exposed to predators than those who are less flexible foragers due to their willingness to enter unfamiliar environments to search for prey. Or perhaps because of the trade-off between flexibility and foraging, flexible foragers are slower and less efficient at locating and subduing prey, leaving them vulnerable to predation themselves for a longer period of time. In any case, the relative frequency of these behavioral traits in the population might change the influence/strength of predation pressure on predator and prey population dynamics. Additionally, behavioral flexibility has been shown to be associated with the ability to exploit a wide variety of resources (food and habitat; Wright et al. 2010, but see Overington et al. 2011). If flexibility in pike-foraging behavior is associated with diet breadth, then variation in flexibility may change the strength of intraspecific or interspecific competition (i.e., reduce the amount of dietary overlap among individuals). Indeed, there is increasing evidence that intraspecific trait variation affects the outcome of interspecific interactions (Pruitt et al. 2012a, b; McGhee et al. 2013). For example, the relative abundance of aggressive or docile spider individuals in a population shifted the outcome of interspecific interactions from an ammensalism to a commensalism or mutualism (Pruitt et al. 2012a). Finally, variation in foraging performance may be related to differences in diet and prey choice, particularly, if some species are easier to capture than others (Sih et al. 2012). This might reduce predation pressure on a single prey species, promoting increased diversity in the prey community. It is important to note, however, that while there is strong potential for intraspecific trait variation to affect population and community-level dynamics, these dynamics can conversely influence the generation or maintenance of individual-level variation (Sih et al. 2004).
Our results demonstrate a trade-off between behavioral flexibility and foraging performance of Northern pike. Furthermore, pike showed consistent individual differences in these two traits whereby some individuals were more flexible, but performed poorly when encountering ecologically challenging prey, and others were less flexible but more successful predators. This within-population variation in behavior of Northern pike might contribute to its successful range expansions across variable environments and the large top-down effects it frequently has on freshwater food webs. An important future challenge will be to simultaneously evaluate how behavioral flexibility of both predators and prey influence population dynamics and responses to anthropogenic change.
References
ABS/ASAB (2003) Guidelines for the treatment of animals in behavioral research and teaching. Anim Behav 65:249–255
Beaudoin CP, Tonn WM, Prepas EE, Wassenaar LI (1999) Individual specialization and trophic adaptability of northern pike (Esox lucius): an isotope and dietary analysis. Oecologia 120:386–396
Becker GC (1983) Fishes of Wisconsin. University of Wisconsin Press, Madison, WI
Becker WC (1992) Manual of quantitative genetics. Academic Enterprises, Pullman, WA
Bélisle C, Cresswell J (1997) The effects of a limited memory capacity on foraging behavior. Theor Popul Biol 52:78–90
Bell AM, Hankison SJ, Laskowski KL (2009) The repeatability of behaviour: a meta-analysis. Anim Behav 77:771–783
Blumroeder J, Eccard JA, Blaum N (2012) Behavioural flexibility in foraging mode of the spotted sand lizard (Pedioplanis l. lineoocellata) seems to buffer negative impacts of savanna degradation. J Arid Environ 77:149–152
Blumstein DT, Daniel JC (2007) Quantifying behavior the JWatcher way. Sinauer, Sunderland, MA
Blumstein DT, Daniel JC, Evans CS (2006) JWatcher 1.0. http://www.jwatcher.ucla.edu/
Bolhuis JE, Schouten WGP, de Leeuw JA, Schrama JW, Wiegant VA (2004) Individual coping characteristics, rearing conditions and behavioural flexibility in pigs. Behav Brain Res 152:351–360
Bolnick DI, Ingram T, Stutz WE, Snowberg LK, Lau OL, Paull JS (2010) Ecological release from interspecific competition leads to decoupled changes in population and individual niche width. Proc R Soc Lond B 277:1789–1797
Bolnick DI, Amarasekare P, Araujo MS, Burger R, Levine JM, Novak M, Rudolf VHW, Schreiber SJ, Urban MC, Vasseur DA (2011) Why intraspecific trait variation matters in community ecology. Trends Ecol Evol 26:183–192
Boogert NJ, Reader SM, Laland KN (2006) The relation between social rank, neophobia and individual learning in starlings. Anim Behav 72:1229–1239
Boogert NJ, Monceau K, Lefebvre L (2010) A field test of behavioural flexibility in Zenaida doves (Zenaida aurita). Behav Process 85:135–141
Bry C (1996) Role of vegetation in the life cycle of pike. Fish Fish 19:45–67
Burns JG, Dyer AG (2008) Diversity of speed-accuracy strategies benefits social insects. Curr Biol 18:R953–R954
Burns JG, Rodd FH (2008) Hastiness, brain size and predation regime affect the performance of wild guppies in a spatial memory task. Anim Behav 76:911–922
Casselman JM (1996) Age, growth and environmental requirements of pike. In: Craig JF (ed) Pike: biology and exploitation. Chapman & Hall, London, pp 69–101
Chittka L, Dyer AG, Bock F, Dornhaus A (2003) Psychophysics — bees trade off foraging speed for accuracy. Nature 424:388
Chittka L, Skorupski P, Raine NE (2009) Speed-accuracy tradeoffs in animal decision making. Trends Ecol Evol 24:400–407
Coppens CM, de Boer SF, Koolhaas JM (2010) Coping styles and behavioural flexibility: towards underlying mechanisms. Philos Trans R Soc B 365:4021–4028
Crossman EJ (1996) Taxonomy and distribution. In: Craig JF (ed) Pike: biology and exploitation. Chapman & Hall, London, pp 1–11
Dally JM, Clayton NS, Emry NJ (2008) Social influences of foraging by rooks (Corvus frugilegus). Behaviour 145:1101–1124
Danisman E, Bshary R, Bergmuller R (2010) Do cleaner fish learn to feed against their preference in a reverse reward contingency task? Anim Cogn 13:41–49
Day LB, Crews D, Wilczynski W (1999) Spatial and reversal learning in congeneric lizards with different foraging strategies. Anim Behav 57:393–407
Giesing ER, Suski CD, Warner RE, Bell AM (2011) Female sticklebacks transfer information via eggs: effects of maternal experience with predators on offspring. Proc R Soc Lond B 278:1753–1759
Hazlett BA (1995) Behavioral plasticity in crustacea: why not more? J Exp Mar Bio Ecol 193:57–66
Healy S (1992) Optimal memory: toward an evolutionary ecology of animal cognition? Trends Ecol Evol 7:399–400
Hughes RN, O’Brien N (2001) Shore crabs are able to transfer learned handling skills to novel prey. Anim Behav 61:711–714
Hurtado-Gonzales JL, Baldassarre DT, Uy JAC (2010) Interaction between female mating preferences and predation may explain the maintenance of rare males in the pentamorphic fish Poecilia parae. J Evol Biol 23:1293–1301
JMP®, version 9.0. SAS Institute Inc., Cary, NC, 1989–2007
Jokela-Maatta M, Smura T, Aaltonen A, Ala-Laurila P, Donner K (2007) Visual pigments of Baltic Sea fishes of marine and limnic origin. Visual Neurosci 24:389–398
Jonasson Z (2005) Meta-analysis of sex differences in rodent models of learning and memory: a review of behavioral and biological data. Neurosci Biobehav R 28:811–825
Jonsson M, Hylander S, Ranaker L, Nilsson PA, Bronmark C (2011) Foraging success of juvenile pike Esox lucius depends on visual conditions and prey pigmentation. J Fish Biol 79:290–297
Koolhaas JM, Korte SM, de Boer SF, van der Vegt BJ, van Reenen CG, Hopster H, de Jong IC, Ruis MAW, Blokhuis HJ (1999) Coping styles in animals: current status in behavior and stress-physiology. Neurosci Biobehav R 23:925–935
Laland KN, Reader SM (1999a) Foraging innovation in the guppy. Anim Behav 57:331–340
Laland KN, Reader SM (1999b) Foraging innovation is inversely related to competitive ability in male but not in female guppies. Behav Ecol 10:270–274
Lefebvre L, Whittle P, Lascaris E, Finkelstein A (1997) Feeding innovations and forebrain size in birds. Anim Behav 53:549–560
Lessells CM, Boag PT (1986) Unrepeatable repeatabilities: a common mistake. Auk 104:116–121
Levin R (1968) Evolution in changing environments. Princeton University Press, Princeton, NJ
MacArthur RH, Levin R (1967) The limiting similarity, convergence, and divergence of coexisting species. Am Nat 101:377–385
McGhee KE, Pintor LM, Surh EL, Bell AM (2012) Maternal exposure to predation risk decreases offspring antipredator behaviour and survival in threespined stickleback. Funct Ecol 26:932–940
McGhee KE, Pintor LM, Bell AM (2013) Reciprocal behavioral plasticity and behavioral types during predator–prey interactions. Am Nat 182:704–717
Milinski M, Lühti JH, Eggler R, Parker GA (1997) Cooperation under predation risk: experiments on costs and benefits. Proc R Soc Lond B 264:1239–1247
Miller AM, Pawlik JR (2013) Do coral reef fish learn to avoid unpalatable prey using visual cues? Anim Behav 85:339–347
Nakagawa S, Schielzeth H (2010) Repeatability for Gaussian and non-Gaussian data: a practical guide for biologists. Biol Rev 85:935–956
Nyqvist MJ, Gozlan RE, Cucherousset J, Britton JR (2012) Behavioural syndrome in a solitary predator is independent of body size and growth rate. PLoS ONE 7:e31619
Olsen VA, Owens IPF (1998) Costly sexual signals: are carotenoids rare, risky or required? Trends Ecol Evol 13:510–514
Overington SE, Griffin AS, Sol D, Lefebvre L (2011) Are innovative species ecological generalists? A test in North American birds. Behav Ecol 22:1286–1293
Page RA, Ryan MJ (2005) Flexibility in assessment of prey cues: frog-eating bats and frog calls. Proc R Soc Lond B 272:841–847
Patankar R, von Hippel FA, Bell MA (2006) Extinction of a weakly armoured threespine stickleback (Gasterosteus aculeatus) population in Prator Lake, Alaska. Ecol Freshw Fish 15:482–487
Pruitt JN, Cote J, Ferrari MCO (2012a) Behavioural trait variants in a habitat-forming species dictate the nature of its interactions with and among heterospecifics. Funct Ecol 26:29–36
Pruitt JN, Stachowicz JJ, Sih A (2012b) Behavioral types of predator and prey jointly determine prey survival: potential implications for the maintenance of within-species behavioral variation. Am Nat 179:217–227
Reader SM, Laland KN (2002) Social intelligence, innovation, and enhanced brain size in primates. Proc Natl Acad Sci U S A 99:4436–4441
Reader SM, MacDonald K (2003) Environmental variability and primate behavioural flexibility. In: Reader SM, Lanland KN (eds) Animal innovation. Oxford University Press, Oxford, pp 83–116
Reznick DN, Endler JA (1982) The impact of predation on life history evolution in Trindadian guppies (Poecilia reticulata). Evol 36:160–177
Ruiz-Gomez MD, Huntingford FA, Overli O, Thornqvist PO, Hoglund E (2011) Response to environmental change in rainbow trout selected for divergent stress coping styles. Physiol Behav 102:317–322
Sergio F, Blas J, Lopez L, Tanferna A, Diaz-Delgado R, Donazar JA, Hiraldo F (2011) Coping with uncertainty: breeding adjustments to an unpredictable environment in an opportunistic raptor. Oecologia 166:79–90
Sih A (2013) Understanding variation in behavioural responses to human-induced rapid environmental change: a conceptual overview. Anim Behav 85:1077–1088
Sih A, Bell A, Johnson JC (2004) Behavioral syndromes: an ecological and evolutionary overview. Trends Ecol Evol 19:372–378
Sih A, Ferrari MCO, Harris DJ (2011) Evolution and behavioural responses to human-induced rapid environmental change. Evol Appl 4:367–387
Sih A, Cote J, Evans M, Fogarty S, Pruitt J (2012) Ecological implications of behavioural syndromes. Ecol Lett 15:278–289
Smith C, Barber I, Wootton RJ, Chittka L (2004) A receiver bias in the origin of three-spined stickleback mate choice. Proc R Soc Lond B 271:949–955
Sol D, Lefebvre L (2000) Behavioural flexibility predicts invasion success in birds introduced to New Zealand. Oikos 90:599–605
Sol D, Timmermans S, Lefebvre L (2002) Behavioural flexibility and invasion success in birds. Anim Behav 63:495–502
Stephens DW, Krebs JR (1986) Foraging theory. Princeton University Press, New Jersey
Tanner CJ, Salalt GD, Jackson AL (2011) Feeding and non-feeding aggression can be induced in invasive shore crabs by altering food distribution. Behav Ecol Sociobiol 65:249–256
Tebbich S, Stankewitz S, Teschke I (2012) The relationship between foraging, learning abilities and neophobia in two species of Darwin’s finches. Ethology 118:135–146
Timmermans S, Lefebvre L, Boire D, Basu P (2000) Relative size of the hyperstriatum ventrale is the best predictor of feeding innovation rate in birds. Brain Behav Evol 56:196–203
Venturelli PA, Tonn WM (2006) Diet and growth of northern pike in the absence of prey fishes: initial consequences for persisting in disturbance-prone lakes. Trans Am Fish Soc 135:1512–1522
Verbeek MEM, Drent PJ, Wiepkema PR (1994) Consistent individual-differences in early exploratory behavior of male great tits. Anim Behav 48:1113–1121
Voyer D, Voyer S, Bryden MP (1995) Magnitude of sex differences in spatial abilities: a meta-analysis and consideration of critical variables. Psychol Bull 117:250–270
Wilson DS, Yoshimura J (1994) On the coexistence of specialists and generalists. Am Nat 144:692–707
Wright TF, Eberhard JR, Hobson EA, Avery ML, Russello MA (2010) Behavioral flexibility and species invasions: the adaptive flexibility hypothesis. Ethol Ecol Evol 22:393–404
Acknowledgments
We thank Becky Fuller for collection, analysis, and interpretation of reflection data. We also thank Suzanne Gray for interpretation and discussion of reflection data. We thank the Spirit Lake Fish Hatchery (Iowa) for providing the pike, the Jake Wolf Fish Hatchery (Illinois) for holding the pike, and B. Mommer and M. Schrader for help transporting the pike. We thank E. Suhr for help with fish care. KEM was supported by an NIH/NICHD fellowship (T32 HD007333) and an NSF grant to AMB and KEM (IOS 1121980). LMP was supported by University of Illinois start-up funds to AMB and The Ohio State University's, Ohio Agriculture Research and Development Center.
Ethical Standards
Experiments conducted as part of this paper were conducted in the USA and comply with the current laws in the USA and approved by the Animal Care and Use Committee of University of Illinois (protocol #09204).
Author information
Authors and Affiliations
Corresponding author
Additional information
Communicated by K. Lindström
Rights and permissions
About this article

Cite this article
Pintor, L.M., McGhee, K.E., Roche, D.P. et al. Individual variation in foraging behavior reveals a trade-off between flexibility and performance of a top predator. Behav Ecol Sociobiol 68, 1711–1722 (2014). https://doi.org/10.1007/s00265-014-1779-7
Received:
Revised:
Accepted:
Published:
Issue Date:
DOI: https://doi.org/10.1007/s00265-014-1779-7