Abstract
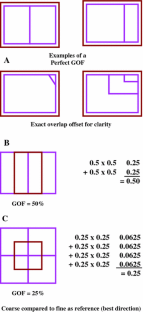
We present Mapcurves, a quantitative goodness-of-fit (GOF) method that unambiguously shows the degree of spatial concordance between two or more categorical maps. Mapcurves graphically and quantitatively evaluate the degree of fit among any number of maps and quantify a GOF for each polygon, as well as the entire map. The Mapcurve method indicates a perfect fit even if all polygons in one map are comprised of unique sets of the polygons in another map, if the coincidence among map categories is absolute. It is not necessary to interpret (or even know) legend descriptors for the categories in the maps to be compared, since the degree of fit in the spatial overlay alone forms the basis for the comparison. This feature makes Mapcurves ideal for comparing maps derived from remotely sensed images. A translation table is provided for the categories in each map as an output. Since the comparison is category-based rather than cell-based, the GOF is resolution-independent. Mapcurves can be applied either to entire map categories or to individual raster patches or vector polygons. Mapcurves also have applications for quantifying the spatial uncertainty of particular map features.


References
Costanza R (1989) Model goodness of fit: a multiple resolution procedure. Ecol Modell 47:199–215
Foody GM (2002) Status of land cover classification accuracy assessment. Remote Sensing Environ 80:185–201
Hagen A (2003) Fuzzy set approach to assessing similarity of categorical maps. Int J Geogr Inf Sci 17(3):235–249
Hargrove WW, Hoffman FM (1999) Using multivariate clustering to characterize ecoregion borders. Comput Sci Eng 1(4):18–25
Hargrove WW, Hoffman FM (2003) An analytical assessment tool for predicting changes in a species distribution map following changes in environmental conditions. In: Proceedings, GIS/EM4 conference, Banff, Alberta, Canada, Sept. 2–8, 2000. CD-ROM, ISBN: 0-9743307-0-1
Hargrove WW, Hoffman FM (2004a) The potential of multivariate quantitative methods for delineation and visualization of ecoregions. Environ Manage 34(5):S39–S60
Hargrove WW, Hoffman FM (2004b) A flux atlas for representativeness and statistical extrapolation of the AmeriFlux Network. ORNL Technical Memorandum ORNL/TM–2004/112. Available at http://www.geobabble.ornl.gov/flux-ecoregions
Hargrove WW, Hoffman FM, Schwartz PM (2002) A fractal landscape realizer for generating synthetic maps. Conserv Ecol 6(1):2. [online]: http://www.consecol.org/vol6/iss1/art2
Hargrove WW, Hoffman FM, Law BE (2003) New analysis reveals representativeness of the AmeriFlux network. Eos 84(48):529–535
Hartigan JA (1975) Clustering algorithms. Wiley, New York
Hoffman FM, Hargrove WW, Erickson DJ III, Oglesby R (2005) Using clustered climate regimes to analyze and compare predictions from fully coupled general circulation models. Earth Interact (in press)
Jager HI, King AW, Schumaker NH, Ashwood TL, Jackson BL (2005) Spatial uncertainty analysis of population models. Ecol Modell (in press)
Kuchler AW (1964) Potential natural vegetation of the conterminous United States, American Geographical Society, Special Publication No. 36
Kuchler AW (1993) Potential natural vegetation of the conterminous United States. Digital vector data in an Albers Equal Area Conic polygon network and derived raster data on a 5 km2 Albers Equal Area 590× 940 grid. In: Global Ecosystems Database Version 2.0. Boulder CO: NOAA National Geophysical Data Center
Lantz CA, Nebenzahl E (1996) Behavior and interpretation of the K statistic: resolution of two paradoxes. J Clin Epidemiol 49(4):431–434
Maclure M, Willet WC (1987) Misinterpretation and misuse of the kappa statistic. Am J Epidemiol 126(2):161–169
Maxwell WE (1977) Coefficients of agreement between observers and their interpretation. Br J Psychiatry 130:79–83
Metternicht G (1999) Change detection assessment using fuzzy sets and remotely sensed data: an application of topographic map revision. ISPRS J Photogram Remote Sensing 54(4):221–233
Monserud RA, Leemans R (1992) Comparing global vegetation maps with the Kappa statistic. Ecol Modell 62:275–293
Plotnick RE, Gardner RH, Hargrove WW, Prestegaard K, Perlmutter M (1996) Lacunarity analysis: a general technique for the analysis of spatial patterns. Phys Rev E 53(5):5461–5468
Pontius RG Jr (2000) Quantification error versus location error in comparison of categorical maps. Photogram Eng Remote Sensing 66(8):1011–1016
Pontius RG Jr (2002) Statistical methods to partition effects of quantity and location during comparison of categorical maps at multiple resolutions. Photogram Eng Remote Sensing 68(10):1041–1049
Pontius RG Jr, Schneider LC (2001) Land-cover change model validation by an ROC method for the Ipswich watershed, Massachusetts, USA. Agric Ecosyst Environ 85(1–3):239–248
Power C, Simms A, White R (2001) Hierarchical fuzzy pattern matching for the regional comparison of land use maps. Int J Geogr Inf Sci 15(1):77–100
Saxon E, Baker B, Hargrove WW, Hoffman FM, Zganjar C (2005) Mapping environments at risk under different global climate change scenarios. Ecol Lett 8:53–60
Turner MG, Costanza R, Sklar FH (1989) Methods to evaluate the performance of spatial simulation models. Ecol Modell 48:1–18
White MA, Hoffman FM, Hargrove WW, Nemani RR (2005) A global framework for monitoring phenological responses to climate change. Geophys Res Lett 32(4):L04705 Doi:1029/2004GL021961
Winter S (2000) Location similarity of regions. ISPRS J Photogram Remote Sensing 55(3):189–200
Zadeh L (1965) Fuzzy sets. Inf Control 8:338–353
Acknowledgments
This manuscript was substantially improved by comments from John Bell, Rebecca Efroymson and three anonymous reviewers. Research partially sponsored by the USDA Forest Service under Agreement Number PNW 03-IA-11261927-532 with Oak Ridge National Laboratory (ORNL), managed by UT-Battelle, LLC for the U.S. Department of Energy under Contract No. DE–AC05–00OR22725. The authors wish to express their extreme sadness at the untimely death of Ferko Csillag, not only for the loss to his colleagues and family, but also for the loss which we feel his passing represents to the discipline of statistical ecology.
Author information
Authors and Affiliations
Corresponding author
Rights and permissions
About this article
Cite this article
Hargrove, W.W., Hoffman, F.M. & Hessburg, P.F. Mapcurves: a quantitative method for comparing categorical maps. J Geograph Syst 8, 187–208 (2006). https://doi.org/10.1007/s10109-006-0025-x
Published:
Issue Date:
DOI: https://doi.org/10.1007/s10109-006-0025-x


