Abstract
Aims/hypothesis
The impact of AGEs and advanced lipoxidation end-products (ALEs) on neuronal and Müller glial dysfunction in the diabetic retina is not well understood. We therefore sought to identify dysfunction of the retinal Müller glia during diabetes and to determine whether inhibition of AGEs/ALEs can prevent it.
Methods
Sprague–Dawley rats were divided into three groups: (1) non-diabetic; (2) untreated streptozotocin-induced diabetic; and (3) diabetic treated with the AGE/ALE inhibitor pyridoxamine for the duration of diabetes. Rats were killed and their retinas were evaluated for neuroglial pathology.
Results
AGEs and ALEs accumulated at higher levels in diabetic retinas than in controls (p < 0.001). AGE/ALE immunoreactivity was significantly diminished by pyridoxamine treatment of diabetic rats. Diabetes was also associated with the up-regulation of the oxidative stress marker haemoxygenase-1 and the induction of glial fibrillary acidic protein production in Müller glia (p < 0.001). Pyridoxamine treatment of diabetic rats had a significant beneficial effect on both variables (p < 0.001). Diabetes also significantly altered the normal localisation of the potassium inwardly rectifying channel Kir4.1 and the water channel aquaporin 4 to the Müller glia end-feet interacting with retinal capillaries. These abnormalities were prevented by pyridoxamine treatment.
Conclusions/interpretation
While it is established that AGE/ALE formation in the retina during diabetes is linked to microvascular dysfunction, this study suggests that these pathogenic adducts also play a role in Müller glial dysfunction.
Introduction
The initiation and progression of diabetic retinopathy are linked to a complex interplay between the neurons, glia and vascular components of the retina. In diabetic patients and animal models, this pathophysiology manifests as degeneration of the microvasculature [1] and retinal neuropile [2]. Neuronal dysfunction is indicated by alterations in the electroretinogram, especially at the level of ganglion cells and bipolar cells [3, 4]. Histological studies have suggested that diabetes can induce significant apoptotic death in the neural retina, whereby ganglion cells, amacrine cells and even photoreceptors may be lost as diabetes progresses [5–8]. The precise mechanism(s) for this diabetes-induced neuronal dysfunction is yet to be established, but it is thought to be linked to factors such as impaired survival signalling [9], inflammation [6] and/or nitrosative/oxidative stress [10] in distinct neural cell populations.
Retinal Müller glia have a unique role in the architecture and physiology of the retina, regulating normal function of the retinal neurons and the vasculature [11]. These cells appear to be particularly susceptible to damage during diabetes and are now recognised as key players in the initiation and progression of diabetic retinopathy [11]. For example, Müller glia produce increased levels of glial fibrillary acidic protein (GFAP) [12] and show enhanced synthesis of glutamate with resultant retinal excitotoxicity [13]. Recent evidence also indicates that cytoplasmic swelling of Müller glia is a key factor in diabetes-related retinal oedema, a response that may be linked to K+ ion imbalance [14].
Among many possible pathogenic mediators of retinal dysfunction is the formation of AGEs and advanced lipoxidation end-products (ALEs). The irreversible accumulation of these adducts in tissues depends on several factors, including longevity of the modified protein, availability of metal ions, oxidative stress and the occurrence of precursor dicarbonyls. This contributes to the heterogenous nature of these chemical structures in vivo [15, 16]. Although often classed with AGEs, ALEs actually form through the lipoperoxidative production of reactive aldehyde species. Among the best characterised are \( {N^{\varepsilon }} \)-(2-propenal)lysine and dihydropyridine-type adducts (malondialdehyde-derived), hemiacetal and pyrrole adducts (4-hydroxy-2-nonenal and 4-hydroxyhexenal-derived) and \( {N^{\varepsilon }} \)-(3-formyl-3,4-dehydropiperidino)lysine (FDP-lysine) (acrolein-derived). AGEs have been previously studied in diabetic retinal vasculature, where they mediate vascular pathology [17, 18], but ALE formation is much less well characterised.
The current investigation studied the connection between AGE/ALE formation, and neuronal and Müller glial dysfunction in the diabetic retina. Using the established AGE/ALE inhibitor pyridoxamine, we demonstrated a link between advanced glycation/lipoxidation and Müller glial dysfunction during diabetic retinopathy.
Methods
Diabetic animal model
All animals were housed and cared for in accordance with British Home Office regulations. Diabetes was induced in male Sprague–Dawley rats (n = 20) by a single intravenous injection of streptozotocin (45 mg/kg in 0.1 mol/l citrate buffer). Another group received citrate buffer alone (n = 10). At 1 week after streptozotocin injection, animals with blood glucose levels >15 mmol/l were included in the study (n = 19). A subset of these diabetic animals (n = 10) subsequently received the AGE/ALE inhibitor pyridoxamine dihydrochloride (Biostratum, Durham, NC, USA) administered orally in the drinking water (1 g/l). Water intake and blood glucose were monitored monthly. At 4 months post-diabetes induction and immediately prior to experimentation, animals were re-weighed and blood was sampled for measurement of plasma glucose concentrations and per cent glycated haemoglobin (Helena Biosciences, Gateshead, UK). This diabetes duration was chosen because a previous time course study showed that accumulation of FDP-lysine is initially restricted to Müller glia end-feet at the internal limiting membrane (ILM), but as the disease progresses to the 4 month time-point, this adduct appears in the radial fibres extending towards the outer retina [19].
Morphological assessment of retina
Eyes were enucleated and fixed in 4% (wt/vol.) paraformaldehyde in PBS for 1 to 4 h at room temperature. After fixation, the posterior eye cups were cryoprotected, embedded in Tissue-Tek OCT compound (Sakura, Kobe, Japan) and 16 to 30 μm cryosections prepared. Images from haematoxylin and eosin-stained sections were captured. All measurements were made using image analysis software (Lucia G, version 4.71; Nikon, Kingston upon Thames, UK). Morphometric analysis was conducted as previously outlined [20] and included quantification of cell nuclei within the inner nuclear layer (INL), outer nuclear layer (ONL) and ganglion cell layer (GCL) by taking measurements from three set locations of the retina: (1) temporal ora serrata, (2) nasal ora serrata and (3) central retina. For retinal thickness, measurements were taken from the ILM to the outermost aspect of the ONL. Photoreceptor inner and outer segments were not included because of the variable flattening of this layer.
Immunohistochemistry of retina
Cryosections were mounted onto slides, rinsed in PBS and then blocked for 1 h at room temperature in 10% normal goat serum, 0.3% (wt/vol.) Triton X-100 in PBS. The slides were then rinsed in PBS and incubated for 24 h at 4°C with the primary antibody diluted in 10% normal goat serum, 0.3% Triton X-100 and 0.1% (wt/vol.) NaN3. Primary carboxymethyllysine (CML) and FDP-lysine monoclonal antibodies were used in the immunohistochemical analysis [21, 22]. Primary antibodies were also used to detect astrocytes/Müller glia (GFAP; Dako, Ely, UK), oxidative stress (haemoxygenase-1; Abcam, Cambridge, UK), aquaporin-4 (Abcam) and a membrane channel known to be important for retinal ion balance (Kir4.1; Alomone Laboratories, Jerusalem, Israel). Blood vessels were stained with isolectin B4 (Sigma, Dorset, UK) and streptavidin Alexa Fluor 488 (Invitrogen, Paisley, UK).
Following removal of the primary antibody, slides were extensively washed and incubated at room temperature in PBS with an appropriate fluorescent-conjugated secondary antibody (Alexa Fluor488 or Alexa Fluor568; Invitrogen) for 1 h. After several washing steps in PBS, cell nuclei were counterstained with either 1.5 mg/ml 4′-6-diamino-2-phenylindole (DAPI; Sigma) or 10 μg/ml propidium iodide (Sigma) in PBS containing 10 μg/ml RNase A (Invitrogen). Slides were mounted in anti-fade mounting medium (Dako). Negative controls were performed in parallel by omission of primary antibody.
Fluorescence was visualised with a confocal system (TE-2000 C1; Nikon). Images were obtained from three areas of the retina: (1) inferior central (0 to 1 mm below the optic nerve head), (2) inferior peripheral and (3) superior peripheral (0 to 2 mm from the inferior or superior peripheral edge of the retina, respectively). For measurement of immunofluorescence, the sample with brightest fluorescence was measured first. Confocal settings were then held constant when recording images of all subsequent samples. Images were processed and analysed using ImageJ software (NIH, Bethesda, MD, USA). Images were imported, colour-separated into their red, green and blue components and converted into 8 bit grey-scale images. Immunofluorescence was measured by the intensity of the pixels above a threshold defined as 4 SD above the mean background fluorescence intensity measured from regions devoid of retinal tissue. A user-defined frame was drawn around individual or multiple layers of the retina and the average fluorescence intensity above the threshold calculated. Staining at the limiting membranes and in perivascular regions was determined using similar image analysis techniques, but in this case fluorescence values were obtained from 3-pixel-wide segmented lines drawn along the ILM and outer limiting membrane (OLM), and around blood vessels in the capillary plexuses. The number of GFAP-positive fibres (per 100 μm of retinal cross-section) was counted in the inner plexiform layer (IPL). Either the left or the right eye was analysed for each rat. A total of nine tissue sections were imaged per retina (three sections from each of the three designated areas examined) and an overall average intensity value computed.
Apoptosis in diabetic retina
Apoptosis was determined by TUNEL assay using a kit (In Situ Cell Death Detection kit, fluorescein; Roche, Mannheim, Germany) according to the manufacturer’s instructions. For positive controls, retinal sections were incubated for 10 min with DNase-1 at room temperature. For negative controls, retinal sections were treated with labelling solution but incubated without terminal transferase. Positive cell counts were taken using a 40× objective and analysed using ImageJ (NIH).
Statistical analysis
Data are presented as means ± SEM. Statistical analyses were performed using Prism V4.02 (GraphPad, San Diego, CA, USA). All data sets were tested to verify that they fulfilled requirements for normal distribution. Two-way ANOVA was conducted to compare overall treatment differences and a p value of p < 0.05 was deemed significant. When a statistically significant difference was detected, post-hoc multiple pair-wise comparisons were performed using Bonferroni’s multiple range test.
Results
Diabetes and formation of retinal AGE/ALEs
At 4 months of diabetes, glycated haemoglobin was elevated in the diabetic group when compared with non-diabetic controls (19.66 ± 2.32% vs 6.45 ± 0.41%; p < 0.001). Pyridoxamine treatment of diabetic rats had no significant effect on glycated haemoglobin (18.55 ± 2.45%). Body weight decreased in untreated and treated diabetic rats (287 ± 9.4 and 224 ± 9 g, respectively) compared with non-diabetic controls (431 ± 9.4 g; p < 0.001).
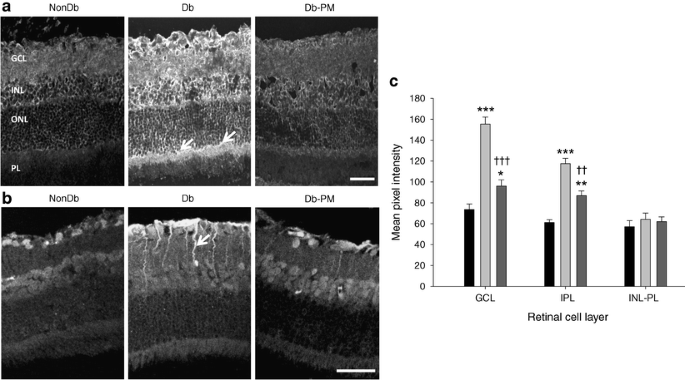
Streptozotocin-diabetes markedly increased immunoreactivity for CML in the retina. Qualitatively, this deposition was localised throughout the retina, especially at the retinal GCL, INL and within Müller cell processes beneath the ONL (Fig. 1). Quantitative assessment of fluorescence intensity demonstrated that pyridoxamine treatment led to a significant reduction in AGE (CML) in this tissue (p < 0.001)(data not shown), a finding corresponding to previous reports using CML-ELISA at 1 month of diabetes [23] and immunoreactivity at 7 months [24]. In non-diabetic animals, FDP-lysine immunoreactivity was apparent in a population of cells in the inner retina, especially in the GCL (Fig. 1b). There was a significant increase in FDP-lysine-immunoreactivity in the diabetic retina (p < 0.001; Fig. 1c), especially in cell processes extending from the ILM and through the INL. As with CML, FDP-lysine accumulation in the retina was significantly prevented by pyridoxamine treatment of diabetic rats (p < 0.01; Fig. 1c).
AGE/ALE immunoreactivity in rats at 4 months’ diabetes duration. a Transverse cryosections of retina from non-diabetic (NonDb), diabetic (Db) and diabetic rats treated with the AGE/ALE inhibitor pyridoxamine (Db-PM) were investigated for CML immunoreactivity using confocal microscopy. In the diabetic retina, a marked increase in CML-immunoreactivity was evident throughout all layers of the retina, but staining was most intense in the GCL and INL, with some cells positive in the ONL and at the Müller cell processes (arrows). PL, photoreceptor layer. Pyridoxamine treatment prevented the accumulation of CML in retinas of diabetic rats. Scale bar, 50 μm. In cryosections from the same groups (b), FDP-lysine immunoreactivity was prominent in the GCL of rat retina, with fluorescence intensity increased in diabetic retina in comparison with non-diabetic controls. In diabetic retina, immunoreactivity was especially evident in cell processes running through the inner retina (arrow), which is indicative of Müller glial localisation. Pyridoxamine treatment of diabetic rats diminished FDP-lysine staining, although it was still higher than in control counterparts. Scale bar, 50 μm. c Quantitatively, diabetes (light grey bars) significantly increased FDP-lysine immunoreactivity in the retina in the regions of the ILM–GCL and the IPL. There was no significant difference in FDP-lysine in the outer retina (INL-PL) of non-diabetic (black bars), diabetic or pyridoxamine-treated diabetic (dark grey bars) rats. *p < 0.05, **p < 0.01, ***p < 0.001 vs NonDb; †† p < 0.01 and ††† p < 0.001 vs Db
Haemoxygenase-1 levels in diabetic retina
Consistent with previous reports [25, 26], this study identified differences in the pattern of retinal levels of the oxidative stress marker haemoxygenase-1 when diabetic retinas were compared with controls (p < 0.001). As shown in Fig. 2, haemoxygenase-1 was elevated in the inner layers of the retina and at the OLM of diabetic animals, in a localisation and quantification pattern that was consistent with Müller glia. In the retina, haemoxygenase-1 has been shown previously to be almost exclusively located in the Müller glia [27]. Pyridoxamine treatment significantly prevented the diabetes-induced upregulation of haemoxygenase-1 (Fig. 2).
Haemoxygenase-1 levels in diabetic rats. a Haemoxygenase-1 immunoreactivity was markedly elevated in the diabetic retina (Db) in comparison with non-diabetic (NonDb) controls, with a localisation pattern indicative of Müller glia. Pyridoxamine treatment (Db-PM) reduced this upregulation. PL, photoreceptor layer. Scale bars, 50 μm. b Upon quantification, this marker of oxidative stress was particularly elevated in the inner layers of the diabetic retina (light grey bars) as indicated, but there were no differences at the photoreceptor layer (PL). Dark grey bars, pyridoxamine-treated diabetic; black bars, non-diabetic. *p < 0.05, ***p < 0.001 vs NonDb; † p < 0.05, ††† p < 0.001 vs Db
Cellularity of diabetic retina
Quantitative assessment of cell density in GCL, INL and ONL (Electronic supplementary material [ESM] Fig. 1a) and retinal thickness (ESM Fig. 1b) in histological sections of retina revealed no significant difference between any of the groups investigated. Apoptosis of retinal neurons and glia has been previously reported, but our TUNEL labelling studies in rats with diabetes of 4 months’ duration (ESM Fig. 1) demonstrated no appreciable apoptotic death in the retina. Positive controls for the TUNEL assay demonstrated that the method was capable of identifying DNA breaks associated with chromatin fragmentation (ESM Fig. 1c).
Müller glial alterations in diabetic retina
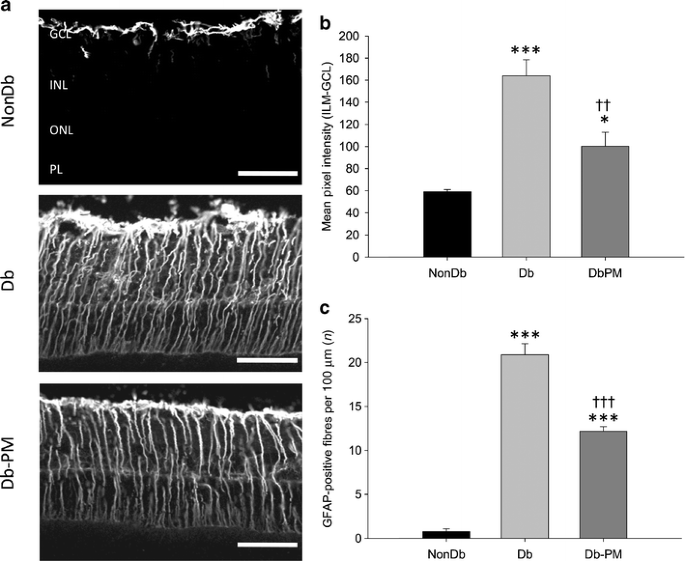
In the non-diabetic retina, GFAP was localised exclusively to the astrocytes, but diabetes induced a strong upregulation of this protein in astrocytes and retinal Müller glia (p < 0.001; Fig. 3). Pyridoxamine treatment had a partial but significant positive effect on astrocyte and Müller glial localisation of GFAP in diabetic rats, as indicated by reduced intensity of GFAP staining in the innermost retinal layers and the number of GFAP-positive fibres in the IPL (p < 0.01; Fig. 3).
AGE/ALE inhibition partially protects against diabetes-mediated GFAP production in Müller glia. a Retinas from non-diabetic (NonDb), diabetic (Db) and diabetic rats treated with the AGE/ALE inhibitor pyridoxamine (Db-PM) were stained with GFAP. Confocal microscopy revealed that non-diabetic control retina exhibited GFAP immunoreactivity solely within astrocytes, whereas in diabetic retina GFAP was upregulated in astrocytes and the processes of the Müller glia that span the entire inner retina. Treatment of diabetic rats with pyridoxamine had a noticeable effect on GFAP levels, although many Müller glial processes remained positive for GFAP. Scale bars, 50 μm. b Quantification of GFAP intensity in the innermost layers of the retina and (c) the number (n) of GFAP-positive fibres in the IPL, showing significant increases in diabetic retina vs non-diabetic controls. Pyridoxamine treatment partially but significantly prevented retinal GFAP production during diabetes. No significant differences in the intensity of the GFAP-positive Müller glial fibres were observed between diabetic and pyridoxamine-treated diabetic rats (data not shown; p > 0.05). *p < 0.05, ***p < 0.001 vs NonDb; †† p < 0.01 and ††† p < 0.001 vs Db
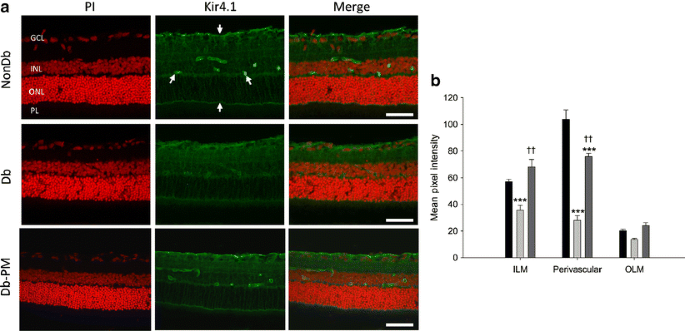
The weakly rectifying K+ channel Kir4.1 is typically expressed in Müller cells and localised at high concentrations at the end-feet and surrounding blood vessels [28]. A previous report by Pannicke et al [14] demonstrated diabetes-related alterations in the distribution pattern of Kir4.1 on Müller glia. In the current study, Kir4.1 immunoreactivity in retina from non-diabetic animals was predominantly localised to the inner retina, where it was strongly enriched in the end-feet and perivascular membranes of Müller cells (Fig. 4). Weaker staining was also detected at the OLM and throughout all retinal layers with the exception of the photoreceptor layer. The expression pattern for Kir4.1 was found to be significantly altered in retinas from diabetic animals, with Kir4.1 still detectable within the retinal tissue, but markedly reduced at the ILM and near the retinal blood vessels when compared with non-diabetic controls (p < 0.001; Fig. 4). A similar trend was also observed for Kir4.1 labelling at the OLM, but this failed to reach statistical significance. The effects of diabetes on levels and distribution of Kir4.1 channels were completely reversed at the ILM and partially reversed in perivascular membrane domains following treatment with pyridoxamine (p < 0.01for diabetic vs diabetic animals treated with pyridoxamine; Fig. 4).
Diabetes-induced alterations in Kir4.1 localisation to the Müller vascular end-feet is prevented by AGE/ALE inhibition. a In normal, non-diabetic retina (NonDb), Kir4.1 is typically localised to the ILM and OLM and is also particularly noticeable at Müller glial end-feet surrounding the retinal blood vessels (arrows). This pattern is altered in diabetic (Db) retina and the defined vascular localisation is diminished. AGE/ALE inhibition with pyridoxamine (Db-PM) significantly prevented this diabetes effect. Scale bars, 50 μm. Cell nuclei are counterstained with propidium iodide (PI; red). b Quantified data for Kir4.1 immunostaining at the ILM, in perivascular regions and at the OLM. Dark grey bars, pyridoxamine-treated diabetic; light grey bars, diabetic; black bars, non-diabetic. ***p < 0.001 vs NonDb; †† p < 0.01 vs Db
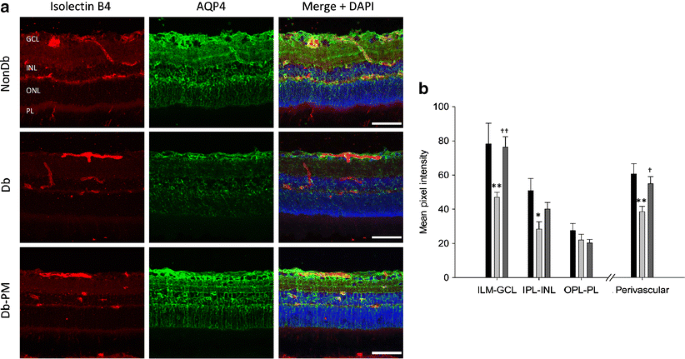
Previous studies have reported that the water channel, aquaporin 4, is mainly localised to astrocytes and Müller glia in the rat retina [29]. Immunolabelling for aquaporin 4 in retinal sections from non-diabetic rats revealed that aquaporin 4 was mainly present in the inner retina as well as around the blood vessels in the superficial and deep vascular plexuses (Fig. 5). Streptozotocin diabetes caused significant changes in levels and localisation of aquaporin 4, with a reduction in immunoreactivity throughout the inner retina, particularly in perivascular regions (p < 0.01; Fig. 5). The diabetes-induced disruption of aquaporin 4 was completely reversed by pyridoxamine treatment (p < 0.01; Fig. 5).
AGE/ALE inhibition prevents diabetes-induced changes in the production and localisation of glial aquaporin 4 (AQP4). a Retinal cryosections from non-diabetic (NonDb), diabetic (Db) and pyridoxamine-treated diabetic (Db-PM) rats were labelled with isolectin B4 (a vascular endothelial cell marker), AQP4 and DAPI nuclear stain. In retinas from control animals, AQP4 was mainly localised to cells in the innermost layers of the retina and Müller glia. In diabetic rats, AQP4 levels were reduced throughout the inner retina and in perivascular areas. These changes were prevented by treatment of the animals with pyridoxamine. Scale bars, 50 μm. b Quantification of AQP4 immunostained sections and statistical evaluation. Dark grey bars, pyridoxamine-treated diabetic; light grey bars, diabetic; black bars, non-diabetic. *p < 0.05, **p < 0.01 vs NonDb; † p < 0.05, †† p < 0.01 vs Db
Discussion
Many pathogenic pathways are evoked in the diabetic retina and therapeutic intervention with various inhibitors in animal models have proven effective in preventing disease initiation or progression [30]. One such pathway is formation of AGEs, the inhibition of which prevented breakdown of the blood retinal barrier [23], capillary basement membrane thickening [17] and degeneration of the retinal microvasculature [24, 31, 32]. The contribution of ALEs to the pathogenesis of diabetic retinopathy is less clear, although lipid peroxidation levels in this tissue are elevated after only 6 weeks of diabetes in rats [33]; our group, moreover, has recently shown that haemoglobin levels of the acrolein-derived FDP-lysine are associated with severity of retinopathy in type 1 and type 2 diabetic patients [34].
Pyridoxamine prevents CML formation and subsequent microvascular lesion formation in diabetic retinopathy in a rat model over a 7 month time-frame [24] with an efficacy that is comparable to that achieved in connection with other diabetic complications [35]. Pyridoxamine also prevents ALE formation in diabetic and obese rats [36, 37] through cleavage of alpha-dicarbonyl intermediates in glycoxidation and lipoxidation reactions [38]. It also effectively reduced upregulation of retinal haemoxygenase-1, which is significant as this enzyme has been previously used as a reliable marker of oxidative stress in diabetic retinopathy [25, 26]. It is known that AGE/ALE adducts are linked to generation of reactive oxygen species in the central nervous system [39]. A recently published study showed that in Müller glia exposed to FDP-lysine-modified albumin in vitro, a significant upregulation of haemoxygenase-1 and a concomitant increase in inflammatory cytokine levels occurred [19]. Although retinal inflammation was not evaluated in the current investigation, the ALE-mediated regulation of haemoxygenase-1 observed in vitro has now been shown to also occur in vivo. As AGE/ALE inhibition becomes a therapeutically more feasible way to prevent diabetic complications, it remains vital to assess the impact of these adducts on the non-vascular component of the retina. This is especially important as our current and previous data [24] indicate that AGE/ALE adducts mostly accumulate in the Müller glia.
It has been suggested that electroretinogram defects during diabetes could indicate progressive retinal neuronal and Müller glial dysfunction and apoptosis [7]. In our studies neuronal and glial death in the retina following 4 months of diabetes was negligible, although alterations in Müller cell reactivity were observed. Lack of apoptotic death as determined by TUNEL and caspase-3 activation (data not shown) in the diabetic retina appear contradictory to many previous reports indicating cell depletion in all layers [7–9]. Using a similar approach to the current investigation, Feit-Leichman et al. reported that diabetic mice show only transient apoptotic death in the retina, with some TUNEL-positive cells in the GCL after 2 weeks of diabetes [20]. It is interesting that beyond 1 month of diabetes no significant alteration in TUNEL positivity was reported in the retina between diabetic and non-diabetic mice [20]. Ultimately, this manifested as no change in retinal cellularity and thickness, even up to 12 months after diabetes induction [20]. Overt Müller glial degeneration is a condition that demands further investigation and, perhaps, standardisation of experimental protocols, animal strain differences and diabetes duration. Closer scrutiny of these cells during diabetes, for example by examining other modes of cell death and dysfunction, is warranted.
The presence of GFAP in the retinal Müller glia is a well-established phenomenon in diabetic retina. Indeed, we, too, observed a significant alteration in immunolocalisation between normal and diabetic animals. Using the AGE/ALE inhibitor, aminoguanidine, Agardh et al. indicated a lack of benefit in terms of GFAP activation [40]. Similarly, we found that AGE/ALE inhibition with pyridoxamine had only a marginal influence on this variable. Upregulation of GFAP as a structural protein may be a general stress response by Müller glia [41] that is possibly unconnected to AGE/ALE accumulation. Indeed, it has been reported that increased activity of the polyol pathway is principally responsible for the induction of Müller cell GFAP production during diabetes [42].
Maintenance of ‘K+ siphoning’ by retinal Müller glia is essential for normal neural activity [43], while Kir4.1 channels at the ILM and glial end-feet surrounding retinal capillaries are believed to play an important role in the hydration balance of the neuropile [28]. The association of Kir4.1 channels with aquaporin 4 channels in distinct membrane domains of Müller glia has led to the suggestion that water transport through Müller glia is tightly coupled to the spatial buffering K+ currents mediated by the cells [29]. Spatial buffering K+ currents generate osmotic gradients and are thus likely to be compensated for by local changes in osmolarity with water flux via aquaporin 4 channels [29, 44, 45]. Thus, through osmotic coupling to the transglial K+ currents, water moves through the Müller cell bodies from the retinal neuropile into the vitreous body and retinal capillaries [29]. Diabetes is associated with a downregulation and/or mislocalisation of Kir4.1 and aquaporin 4 channels in Müller glia [14, 46]. These diabetes-related abnormalities were also observed in the current study and could disrupt the clearance of excess K+ and water from the retina, thereby promoting oedematous changes and neuronal hyperexcitation with associated glutamate release [11]. Interestingly, AGE/ALE inhibition protected against Kir4.1 and aquaporin 4 channel dysfunction, providing further evidence that Müller glial dysfunction is linked to AGE/ALE accumulation. Consistent with the idea that AGE/ALE-induced changes in Müller glia Kir4.1 and aquaporin 4 channels could contribute, at least in part, to the development of diabetic retinal oedema, we have previously shown that pyridoxamine prevents fluid accumulation within the retina in animal models of diabetes [23].
To date, most in vivo studies of AGE involvement in diabetic retinopathy have concentrated on the retinal microvasculature. Outcomes from the current study suggest that advanced glycation/lipoxidation could be an important factor in retinal Müller glial dysfunction. Future clinical use of effective inhibitors of these adducts could limit retinopathy progression in patients.
Abbreviations
- ALE:
-
Advanced lipoxidation end-product
- CML:
-
Carboxymethyllysine
- FDP-lysine:
-
\( {N^{\varepsilon }} \)-(3-Formyl-3,4-dehydropiperidino)lysine
- GCL:
-
Ganglion cell layer
- GFAP:
-
Glial fibrillary acidic protein
- ILM:
-
Internal limiting membrane
- INL:
-
Inner nuclear layer
- IPL:
-
Inner plexiform layer
- OLM:
-
Outer limiting membrane
- ONL:
-
Outer nuclear layer
References
Curtis TM, Gardiner TA, Stitt AW (2009) Microvascular lesions of diabetic retinopathy: clues towards understanding pathogenesis? Eye (Lond) 23:1496–1508
Antonetti DA, Barber AJ, Bronson SK et al (2006) Diabetic retinopathy: seeing beyond glucose-induced microvascular disease. Diabetes 55:2401–2411
Hancock HA, Kraft TW (2004) Oscillatory potential analysis and ERGs of normal and diabetic rats. Investig Ophthalmol Vis Sci 45:1002–1008
Phipps JA, Yee P, Fletcher EL, Vingrys AJ (2006) Rod photoreceptor dysfunction in diabetes: activation, deactivation, and dark adaptation. Investig Ophthalmol Vis Sci 47:3187–3194
Barber AJ, Antonetti DA, Kern TS et al (2005) The Ins2Akita mouse as a model of early retinal complications in diabetes. Investig Ophthalmol Vis Sci 46:2210–2218
Krady JK, Basu A, Allen CM et al (2005) Minocycline reduces proinflammatory cytokine expression, microglial activation, and caspase-3 activation in a rodent model of diabetic retinopathy. Diabetes 54:1559–1565
Martin PM, Roon P, van Ells TK, Ganapathy V, Smith SB (2004) Death of retinal neurons in streptozotocin-induced diabetic mice. Investig Ophthalmol Vis Sci 45:3330–3336
Park SH, Park JW, Park SJ et al (2003) Apoptotic death of photoreceptors in the streptozotocin-induced diabetic rat retina. Diabetologia 46:1260–1268
Barber AJ, Lieth E, Khin SA, Antonetti DA, Buchanan AG, Gardner TW (1998) Neural apoptosis in the retina during experimental and human diabetes. Early onset and effect of insulin. J Clin Invest 102:783–791
Tatsumi Y, Kanamori A, Nagai-Kusuhara A et al (2008) Nipradilol protects rat retinal ganglion cells from apoptosis induced by serum deprivation in vitro and by diabetes in vivo. Curr Eye Res 33:683–692
Bringmann A, Pannicke T, Grosche J et al (2006) Muller cells in the healthy and diseased retina. Prog Retin Eye Res 25:397–424
Gerhardinger C, Brown LF, Roy S, Mizutani M, Zucker CL, Lorenzi M (1998) Expression of vascular endothelial growth factor in the human retina and in nonproliferative diabetic retinopathy. Am J Pathol 152:1453–1462
Li Q, Puro DG (2002) Diabetes-induced dysfunction of the glutamate transporter in retinal Muller cells. Investig Ophthalmol Vis Sci 43:3109–3116
Pannicke T, Iandiev I, Wurm A et al (2006) Diabetes alters osmotic swelling characteristics and membrane conductance of glial cells in rat retina. Diabetes 55:633–639
Thorpe SR, Baynes JW (2003) Maillard reaction products in tissue proteins: new products and new perspectives. Amino Acids 25:275–281
Goldin A, Beckman JA, Schmidt AM, Creager MA (2006) Advanced glycation end products: sparking the development of diabetic vascular injury. Circulation 114:597–605
Gardiner TA, Anderson HR, Stitt AW (2003) Inhibition of advanced glycation end-products protects against retinal capillary basement membrane expansion during long-term diabetes. J Pathol 201:328–333
Stitt AW, Hughes SJ, Canning P et al (2004) Substrates modified by advanced glycation end-products cause dysfunction and death in retinal pericytes by reducing survival signals mediated by platelet-derived growth factor. Diabetologia 47:1735–1746
Yong PH, Zong H, Medina R, et al. (2010) The \( {N^{\varepsilon }} \)-(3-formyl-3,4-dehydropiperidino)lysine adduct plays an important role in Müller glia dysfunction and death in diabetic retinopathy. Mol Vis (in press)
Feit-Leichman RA, Kinouchi R, Takeda M et al (2005) Vascular damage in a mouse model of diabetic retinopathy: relation to neuronal and glial changes. Investig Ophthalmol Vis Sci 46:4281–4287
Nagai R, Horiuchi S, Unno Y (2003) Application of monoclonal antibody libraries for the measurement of glycation adducts. Biochem Soc Trans 31:1438–1440
Uchida K, Kanematsu M, Sakai K et al (1998) Protein-bound acrolein: potential markers for oxidative stress. Proc Natl Acad Sci USA 95:4882–4887
Canning P, Glenn JV, Hsu DK, Liu FT, Gardiner TA, Stitt AW (2007) Inhibition of advanced glycation and absence of galectin-3 prevent blood–retinal barrier dysfunction during short-term diabetes. Exp Diabetes Res 2007:51837
Stitt A, Gardiner TA, Alderson NL et al (2002) The AGE inhibitor pyridoxamine inhibits development of retinopathy in experimental diabetes. Diabetes 51:2826–2832
Cukiernik M, Mukherjee S, Downey D, Chakabarti S (2003) Heme oxygenase in the retina in diabetes. Curr Eye Res 27:301–308
Hammes HP, Bartmann A, Engel L, Wulfroth P (1997) Antioxidant treatment of experimental diabetic retinopathy in rats with nicanartine. Diabetologia 40:629–634
Ulyanova T, Szel A, Kutty RK et al (2001) Oxidative stress induces heme oxygenase-1 immunoreactivity in Muller cells of mouse retina in organ culture. Investig Ophthalmol Vis Sci 42:1370–1374
Ishii M, Horio Y, Tada Y et al (1997) Expression and clustered distribution of an inwardly rectifying potassium channel, KAB-2/Kir4.1, on mammalian retinal Muller cell membrane: their regulation by insulin and laminin signals. J Neurosci 17:7725–7735
Nagelhus EA, Veruki ML, Torp R et al (1998) Aquaporin-4 water channel protein in the rat retina and optic nerve: polarized expression in Muller cells and fibrous astrocytes. J Neurosci 18:2506–2519
Mohamed Q, Wong TY (2008) Emerging drugs for diabetic retinopathy. Expert Opin Emerg Drugs 13:675–694
Bhatwadekar A, Glenn JV, Figarola JL et al (2008) A new advanced glycation inhibitor, LR-90, prevents experimental diabetic retinopathy in rats. Br J Ophthalmol 92:545–547
Hammes HP, Du X, Edelstein D et al (2003) Benfotiamine blocks three major pathways of hyperglycemic damage and prevents experimental diabetic retinopathy. Nat Med 9:294–299
Obrosova IG, Fathallah L, Greene DA (2000) Early changes in lipid peroxidation and antioxidative defense in diabetic rat retina: effect of DL-alpha-lipoic acid. Eur J Pharmacol 398:139–146
Zhang X, Lai Y, McCance DR et al (2008) Evaluation of \( {N^{\varepsilon }} \)-(3-formyl-3, 4-dehydropiperidino)lysine as a novel biomarker for the severity of diabetic retinopathy. Diabetologia 51:1723–1730
Alderson NL, Chachich ME, Youssef NN et al (2003) The AGE inhibitor pyridoxamine inhibits lipemia and development of renal and vascular disease in Zucker obese rats. Kidney Int 63:2123–2133
Alderson NL, Chachich ME, Frizzell N et al (2004) Effect of antioxidants and ACE inhibition on chemical modification of proteins and progression of nephropathy in the streptozotocin diabetic rat. Diabetologia 47:1385–1395
Metz TO, Alderson NL, Thorpe SR, Baynes JW (2003) Pyridoxamine, an inhibitor of advanced glycation and lipoxidation reactions: a novel therapy for treatment of diabetic complications. Arch Biochem Biophys 419:41–49
Metz TO, Alderson NL, Chachich ME, Thorpe SR, Baynes JW (2003) Pyridoxamine traps intermediates in lipid peroxidation reactions in vivo: evidence on the role of lipids in chemical modification of protein and development of diabetic complications. J Biol Chem 278:42012–42019
Vicente Miranda H, Outeiro TF (2010) The sour side of neurodegenerative disorders: the effects of protein glycation. J Pathol 221:13–25
Agardh E, Bruun A, Agardh CD (2001) Retinal glial cell immunoreactivity and neuronal cell changes in rats with STZ-induced diabetes. Curr Eye Res 23:276–284
Izumi Y, Kirby CO, Benz AM, Olney JW, Zorumski CF (1999) Muller cell swelling, glutamate uptake, and excitotoxic neurodegeneration in the isolated rat retina. Glia 25:379–389
Asnaghi V, Gerhardinger C, Hoehn T, Adeboje A, Lorenzi M (2003) A role for the polyol pathway in the early neuroretinal apoptosis and glial changes induced by diabetes in the rat. Diabetes 52:506–511
Newman EA, Frambach DA, Odette LL (1984) Control of extracellular potassium levels by retinal glial cell K+ siphoning. Science (New York, NY) 225:1174–1175
Hasegawa H, Ma T, Skach W, Matthay MA, Verkman AS (1994) Molecular cloning of a mercurial-insensitive water channel expressed in selected water-transporting tissues. J Biol Chem 269:5497–5500
Nielsen S, Nagelhus EA, Amiry-Moghaddam M, Bourque C, Agre P, Ottersen OP (1997) Specialized membrane domains for water transport in glial cells: high-resolution immunogold cytochemistry of aquaporin-4 in rat brain. J Neurosci 17:171–180
Iandiev I, Pannicke T, Reichenbach A, Wiedemann P, Bringmann A (2007) Diabetes alters the localization of glial aquaporins in rat retina. Neurosci Lett 421:132–136
Acknowledgements
This work was supported by grants from the Juvenile Diabetes Research Foundation, Fight for Sight (UK), The Research and Development Office (Northern Ireland) and the Department for Employment and Learning, Northern Ireland. We thank L. Colhoun (Center for Vision and Vascular Sciences, Queen’s University Belfast) for her valuable help with confocal microscopy.
Duality of interest
The authors declare that there is no duality of interest associated with this manuscript.
Author information
Authors and Affiliations
Corresponding author
Electronic supplementary material
Below is the link to the electronic supplementary material.
ESM Fig. 1
Neither retinal thickness nor neuroglial apoptosis are altered following 4 months of diabetes. To evaluate the thickness of retinal layers in control, diabetic and diabetic rats treated with pyridoxamine, histological sections were stained with haematoxylin and eosin. Cell counts taken for (a) GCL, INL and ONL revealed no significant change in the mean number of cells per layer. The mean thicknesses (b) of the total retina, INL and ONL were also not significantly different between the groups. c Cryosections (12 μm) were stained using an in situ cell death detection kit and the necessary positive and negative controls were performed. Propidium iodide (PI) was used to indicate the orientation within the various retinal layers (red). No positive TUNEL staining (green) was evident in retina from non-diabetic (Non-Db), diabetic (Db) and diabetic rats treated with pyridoxamine (Db + PM). The DNAse-treated positive control shows typical strand breaks in the various nuclear layers (PDF 2,059 kb)
Rights and permissions
About this article
Cite this article
Curtis, T.M., Hamilton, R., Yong, PH. et al. Müller glial dysfunction during diabetic retinopathy in rats is linked to accumulation of advanced glycation end-products and advanced lipoxidation end-products. Diabetologia 54, 690–698 (2011). https://doi.org/10.1007/s00125-010-1971-x
Received:
Accepted:
Published:
Issue Date:
DOI: https://doi.org/10.1007/s00125-010-1971-x


