Abstract
Spent coffee grounds (SCGs) have been extensively investigated as a feedstock to produce fuels, specialty chemicals and materials. Whilst a few reports have used cascade processes to generate several products from SCG, this work takes the novel approach of using integrated subcritical water extraction (SWE) and hydrothermal carbonisation (HTC) to derive three products: a bioactive extract, a protein isolate (SCG PI) and solid fuel. SWE and HTC processes were optimized producing an antioxidant rich extract, with the chlorogenic acid (CGA) content and antioxidant activity determined. The protein content was quantified via total amino acid analysis, giving the first SCG specific elemental nitrogen-to-protein conversion factor of 7.90. HTC was then performed on the residual solids from SWE, the protein extraction and the raw feedstock. This biorefinery approach gave higher quality products than previously reported in single product systems. For example, pretreatment reduced nitrogen in the hydrochar (N = 0.23% wt, HHV = 33.30 MJ/kg) relative to the control (3.03% wt, HHV = 31.31 MJ/kg). Limiting biorefinery processes to the pretreatment and HTC preferentially increased protein content (33.0% vs 16.9% wt) and yield (53.0% vs 23.9%) of the protein isolate, rendering a hydrochar with a higher yield and HHV compared with hydrochar derived following upstream SWE process (33.30 vs 26.92 MJ/kg, 16.3% vs 14.7%, respectively). This work goes towards the complete utilisation of SCGs within a biorefinery, highlighting the potential of subcritical water processing to produce commercially viable products across the value chain.
1 Introduction
Spent coffee grounds (SCGs) are the solid residues often discarded after brew preparation. SCGs are comprised of 50–70% lignocellulose and are a readily amenable feedstock for the production of biofuels, chemicals and functional materials [1]. Indeed, a significant body of work has established the potential of SCG in the production of biomethane [2], bioethanol [3, 4], hydrochar (a carbon-rich biomass alternative to coal) [5, 6] and biodiesel [7, 8] through biological, thermochemical and chemical conversion processes. SCGs also serve as a reservoir for bioactive and platform chemicals through extraction and further processing of the secondary metabolite, cellulose and hemicellulose constituents of its matrix [9,10,11,12].
European coffee consumption in 2018/2019 generated an estimated 6.5 million tonnes of SCG [13]. With the continual growth of the coffee processing industry, amassment of SCG is challenging for municipal waste management services. Exploitation as a feedstock for fuels, chemicals and materials is therefore an effective circular economy strategy to prevent the accumulation of SCG in landfill, bringing about a reduction of methane emissions (released through microbial decomposition processes) and increasing the overall sustainability of the coffee processing industry. Averting the potential leaching of ecotoxic polyphenolic and alkaloid components of SCG into the environment additionally merits the valorisation of SCG [14].
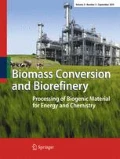
To this end, recent research efforts have established SCG as a viable feedstock within the biorefinery concept [1]. Direct examples of integrated processes utilize SCG for coproduction of bioethanol and biodiesel [15]; bioactive extracts and bioethanol [16]; biodiesel, biomethane and biogas [8]; polyhydroxyalkanoates (PHA) and carotenoids [17]; and lignin, biodiesel and biogas [18]. In general, the initial step of process schematics is extraction or hydrolysis, establishing polar and/or lipid streams. Polar solvents and/or mild acid hydrolysis isolates high-value phenolic and/or saccharide containing extracts that exhibit antioxidant, antimicrobial and prebiotic properties. Bioprocessing platforms further downstream convert reducing sugars into bioethanol and further platform molecules. For the lipid stream, organic solvents derive coffee oil from SCG, which is then converted to biodiesel and glycerol via transesterification, or transformed into PHA via bioprocessing. Thermochemical platforms can convert the solid residues from either stream or the raw feedstock directly into solid, liquid and gaseous fuels, functional materials and energy. A final biotechnological conversion of the solid fuel affords the production of biomethane.
Several studies have used subcritical water extraction (SWE) to selectively isolate antioxidant, polysaccharide extracts from SCG [9, 19,20,21,22]. As a cheap, readily available, non-toxic, non-flammable solvent, water is an attractive medium that preserves the “food-grade” quality of extracts destined for nutraceutical, pharmaceutical and cosmetic uses. The relatively high moisture content of SCG (50–60%), which is complementary to aqueous media, advantageously dispenses of the need for a drying pre-step [1]. Incorporation of these extracts into cosmetic formulations [12], packaging [23] and nutraceutical bakery products [24, 25] to confer properties deemed attractive for consumers (such as anti-ageing, fat-reduction and increased prebiotic activity) demonstrates the lucrative potential of SCG antioxidants.
Subcritical conditions (100–374 °C) have also been used to convert SCG into energetic hydrochar and bio-oil products, via hydrothermal carbonisation (HTC) and liquefaction (HTL), respectively. Heating SCG-water slurries between 180 and 260 °C for 1–5 h at pressures above the vapour pressure of water gives a carbonaceous solid hydrochar major product [26]. SCG hydrochar is amenable for soil amendment as a bio-char, enhancing biomethane yields as a co-inoculant [2], combustion as a bio-coal substitute exhibiting an augmented calorific value [5, 6] or dye removal [27] and carbon capture as a bioadsorbent [28].
However, for solid fuel production, mass reduction through migration of oxygen and hydrogen from the biomass to the liquid and gas phase confers higher N/C ratios in the SCG hydrochar relative to the feedstock. As a result, the potential to exceed regulatory limits for NOx emissions during combustion may limit the commercial viability of SCG hydrochar [29]. This issue has yet to be addressed in the few examples of SCG hydrochar in the literature where reported N content increases from 1.50–2.29% wt in the raw feedstock to 2.98–3.60% under investigated carbonisation regimes [5, 6]. As NOx emissions derive mostly from fuel-bound N species, SCG hydrochar is currently unsuitable for commercial use [29, 30].
Consequently, in this investigation, we present a stepwise valorisation of SCG via integrated hydrothermal conversion and chemical pretreatment processes (Fig. 1).

Proposed hydrothermal biorefinery for valorisation of SCG. SCGs undergo subcritical water extraction to obtain high-value antioxidant aqueous extract containing chlorogenic acids, polyphenolic and polysaccharides. A protein extraction of the residual solid cake (SWE SCG) reduces the nitrogen content in the solids (PE SWE SCG) and retains a protein concentrate (SWE SCG PI). Hydrothermal carbonisation converts PE SWE SCG into a hydrochar for combustion and yields an aqueous phase enriched with micronutrients
2 Materials and methods
2.1 Raw materials and chemicals
Spent coffee grounds (SCG) and defatted SCG (DSCG) were supplied by Bio-bean and stored at 4 °C until extractions. Moisture content of solids was determined using a thermogravimetric mass analyser (TGA, Setaram Setsys Evolution TGA 16/18), where samples were heated to 105 °C (20 °C/min) and held for 35 min under an argon atmosphere. Mass loss during this time was attributed to evaporation of water held within the matrix and expressed as a percentage of the starting material. Analyses were conducted in duplicate.
All chemicals were reagent grade or analytical (HPLC) grade and supplied by Sigma-Aldrich and Fisher Scientific.
2.2 Hydrothermal experiments
2.2.1 Subcritical water extractions and hydrothermal carbonisations
Subcritical water extractions (SWE) were first performed as part of a 23 central composite design, under different temperatures (110–200 °C), residence times (1–30 min) and liquid-to-solid ratio (5–25 ml/g SCG). Preliminary hydrothermal carbonisation of SCG was conducted as part of a 23 full factorial design of experiment, over varying temperature (190–260 °C), times (1–6 h) and liquid-to-solid ratio (2–5 ml/ g).
For each SWE and HTC reaction, a high-pressure bench-top stirred reactor (Parr Instruments Company, Illinois, USA), with a 300-mL Hastelloy reaction vessel, was used. A thermocouple in the centre of the reactor head and PID temperature controller were used to control the reaction temperature. For each experiment, 5 g of SCG (SWE) or 10 g of DSCG (HTC) (both as received) along with the requisite quantity of deionized water was loaded into the vessel, which was sealed and heated to desired run temperatures. Residence time was recorded from when the internal temperature of the vessel reached the desired run temperature until the required duration of the run. After cooling, extracts were separated by filtration (Fisherbrand® QL100 papers), and masses of the aqueous phases were recorded, where the volume of liquid extract was used to calculate extraction yield (g/100 g SCG) The liquid phase was then stored at − 21 °C until analysis and the solids were dried at 60 °C for 48 h, weighed and stored at room temperature until analysis or use in protein extractions or HTC.
DSCG was used to establish optimal HTC conditions in the event of inclusion of an oil extraction platform, for preparation of biodiesel. However, this scenario was subsequently omitted from the proposed SCG biorefinery.
2.2.2 Experimental design and statistical analysis
The effect of temperature, (X1), extraction time (X2) and liquid-to-solid ratio (X3) process parameters on SWE responses, antioxidant activity (determined by FRAP, DPPH assays) CGA yield; and total phenolic content (TPC) and HTC responses, calorific value and energy recovery efficiency, were studied using 23 central composite and 23 full factorial designs, respectively. Table 1 and Table 2 display the real and coded values of the parameters explored for SWE and HTC, where statistical significance was determined at 5% probability level (p <0.05).
For process optimisation, quadratic models of the relationship between response and process parameters were obtained by fitting data for each response to x order polynomial equations. Statistically non-significant parameters (p > 0.05) were eliminated from the models. Statistical significance of the model coefficients was determined by analysis of variance (ANOVA) and the coefficient of determination (R2) gave the variability of the response accounted for by the model. Statistical analysis of data and optimisation was conducted using Minitab software (version 18.0).
2.3 Protein hydrolysis
Protein was extracted according to a standard literature method using caustic soda [31]. Hydrolysis of SCG PI was conducted using 6M-HCl and 0.4% (w/w) 2-mercaptoethanol (β-ME), as described elsewhere [32]. Each hydrolysis took place for 24 h at 110 °C, using 0.5 g of sample and 5 mL of 6M HCl and 0.4% β-ME. After cooling, solids were filtered off, the supernatant was stored at − 21 °C until analysis. Hydrolyses were conducted in duplicate and an amino acid standard (Sigma) was used to correct for losses.
2.4 Analysis
It is important to note that total antioxidant activity cannot be determined by a single in vitro antioxidant assay (AOA), due to the influence of the sample matrix and antioxidant on the thermodynamics and kinetics of radical scavenging. Determination of structure-activity relationships can be achieved via HPLC/LC-MS identification and quantification of active species [33, 34]. Accordingly, three AOA (Folin-Ciocalteu total phenolic content (TPC), ferric reducing antioxidant power (FRAP) and DPPH) and HPLC quantification of CGA were used to characterize the antioxidant properties of extracts derived from the SWE of SCG.
2.4.1 Total phenolic content determination
TPC was determined using the Folin-Ciocalteu method by Panusa et al. [35]. Absorbances at 525 nm were monitored using a spectrophotometer (SPECTRONIC™ 200).
2.4.2 Ferric reducing antioxidant power (FRAP) assay
FRAP assays were conducted according to the method of Choi and Koh [36].
2.4.3 2,2-Diphenyl-1-picrylhydrazyl scavenging assay
Antioxidant activity was measured using a DPPH assay of Ballestros et al. with some modifications [37]. A dilution series of four concentrations was prepared for each sample and 2 mL of 50-uM DPPH solution (in 80% methanol) was added to 250 uL of sample. The reaction was left in the dark for 1 h. The absorbance at 515 nm was then measured using a spectrophotometer (SPECTRONIC™ 200), with a methanol blank and distilled water control. DPPH percentage inhibition was calculated using Eq. 1, where As and Ac are the absorbances of the sample and control, respectively. A calibration curve was constructed using 50–600-μM standard solutions of Trolox (6-hydroxy-2,5,7,8-tetramethylchroman-2-carboxylic acid) in methanol. DPPH percentage inhibition was plotted against sample concentration to determine the concentration at 50% inhibition (IC50). The data was expressed as micromoles of Trolox equivalent (TE) per gram of SCG (μmol TE/g SCG):
2.4.4 High-pressure liquid chromatographic quantification of chlorogenic acid
3-CQA, 4-CQA and 5-CQA were quantified using an Agilent HPLC 1260 Infinity system equipped with a Phenomenex Gemini 5 μ C18 column (250 × 4.60 mm) and a multiple wavelength detector. The mobile phase consisted of acetonitrile and water (1/8 v/v) with 10 g/l of glacial acetic acid (pH ~ 2.5).The flow rate was 1.0 mL/min, injection volume was 5 μL, column temperature 20 °C and the detector was set at 325 nm for detection of the 3-CQA, 4-CQA and 5-CQA isomers.
A standard curve was calibrated using a 3-CQA analytical standard (Sigma-Aldrich, 95% purity) and total CGA concentration (3-CQA, 4-CQA and 5-CQA) was calculated in 3-CQA equivalents using the regression equation of the standard curve and respective peak areas. The limit of detection and quantification (LOD and LOQ) was calculated as 3 or 10 x [the residual standard deviation in the regression line/slope of the regression], respectively. LOQ = 0.02 mg/ml. Measurements were taken in duplicate, unless otherwise stated.
2.4.5 Hydrophobic interaction liquid chromatographic analysis of amino acids
Amino acids were quantified using an Agilent QTOF 6545 with Jetstream ESI spray source coupled to an Agilent 1260 Infinity II Quat pump HPLC equipped with an Agilent InfinityLab Poroshell 120 HILIC-Z 2.1 × 100 mm, 2.7 μm column, with 1260 autosampler and variable wavelength detector (VWD). A gradient elution program was used: mobile phase A (H2O with 0.1% formic acid) and mobile phase B (20-mM ammonium formate (pH 3) in 90% acetonitrile). Initially gradient mode was set at 100% B, decreasing linearly to 70% A at 11.5 min, back to 100% B at 12 min until a total run time of 15 min. Sample injection was 5 μL and flow rate was 0.5 mL/min. The MS was operated in positive ionisation mode with the gas temperature at 300 °C, drying gas flow at 13 L/min and nebuliser gas flow at 30 psi (2.06 bar). Sheath gas temperature was 350 °C at a flow rate of 12 L/min. For All ions MS/MS, the three scan segments were set with collision energies of 0, 20 and 40 eV. Data analyses were performed in MassHunter Quantitative analysis B0.10.
2.5 Char characterisation
HTC solids were characterized via proximate and ultimate analysis. Ultimate analyses of carbon, hydrogen and nitrogen content were conducted externally by Elemental Labs in their UKAS 17025–accredited laboratory. Proximate analysis of fixed carbon, volatile matter and ash content was conducted using a Setaram Setsys Evolution TGA 16/18 analyser according to methodology published elsewhere [38]. Higher heating value, HHV, was calculated using elemental composition and Eq. 2 [39]:
Hydrochar yield was estimated using Eq. 3:
Energy recovery for each hydrochar was calculated using Eq. 4:
3 Results and discussion
3.1 Optimisation of the subcritical water extraction of SCG
A preliminary 23 central composite design established the significance of temperature, time and liquid-to-solid ratio process parameters on the following responses: CGA yield, TPC and antioxidant activity measured by FRAP and DPPH assays (Table 1). The design consisted of 20 runs, where, for each response, the largest value was obtained at run temperatures of 183 °C (CGA, 3.32 mg CGA/g SCG (run 12); TPC, 26.13 mg GAE/g SCG (run 9); FRAP, 0.28 mmol (Fe (II)/SCG (run 9); DPPH, 62.92 μmol TE/g SCG (run 12). For CGA, the highest setting of the temperature axial point (200 °C, run 10) gave quantities below the limit of detection of the instrument, demonstrating the thermal instability of CGA [40]. As previously reported, the significance of liquid-to-solid ratio is evident in the data in Table 1: the lowest values observed for CGA, TPC, FRAP and DPPH were obtained at the lowest axial setting for this parameter (5.0 ml/g SCG, run 20: 1.96 mg CGA/g SCG, 7.53 mg GAE/g SCG, 0.06 mmol Fe (II)/g SCG and 20.39 μmol TE/g SCG, respectively) [20].
The responses were then fitted to second-order polynomial equations, to obtain quadratic functions that describe the dependence of response on the parameter settings of the design. ANOVA was undertaken to identify terms with significant influence on values obtained for each response (p < 0.05) and these terms were included in the models. Table 3 displays the models generated for each response, and the corresponding coefficient of determination R2, giving the variability of the data accounted for by each model. Strong correlation was observed for the models (R2 ranged from 0.84 to 0.99) demonstrating the efficacy of the model agreement with the experimental observations.
To identify the optimal settings for maximum retention of CGA, TPC and antioxidant activity (as determined by DPPH and FRAP assays), a plot overlaying the models for each function was constructed (Fig. 2). The following limits for each response were used: CGA, 3.0–3.5 mg CGA/g SCG; TPC, 20–30 mg GAE/g SCG; FRAP, 0.21–0.31 mmol Fe(II)/g SCG and DPPH, 65–75 μmol TE/g SCG. The unshaded region of the chart illustrates the temperature and liquid-to-solid ratio settings (time held at 30 min) at which values for each response are obtained within the required range. The optimum point was identified at 180 °C, 30 min, 30 ml/g SCG, giving values for CGA, TPC, FRAP and DPPH of 3.4 mg CGA/g SCG, 22.45 mg GAE/g SCG, 0.31 mmol Fe (II)/g SCG and 69.31 μmol TE/g SCG, respectively. Subsequent runs at the optimal setting validated the model’s predicted values, where response values were obtained within the 95% prediction interval (PI) range (Table 4). Under similar SWE conditions (T = 180 °C, t = 30 min, L/S = 15 ml/g), Ballesteros et al. reported TPC, FRAP and DPPH values of 36.88 mg GAE, 1.0 mmol Fe(II)/g SCG and 119.02 μmol TE/g SCG, respectively [22]. The lower values obtained for the optimized analogues of this study may be due to the influence of L/S ratio on antioxidant activity of extracts, as evident in the model equations (Table 3). Nonetheless, values for antioxidant activity and CGA remain within the range reported for SCG extracts derived from SWE and solid-liquid extractions using organic solvents [11, 12, 35, 41, 42].

Overlay of the models describing the relationship between process parameters (temperature, time and liquid-to-solid ratio) and responses (TPC (green), CGA (brown), FRAP (purple) and DPPH (blue)). The unshaded region illustrates the optimum temperature and liquid-to-solid ratio settings for retention of responses within acceptable criteria range with a fixed time of 30 min
3.2 Optimisation of the hydrothermal carbonisation of SCG
In order to establish the optimal reactor settings for the HTC conversion of SCG into a maximally energy dense and yielding solid fuel, a 23 full factorial design of experiments was conducted using defatted SCG feedstock (HHV = 19.77 MJ/kg, Table 2). Variance in calorific value (HHV MJ/kg) and hydrochar yield (%) in response to temperature, time and liquid-to-solid ratio variables were then statistically analysed by ANOVA at (p<0.05) significance level.
According to the data of Table 2, the highest calorific values (HHV) were recorded for hydrochars produced at the highest temperature settings (run 15: 246 °C, 31.96 MJ/kg; run 3: 260 °C, 31.45 MJ/kg), whilst the lowest HHV (25.36 MJ/kg) was observed at the lowest temperature of the design (190 °C, run 7). Time was observed to increase HHV, where, for a given temperature and liquid-to-solid ratio, a higher HHV was exhibited by the hydrochar produced during runs with longer residence times (27.87 vs 31.01 MJ/kg, run 5 vs 6; 26.17 vs 26.73 MJ/kg, run 11 vs 13; 31.15 vs 31.96 MJ/kg, run 9 vs 15, respectively). Increasing liquid-to-solid ratio was observed to exert a negative or positive effect on the HHV of hydrochars produced at a given temperature and residence time (29.44 vs 29.66 MJ/kg, run 4 vs average of centre point runs 1, 2, 10, 12, 18 and 19; 31.96 vs 30.70 MJ/kg, run 15 vs 20; 26.73 vs 27.81 MJ/kg, run 13 vs 14, respectively).
Conversely, for hydrochar yield, the lowest and highest hydrochar yield were achieved at the highest and lowest temperature settings, respectively (37.79%, run 3; 59.61%, run 7). For a given temperature and liquid-to-solid ratio, hydrochar yield decreased with increasing residence time (54 vs 44.51%, run 5 vs 6, respectively). An increase of liquid-to-solid ratio was observed to decrease hydrochr yield (44.80 vs 48.40%, run 4 vs average of centre point runs 1, 2,10, 12, 18 and 19; 47.08 vs 44.02%, run 15 vs 20; 52.52 vs 48.71%, run 12 vs 13).
Second-order polynomial equations were then generated to fit the responses to the studied settings of the process parameters (Table 5). The terms that were found to be statistically significant (p < 0.05) were included for each response, giving models in close agreement with the data observations (R2− = 0.96 and 0.87, for HHV and hydrochar yield, respectively). Temperature and time were shown to significantly positively and negatively influence HHV and hydrochar yield, respectively, in agreement with published observations [5, 6]. For both responses, liquid-to-solid ratio had a non-significant influence on the variation displayed in the response data, supporting the observations of similar studies [43,44,45].
An overlay plot of both models (Fig. 3) displays the optimum region (unshaded area) where hydrochars with desired HHV and hydrochar yield values can be obtained as a function of temperature and time. In constructing the graph, the following criteria were set according to experimental data: HHV, 26–30 MJ/kg; hydrochar yield, 50–65%. These criteria are fulfilled for HTC at 223 °C, for 2 h 45 min, giving hydrochar with predicted HHV and hydrochar yield of 29.14 MJ/kg and 49.56%, respectively (Table 6). Subsequent runs at these settings validated the predictions of the model (HHV, 28.66 MJ/kg; hydrochar yield, 41.89%, Table 6).

Overlay of the models describing the relationship between process parameters (temperature and time) and responses (calorific value, HHV and hydrochar yield, HY). The unshaded region illustrates the optimum temperature and time settings for retention of responses within acceptable criteria range
3.3 Characterisation of the N fraction
Due to the mass reduction typical of the HTC process, the relative nitrogen content of SCG hydrochars is greater than that measured in the raw feedstock. Kim et al. reported 1.5% nitrogen content in the exhausted coffee residue feedstock, which increased to 2.5–3.5% in hydrochars produced under different temperature regimes of HTC [6]. Similarly, elemental composition of hydrochars investigated by Afolabi et al. determined nitrogen in the range of 2.29–2.98%, greater than or equal to the 2.29% reported in the raw feedstock [5].
N content in hydrochar is dependent on the severity (temperature and time) and type of N compounds in the feedstock [29]. For proteinaceous feedstocks such as SCG, N migration from the solid to the oil and aqueous phase occurs. This is due to the release of ammonia and intermediates including amines, amides and inorganic N compounds as proteins are hydrolysed into amino acids and further decomposed via deamination and hydrolysis pathways. Further degradation, cyclization and condensation via dehydration and Maillard-type reactions result in aromatic heterocyclic, quaternary-N, pyrrole-N and pyridine-N species that are distributed between the aqueous phase, bio-oil and hydrochar [46]. Critical for SCG is the presence of protein and alkaloids such as caffeine, trigonelline, nicotinic acid and tannins, which may also compound the sequestration of organic N in SCG hydrochars [38, 47].
3.3.1 Amino acid composition of SCG, RAW SCG PI and SWE SCG PI
Precipitation of proteins from the liquor of the protein extractions was achieved and were subsequently hydrolysed (6M HCL + 0.4% w/v β-ME) into constituent amino acids for HILIC-MS chromatographic separation and analysis. Table 7 displays the quantities and type of amino acids identified in the raw feedstock and each protein isolate (SCG PI and SWE SCG PI) where a protein extraction was undertaken on the raw feedstock and the solid residues from the SWE of SCG.
The dominant amino acids of SCG are glutamic acid, lysine and aspartic acid (54.33, 24.87 and 23.56% total amino acids, SCG Table 8 and Fig. 4). Essential and branched amino acids constitute 43 and 18.51%, respectively, of SCG amino acids, indicating their potential for utilisation within nutraceutical applications. For animal feed, limiting amino acid lysine, methionine and valine are present in the highest quantities in SCG PI (22.25% total SCG PI amino acids, Table 8). The presence of tannins, caffeine and polyphenols in SCG is deleterious to animal [48] and plant growth [49, 50], limiting the incorporation of SCG in feed and fertilisers to 10% w/w [51]. It is expected that under the conditions used in this study, these species are destroyed and/or removed, presenting an opportunity for a more commercially viable product than SCG alone.

Amino acid percentage composition of 6M HCl hydrolysed extracts of raw SCG, and protein precipitates from the extraction of SCG (RAW SCG PI) and SWE pretreated SCG (SWE SCG PI)
Evident is the lability of threonine and serine to the alkali pretreatment, identified in lower quantities in both protein isolates with respect to the raw feedstock destruction in protein. The protein isolate derived after the SWE of SCG, SWE SCG PI, exhibited the lowest overall quantities of amino acid residues (16.92% w/w). This result is unsurprising and is likely due to the severity of the SWE, where the high temperatures promote the decomposition of amino acids via the Maillard reaction [52].
Conventionally, the crude protein content of biomass is indirectly determined by conversion of total nitrogen content using nitrogen-to-protein conversion factors (NPCF). For food, an NPCF of 6.25 is used based upon the approximation that proteins contain 16% nitrogen (100/16 = 6.25). For SCG, crude protein calculated in this manner is 15.94%, using N content measured by ultimate analysis (2.55%, Table 8). Quantifying total amino acids is an alternative method for the determination of total protein content, which, to the best of our knowledge, has not been applied to SCG for the specific purpose of total protein determination. It is important to note, however, that this technique is susceptible to inaccuracies arising from incomplete protein hydrolysis, hydrolysis of labile amino acids and conflation of free amino acids with residues derived from protein. Sample preparation, chromatographic separation and resolution of the individual amino acids are also potential sources of error which, when compared with the relative reproducibility and ease of measuring the elemental composition of samples, is suggestive of the popularity behind NPCF as the preferred method of determining crude protein.
Protein content, determined by the summation of SCG amino acid residues, is 21.79% SCG (Table 8). This result, which is higher than the indirect NPCF calculation, can be rationalized by taking into account the relative percentage composition of nitrogen in each SCG amino acid residue. A lower N content (12.66% of total amino acids) than the conventional 16% was measured, arising from relatively low quantities of amino acids with a high proportion of nitrogen (e.g. arginine, histidine, ornithine). Accordingly, with lower nitrogen present in SCG protein, a higher NPCF of 7.90 (100/12.66 = 7.90) is required to convert ultimate nitrogen to crude protein. This method, which has been used in the determination of specific NPCF for algae, gives 20.15%—in close agreement with the result from the summation of amino acid residues [53].
The protein content of the SCG protein isolate SCG PI is greater than the raw feedstock (32.75% total amino acid residues, 28.49% NPCF crude protein, Table 8). This can be explained as follows. As previously discussed, the removal of components from the SCG matrix during the alkali pretreatment results in an increased relative proportion of the remaining constituents, including protein. This is reflected in the higher total nitrogen of SCG PI (3.47%), of which a greater quotient than the raw feedstock originates from the protein fraction. In addition, it is expected that the liberation of protein from the SCG matrix increases the retrieval of amino acid residues in the consequent acid hydrolysis, giving higher net amino acids (327.47 vs 217.94 mg/g solid material). Therefore, whilst the specific NPCF of SCG PI is similar to the raw feedstock (12.18 vs 12.66), the higher ultimate result gives a greater crude protein in alignment with the measured total amino acids.
3.3.2 Ultimate analysis of protein extraction products
The ultimate composition of the raw feedstock, protein extraction solid residues (PE RAW, PE SWE) and precipitated protein isolates (SCG PI, SWE SCG PI) from the alkali pretreatment is displayed in Fig. 5. Migration of nitrogen and oxygen from the raw feedstock to the protein isolates is apparent, along with a relative decrease in carbon and hydrogen. Importantly, the extraction solid residues PE RAW and PE SWE exhibit the lowest relative quantities of nitrogen (0.06 and 2.00%, respectively) with only a slight decrease and increase in the proportion of carbon in PE RAW and PE SWE relative to the SCG and SWE feedstocks (46.48 vs 53.01 and 59.39 vs 58.57%, respectively). This demonstrates the effectiveness of the alkali pretreatment in reducing nitrogen whilst maintaining sufficient carbon stocks for HTC.

Ultimate composition of protein extraction products and precursors
3.4 The hydrothermal SCG biorefinery
The following section presents the composition of the hydrochars produced from the HTC of raw SCG, SWE SCG, PE RAW and PE SWE SCG under the process conditions optimized for maximal calorific value and energy yield. The fuel properties of the different hydrochars are determined in order to establish the merit of the cascade processes within the proposed hydrothermal SCG biorefinery.
3.4.1 Hydrochar composition and fuel properties
Three solid products were formed from the HTC process: the crude unextracted hydrochar, primary char (PC) and secondary char (SC). SC, sometimes referred to as coke, are carbonized spherical deposits of condensed polymerisation and aromatisation products from the hydrolysis, dehydration and dissolution of the feedstock. The remaining solids constitute PC, or char, and result from the solid-to-solid conversion of the biomass [54,55,56]. Tar-like SC was obtained via a methanol/acetone extraction of the crude hydrochar, with PC forming the non-extractable solid residues.
The ultimate and proximate analysis results are displayed in Table 9. Overall, HTC increased the elemental carbon weight percentage and fixed carbon content whilst lowering volatile matter and ash content relative to the respective SCG feedstocks.
More specifically, all secondary chars exhibited higher carbon and hydrogen percentage compositions and lower oxygen and nitrogen content relative to the parent crude hydrochar, primary char and feedstock. Correspondingly, secondary char HHVs were the highest determined and consistent with lignite and sub-bituminous coal (> 37 MJ/kg). This result can be attributed to the energetic chemical bonds within the aromatic and polymeric products of the hydrothermal reactions, which condense from the liquid phase onto the solid matrix as secondary char. Lucian et al. reported similar findings for the primary and secondary char HTC products of the organic fraction of municipal waste (OFMSW) and olive mill waste (OMW) [38, 57, 58].
Although carbonisation was evident in primary char in terms of an increased weight percentage of carbon and HHV with respect to the feedstock, higher nitrogen and oxygen content with respect to the biomass, parent and secondary chars was determined for all primary char, which also exhibited the lowest calorific values of the char products.
Total extraction yields of secondary char and primary char with respect to the parent hydrochar range from 74 to 51% (HTC RAW–HTC PE SWE, Table 9), rendering a mass loss of 26–49%. Volatilisation of light organics during the work-up of the biocrude product of hydrothermal liquefaction has been attributed to mass imbalances of ~20%. [59, 60] The similar work-up for retention of secondary char (removal of extraction solvents under vacuum) likely results in the loss of light organics, accounting for mass discrepancies. Interestingly, the weight percentage of the secondary char derived from the HTC PE RAW and HTC PE SWE is greater than the non-protein extracted counterparts. This is likely due to increased porosity, surface area and decreased crystallinity of the solids as a result of the protein removal, affording a higher overall conversion [61].
Notably, the highest HHV obtained for the crude parent hydrochar HTC PE RAW (33.30 Mj/kg, Fig. 6) was higher than the calorific value of hydrochars investigated by Kim et al. and Afolabi et al. (26–27 and 31.60 Mj/kg, respectively) [6]. The reported hydrochars were produced under process conditions that were optimized solely for energy recovery efficiencies (T = 210–240 °C, t = 1 h, energy yield = 0.9–0.94, Kim et al.) or hydrochar yield, process energy and cost-effectiveness (T = 216.4 °C, t = 1 h, hydrochar yield = 64%, Afolabi et al.). Whilst exhibiting a lower energy yield and equivalent hydrochar yield (0.58 and 64%, respectively), the greater HHV and lower nitrogen content (0.23 vs < 3% wt in both studies) of HTC PE RAW exemplifies the proposed process for conversion of SCG into a maximally energy dense solid fuel which can be combusted with comparatively minimal emissions of nitrogen oxides [5, 6].

HHV (MJ/kg) and energy yield of crude hydrochars, primary (PC) and secondary chars (SC) produced from raw SCG, SWE SCG and the solid residues from the protein extraction of raw (PE RAW) and SWE (PE SWE) SCG
The highest carbon content and HHV were exhibited by HTC SWE SC (74.77%, 42.73 Mj/kg, respectively), along with a low composition of elemental nitrogen (0.75%). However, the penalty for the enrichment of carbon, resultant of the loss of oxygen and hydrogen from the biomass into the liquid and gas phase, is necessarily lower hydrochar yields. Thus, whilst the energy yield of HTC SWE SC is a moderate 0.60 when calculated with respect to the extraction yield from the parent crude hydrochar HTC SWE, the energy yield with respect to the SWE feedstock is ninefold lower: 0.07.
The effect of the carbonisation process on the feedstock is evident in the van Krevelen diagram (Fig. 7). Migration from the right upmost portion of the graph towards the lower left region illustrates the decrease in atomic O/C and H/C ratios as the elemental composition of the hydrochars approaches that of low-ranking coal. Secondary and primary chars appear to the upper left and lower right, respectively, of the parent crude hydrochar, reflecting the discussed compositional trend amongst the chars.

van Krevelen’s diagram of atomic O/C versus H/C ratio in SCG, primary (PC) and secondary chars (SC) produced from raw SCG, SWE SCG and the solid residues from the protein extraction of raw (PE RAW) and SWE (PE SWE) SCG.
3.4.2 Pyrolysis behaviour
Characteristic thermogravimetric peak regions in the pyrolysis of SCG and other lignocellulosic biomass correspond to the decomposition of hemicellulose, cellulose and lignin components. For hydrochars, peak regions compute with the decomposition of species remaining after the hydrolysis of the polymeric fractions. Qualitatively, the DTG of the crude hydrochars in argon atmosphere (a, Fig. 8) shows mass loss over three stages, representative of a preliminary (Tpeak = 240–300 °C) and secondary devolatilization (Tpeak = 310–335 °C) of an organic phase and char combustion (Tpeak = 430–460 °C). Notably for all primary char samples excluding HTC PE SWE PC (b, Fig. 8), volatile mass loss is over a single discrete phase (Tpeak = 310–340 °C), with gradual char combustion over a broader temperature range (400–800 °C). The highest peak reactivity of primary char devolatilization occurs at a higher temperature than the parent chars, which may signify increased thermal stability via the removal of secondary char from the matrix of the primary char. However, this is slightly misleading as the relative rates of peak devolatilization upon extraction of the secondary char increase from 0.009–0.020 s−1 to 0.011–0.041 s−1, for crude hydrochars and primary chars, respectively. This result, which is contrary to the observations by Lucian et al. for the extracted hydrochars of OFMSW, is attributed to the higher ash content of primary chars with respect to the parent hydrochar: inorganic material exerts a catalytic effect on the rate of devolatilization, reducing the separation between the holocellulose peaks [57, 62,63,64,65,66]. Therefore, whilst the crude hydrochars devolatilize more slowly at lower temperatures, primary chars exhibit increased thermal reactivity at slightly higher temperatures, through a more rapid devolatilization.

DTG devolatilization curves of crude parent hydrochars (left) and extracted hydrochars (right) in argon atmosphere
Overall, the DTG curves are indicative of the thermal instability of the secondary chars, which, combined with reported oxidative reactivity, likely confers low burnout temperatures and boiler efficiencies if utilized as a solid fuel [57, 67].
In terms of pretreatments, the fastest rate of devolatilization was observed for the char products from the protein pretreatment (0.025–0.041 s−1 for HTC PE SWE/RAW crude and primary chars); the slowest was observed for HTC RAW. This result is unsurprising as pretreatments disrupt the SCG matrix through complete or partial degradation of hemicellulose, swelling and interruption of cellulose crystallinity and structural linkages between holocellulose and lignin [68]. Thus, the extent of hydrolysis is augmented in the hydrochars of pretreated biomass, ultimately resulting in the formation of volatile species and polymeric fractions that exhibit a greater pyrolytic reactivity [69].
These observed differences in the first stage of pyrolysis will influence formation of NOx, ignition and flame stability, volatile components and the onset of char combustion, critical in the combustion performance of solid fuels [30].
3.4.3 Evaluation of the cascade processes
The proposed integrated hydrothermal biorefinery attempts to valorise SCG via three product suites: a high-value bioactive extract, a medium value protein extract and bulk production of a low-value solid fuel.
Following the schematic (Fig. 9), inputting 100 g of SCG feedstock into the SWE platform gives an aqueous phase with antioxidant activity and 0.31 g of CGA. Protein extraction of the residual solids (46.85 g) isolates a liquor from which a solid (23.89 g) containing 16.92% w/w protein can be precipitated. The residual solids from the protein extraction (22.96 g) are then carbonized, giving 14.69 g of crude hydrochar.

Major products and yields of the integrated hydrothermal and alkaline treatment SCG biorefinery
Alternatively, in the second scenario, the SWE platform is bypassed and more than half of the raw feedstock (53 g) is directly converted to an isolate containing 33% proteins. HTC of the solid residues (43 g) gives 16.34 g of the crude hydrochar.
Whilst the first scenario advantageously isolates an extract containing CGA (market price for green coffee extracts containing CGA range from 10 to 100 $/kg), the low yield and necessary work-up to prolong the shelf life of heat, light and oxygen labile bioactives will increase process costs [70]. The lower yield and protein content of SWE SCG PI as well as the relatively higher ash and nitrogen content (8.88 and 1.93%, respectively) and lower calorific value (26.92 MJ kg) of the crude hydrochar ultimately give a poorer solid fuel liable to fouling and higher NOx emissions.
The second scenario, which limits the output of the two platform SCG biorefinery to medium- and low-value products, necessarily reduces operation costs as well as almost doubling the yield of the protein isolate. The performance quality of the solid fuel is also enhanced, with lower ash and nitrogen content (2.62 and 0.23%, respectively) and higher HHV (33.30 MJ/kg). Higher overall conversion of the feedstock into the solid fuel product additionally demonstrates the advantage of the second scenario over the first.
4 Conclusion
The aim of this study was to develop a biorefinery that could produce value products from spent coffee grounds, utilizing the whole biomass whilst improving the end-product requirements. To this end, a series of hydrothermal processes were used, optimally producing a bioactive extract (containing 3.14 mg CGA/g SCG), a protein fraction (21.79–32.75% wt protein) and a hydrochar with improved calorific value (31.78 MJ/kg). The hydrochar, due to the protein extraction, also had a vastly reduced N content, making it suitable for commercial combustion. In addition, HILIC QToF-MS total amino acid quantification of SCG was performed for the first time, determining a higher than previously reported SCG protein content (21.79% wt). This result leads to the proposal of a new nitrogen protein conversion factor, 7.9, based on the average nitrogen content of SCG amino acids (12.66 vs the conventional 16%).
However, low CGA yields (0.31% wt feedstock) and necessary inclusion of downstream processes to concentrate, formulate and preserve antioxidant activity of the bioactive stream can negatively impact process margins. It was determined that omission of the bioactive stream from the biorefinery gave the highest yields and protein content of the protein isolate (SCG PI, 53 and 32.95%, respectively) and hydrochar (HTC PE RAW, 16.84%) with respect to SCG feedstock. The hydrochar also exhibited the highest calorific value and lowest nitrogen content (33.30 MJ/kg and 0.23%, respectively). In comparison, inclusion of the bioactive platform resulted in lower yields of both analogous products and inferior fuel qualities. Therefore, limiting the SCG biorefinery output to medium- and low-value products can increase commercial viability through enhanced yields, product performance and reduced operational costs.
Data availability
All supporting data is freely available in the University of Bath research portal.
References
Massaya J, Prates Pereira A, Mills-Lamptey B, Benjamin J, Chuck CJ (2019) Conceptualization of a spent coffee grounds biorefinery: a review of existing valorisation approaches. Food Bioprod Process 118:149–166
Codignole Luz F, Volpe M, Fiori L, Manni A, Cordiner S, Mulone V, Rocco V (2018) Spent coffee enhanced biomethane potential via an integrated hydrothermal carbonization-anaerobic digestion process. Bioresour Technol 256:102–109
Machado E, Mussatto S, Teixeira J, Vilanova M, Oliveira J (2018) Increasing the sustainability of the coffee agro-industry: spent coffee grounds as a source of new beverages. Beverages 4:105
Kwon EE, Yi H, Jeon YJ (2013) Sequential co-production of biodiesel and bioethanol with spent coffee grounds. Bioresour Technol 136:475–480
Afolabi OOD, Sohail M, Cheng Y-L (2020) Optimisation and characterisation of hydrochar production from spent coffee grounds by hydrothermal carbonisation. Renew Energy 147:1380–1391
Kim D, Lee K, Bae D, Park KY (2017) Characterizations of biochar from hydrothermal carbonization of exhausted coffee residue. Journal of Material Cycles and Waste Management 19:1036–1043
Jenkins RW, Ellis EH, Lewis EJ, Paterson M, Le CD, Ting VP, Chuck CJ (2017) Production of biodiesel from Vietnamese waste coffee beans: biofuel yield, Saturation and Stability are All Elevated Compared with Conventional Coffee Biodiesel. Waste and Biomass Valorization 8:1237–1245
Vardon DR, Moser BR, Zheng W, Witkin K, Evangelista RL, Strathmann TJ, Rajagopalan K, Sharma BK (2013) Complete utilization of spent coffee grounds to produce biodiesel, bio-oil, and biochar. ACS Sustain Chem Eng 1:1286–1294
Getachew AT, Cho YJ, Chun BS (2018) Effect of pretreatments on isolation of bioactive polysaccharides from spent coffee grounds using subcritical water. Int J Biol Macromol 109:711–719
Panzella L, Pérez-Burillo S, Pastoriza S, Martín MÁ, Cerruti P, Goya L, Ramos S, Rufián-Henares JÁ, Napolitano A, d’Ischia M (2017) High antioxidant action and prebiotic activity of hydrolyzed spent coffee grounds (HSCG) in a simulated digestion–fermentation model: toward the development of a novel food supplement. J Agric Food Chem 65:6452–6459
Mussatto SI, Ballesteros LF, Martins S, Teixeira JA (2011) Extraction of antioxidant phenolic compounds from spent coffee grounds. Sep Purif Technol 83:173–179
Ribeiro HM, Allegro M, Marto J, Pedras B, Oliveira NG, Paiva A, Barreiros S, Gonçalves LM, Simões P (2018) Converting spent coffee grounds into bioactive extracts with potential skin antiaging and lightening effects. ACS Sustain Chem Eng 6:6289–6295
ICO, World coffee consumption, in: W.c. consumption (Ed.) (2019)
Fernandes AS, Mello FVC, Thode Filho S, Carpes RM, Honório JG, Marques MRC, Felzenszwalb I, Ferraz ERA (2017) Impacts of discarded coffee waste on human and environmental health. Ecotoxicol Environ Saf 141:30–36
Rocha MVP, de Matos LJBL, de Lima LP, da Silva Figueiredo PM, Lucena IL, Fernandes FAN, Gonçalves LRB (2014) Ultrasound-assisted production of biodiesel and ethanol from spent coffee grounds. Bioresour Technol 167:343–348
Burniol-Figols A, Cenian K, Skiadas IV, Gavala HN (2016) Integration of chlorogenic acid recovery and bioethanol production from spent coffee grounds. Biochem Eng J 116:54–64
Obruca S, Benesova P, Kucera D, Petrik S, Marova I (2015) Biotechnological conversion of spent coffee grounds into polyhydroxyalkanoates and carotenoids. New Biotechnol 32:569–574
Lee M, Yang M, Choi S, Shin J, Park C, Cho S-K, Kim YM (2019) Sequential production of lignin, fatty acid methyl esters and biogas from spent coffee grounds via an integrated physicochemical and biological process. Energies 12:2360
Pedras BM, Nascimento M, Sá-Nogueira I, Simões P, Paiva A, Barreiros S (2019) Semi-continuous extraction/hydrolysis of spent coffee grounds with subcritical water. J Ind Eng Chem 72:453–456
Xu H, Wang W, Liu X, Yuan F, Gao Y (2015) Antioxidative phenolics obtained from spent coffee grounds (Coffea arabica L.) by subcritical water extraction. Ind Crop Prod 76:946–954
Mayanga-Torres P, Lachos-Perez D, Rezende C, Prado J, Ma Z, Tompsett G, Timko M, Forster-Carneiro T (2017) Valorization of coffee industry residues by subcritical water hydrolysis: recovery of sugars and phenolic compounds. J Supercrit Fluids 120:75–85
Ballesteros LF, Ramirez MJ, Orrego CE, Teixeira JA, Mussatto SI (2017) Optimization of autohydrolysis conditions to extract antioxidant phenolic compounds from spent coffee grounds. J Food Eng 199:1–8
Mendes JF, Martins JT, Manrich A, Sena Neto AR, Pinheiro ACM, Mattoso LHC, Martins MA (2019) Development and physical-chemical properties of pectin film reinforced with spent coffee grounds by continuous casting. Carbohydr Polym 210:92–99
Martinez-Saez N, García AT, Pérez ID, Rebollo-Hernanz M, Mesías M, Morales FJ, Martín-Cabrejas MA, del Castillo MD (2017) Use of spent coffee grounds as food ingredient in bakery products. Food Chem 216:114–122
Severini C, Caporizzi R, Fiore AG, Ricci I, Onur OM, Derossi A (2020) Reuse of spent espresso coffee as sustainable source of fibre and antioxidants. A map on functional, microstructure and sensory effects of novel enriched muffins. LWT 119:108877
Heidari M, Dutta A, Acharya B, Mahmud S (2019) A review of the current knowledge and challenges of hydrothermal carbonization for biomass conversion. J Energy Inst 92:1779–1799
Khataee A, Kayan B, Kalderis D, Karimi A, Akay S, Konsolakis M (2017) Ultrasound-assisted removal of Acid Red 17 using nanosized Fe3O4-loaded coffee waste hydrochar. Ultrason Sonochem 35:72–80
Querejeta N, Gil MV, Rubiera F, Pevida C (2018) Sustainable coffee-based CO2 adsorbents: toward a greener production via hydrothermal carbonization. Greenhouse Gases: Science and Technology 8:309–323
Kruse A, Koch F, Stelzl K, Wüst D, Zeller M (2016) Fate of nitrogen during hydrothermal carbonization. Energy Fuel 30:8037–8042
Glarborg P, Jensen AD, Johnsson JE (2003) Fuel nitrogen conversion in solid fuel fired systems. Prog Energy Combust Sci 29:89–113
Sanders JPM, Chen Z, Bruins ME (2013) A process for isolating proteins from solid protein-containing biomass selected from vegetable biomass, algae, seaweed and combinations thereof in: WO (Ed.)
Kambhampati S, Li J, Evans BS, Allen DK (2019) Accurate and efficient amino acid analysis for protein quantification using hydrophilic interaction chromatography coupled tandem mass spectrometry. Plant Methods 15:46–46
Apak R (2019) Current Issues in antioxidant measurement. J Agric Food Chem 67:9187–9202
Granato D, Shahidi F, Wrolstad R, Kilmartin P, Melton LD, Hidalgo FJ, Miyashita K, van Camp J, Alasalvar C, Ismail AB, Elmore S, Birch GG, Charalampopoulos D, Astley SB, Pegg R, Zhou P, Finglas P (2018) Antioxidant activity, total phenolics and flavonoids contents: should we ban in vitro screening methods? Food Chem 264:471–475
Panusa A, Zuorro A, Lavecchia R, Marrosu G, Petrucci R (2013) Recovery of natural antioxidants from spent coffee grounds. J Agric Food Chem 61:4162–4168
Choi B, Koh E (2017) Spent coffee as a rich source of antioxidative compounds. Food Sci Biotechnol 26:921–927
Ballesteros LF, Cerqueira MA, Teixeira JA, Mussatto SI (2015) Characterization of polysaccharides extracted from spent coffee grounds by alkali pretreatment. Carbohydr Polym 127:347–354
Volpe M, Wüst D, Merzari F, Lucian M, Andreottola G, Kruse A, Fiori L (2018) One stage olive mill waste streams valorisation via hydrothermal carbonisation. Waste Manag 80:224–234
Friedl A, Padouvas E, Rotter H, Varmuza K (2005) Prediction of heating values of biomass fuel from elemental composition. Anal Chim Acta 544:191–198
Sato T, Takahata T, Honma T, Watanabe M, Wagatsuma M, Matsuda S, Smith RL, Itoh N (2018) Hydrothermal extraction of antioxidant compounds from green coffee beans and decomposition kinetics of 3-o-caffeoylquinic acid. Ind Eng Chem Res 57:7624–7632
Ramón-Gonçalves M, Gómez-Mejía E, Rosales-Conrado N, León-González ME, Madrid Y (2019) Extraction, identification and quantification of polyphenols from spent coffee grounds by chromatographic methods and chemometric analyses. Waste Manag 96:15–24
Angeloni G, Masella P, Guerrini L, Innocenti M, Bellumori M, Parenti A (2019) Application of a screening design to recover phytochemicals from spent coffee grounds. Food Bioprod Process 118:50–57
Mäkelä M, Benavente V, Fullana A (2015) Hydrothermal carbonization of lignocellulosic biomass: effect of process conditions on hydrochar properties. Appl Energy 155:576–584
Wilk M, Magdziarz A, Kalemba-Rec I, Szymańska-Chargot M (2020) Upgrading of green waste into carbon-rich solid biofuel by hydrothermal carbonization: the effect of process parameters on hydrochar derived from acacia. Energy 202:117717
Ronix A, Pezoti O, Souza LS, Souza IPAF, Bedin KC, Souza PSC, Silva TL, Melo SAR, Cazetta AL, Almeida VC (2017) Hydrothermal carbonization of coffee husk: optimization of experimental parameters and adsorption of methylene blue dye. Journal of Environmental Chemical Engineering 5:4841–4849
Xiao H, Zhai Y, Xie J, Wang T, Wang B, Li S, Li C (2019) Speciation and transformation of nitrogen for spirulina hydrothermal carbonization. Bioresour Technol 286:121385
Braghiroli FL, Fierro V, Izquierdo MT, Parmentier J, Pizzi A, Delmotte L, Fioux P, Celzard A (2015) High surface – highly N-doped carbons from hydrothermally treated tannin. Ind Crop Prod 66:282–290
Sikka SS, Bakshi MPS, Ichhponani JS (1985) Evaluation in vitro of spent coffee grounds as a livestock feed. Agricultural Wastes 13:315–317
Cervera-Mata A, Pastoriza S, Rufián-Henares JÁ, Párraga J, Martín-García JM, Delgado G (2018) Impact of spent coffee grounds as organic amendment on soil fertility and lettuce growth in two Mediterranean agricultural soils. Arch Agron Soil Sci 64:790–804
Ciesielczuk T, Rosik-Dulewska C, Poluszyńska J, Miłek D, Szewczyk A, Sławińska I (2018) Acute toxicity of experimental fertilizers made of spent coffee grounds. Waste and Biomass Valorization 9:2157–2164
Cruz R, Mendes E, Torrinha Á, Morais S, Pereira JA, Baptista P, Casal S (2015) Revalorization of spent coffee residues by a direct agronomic approach. Food Res Int 73:190–196
Getachew AT, Chun BS (2017) Influence of pretreatment and modifiers on subcritical water liquefaction of spent coffee grounds: a green waste valorization approach. J Clean Prod 142:3719–3727
Lourenço SO, Barbarino E, De-Paula JC, da S. Pereira LO, Marquez UML (2002) Amino acid composition, protein content and calculation of nitrogen-to-protein conversion factors for 19 tropical seaweeds. Phycol Res 50:233–241
Volpe M, Goldfarb JL, Fiori L (2018) Hydrothermal carbonization of Opuntia ficus-indica cladodes: role of process parameters on hydrochar properties. Bioresour Technol 247:310–318
Castello D, Kruse A, Fiori L (2014) Supercritical water gasification of hydrochar. Chem Eng Res Des 92:1864–1875
Karayıldırım T, Sınağ A, Kruse A (2008) Char and coke formation as unwanted side reaction of the hydrothermal biomass gasification. Chem Eng Technol 31:1561–1568
Lucian M, Volpe M, Gao L, Piro G, Goldfarb JL, Fiori L (2018) Impact of hydrothermal carbonization conditions on the formation of hydrochars and secondary chars from the organic fraction of municipal solid waste. Fuel 233:257–268
Volpe M, Fiori L (2017) From olive waste to solid biofuel through hydrothermal carbonisation: the role of temperature and solid load on secondary char formation and hydrochar energy properties. J Anal Appl Pyrolysis 124:63–72
Raikova S, Le C, Beacham TA, Jenkins R, Allen M, Chuck C (2017) Towards a marine biorefinery through the hydrothermal liquefaction of macroalgae native to the United Kingdom. Biomass Bioenergy 107:244–253
Anastasakis K, Ross AB (2011) Hydrothermal liquefaction of the brown macro-alga Laminaria saccharina: effect of reaction conditions on product distribution and composition. Bioresour Technol 102:4876–4883
Meadows AL, Hawkins KM, Tsegaye Y, Antipov E, Kim Y, Raetz L, Dahl RH, Tai A, Mahatdejkul-Meadows T, Xu L, Zhao L, Dasika MS, Murarka A, Lenihan J, Eng D, Leng JS, Liu C-L, Wenger JW, Jiang H, Chao L, Westfall P, Lai J, Ganesan S, Jackson P, Mans R, Platt D, Reeves CD, Saija PR, Wichmann G, Holmes VF, Benjamin K, Hill PW, Gardner TS, Tsong AE (2016) Rewriting yeast central carbon metabolism for industrial isoprenoid production. Nature 537:694–697
Cui H, Yang J, Liu Z, Bi J (2002) Effects of remained catalysts and enriched coal minerals on devolatilization of residual chars from coal liquefaction. Fuel 81:1525–1531
Biagini E, Barontini F, Tognotti L (2006) Devolatilization of biomass fuels and biomass components studied by TG/FTIR technique. Ind Eng Chem Res 45:4486–4493
Várhegyi G, Antal MJ, Jakab E, Szabó P (1997) Kinetic modeling of biomass pyrolysis. J Anal Appl Pyrolysis 42:73–87
Jensen A, Dam-Johansen K, Wójtowicz MA, Serio MA (1998) TG-FTIR study of the influence of potassium chloride on wheat straw pyrolysis. Energy Fuel 12:929–938
Sørum L, Grønli MG, Hustad JE (2001) Pyrolysis characteristics and kinetics of municipal solid wastes. Fuel 80:1217–1227
Gao L, Volpe M, Lucian M, Fiori L, Goldfarb JL (2019) Does hydrothermal carbonization as a biomass pretreatment reduce fuel segregation of coal-biomass blends during oxidation? Energy Convers Manag 181:93–104
Pandey A (2008) Handbook of plant-based biofuels. CRC Press
Grigatti M, Montecchio D, Francioso O, Ciavatta C (2015) Structural and thermal investigation of three agricultural biomasses following mild-NaOH pretreatment to increase anaerobic biodegradability. Waste and Biomass Valorization 6:1135–1148
Pettinato M, Aliakbarian B, Casazza A, Perego P (2017) Encapsulation of antioxidants from spent coffee ground extracts by spray drying. Chem Eng Trans 57:1219–1224
Acknowledgements
The authors would like to thank Bio-bean for their financial assistance and Dr. Shaun Reeksting of the Material and Chemical Characterisation Facility (MC2) at the University of Bath (https://doi.org/10.15125/mx6j-3r54) for his technical support and guidance in this work.
Funding
The research was supported through an EPSRC CASE studentship co-funded through Bio-bean.
Author information
Authors and Affiliations
Contributions
JM carried out the majority of the experimental work and drafted the original manuscript, KC completed the experimental design work for the HTC reactions and BL funded and supervised the study. CC supervised the project, won the funding, conceived of the study and drafted the manuscript.
Corresponding author
Ethics declarations
Conflict of interest
The authors declare that they have no conflict of interest.
Code availability
None used.
Additional information
Publisher’s Note
Springer Nature remains neutral with regard to jurisdictional claims in published maps and institutional affiliations.
Rights and permissions
Open Access This article is licensed under a Creative Commons Attribution 4.0 International License, which permits use, sharing, adaptation, distribution and reproduction in any medium or format, as long as you give appropriate credit to the original author(s) and the source, provide a link to the Creative Commons licence, and indicate if changes were made. The images or other third party material in this article are included in the article's Creative Commons licence, unless indicated otherwise in a credit line to the material. If material is not included in the article's Creative Commons licence and your intended use is not permitted by statutory regulation or exceeds the permitted use, you will need to obtain permission directly from the copyright holder. To view a copy of this licence, visit http://creativecommons.org/licenses/by/4.0/.
About this article

Cite this article
Massaya, J., Chan, K.H., Mills-Lamptey, B. et al. Developing a biorefinery from spent coffee grounds using subcritical water and hydrothermal carbonisation. Biomass Conv. Bioref. 13, 1279–1295 (2023). https://doi.org/10.1007/s13399-020-01231-w
Received:
Revised:
Accepted:
Published:
Issue Date:
DOI: https://doi.org/10.1007/s13399-020-01231-w