
Abstract
Diagrams can serve as representational models in scientific research, yet important questions remain about how they do so. I address some of these questions with a historical case study, in which diagrams were modified extensively in order to elaborate an early hypothesis of protein synthesis. The diagrams’ modelling role relied mainly on two features: diagrams were modified according to syntactic rules, which temporarily replaced physico-chemical reasoning, and diagram-to-target inferences were based on semantic interpretations. I then explore the lessons for the relative roles of syntax, semantics, external marks, and mental images, for justifying diagram-to-target inferences, and for the “artefactual approach” to scientific models.
1 Introduction
Many scientific diagrams purport to depict features of the world. Some diagrams can also be employed as “representational models” (Frigg and Hartmann 2012), i.e. as systems that aim to represent the world and, in addition, enable scientific investigations to be carried out on the model, rather than on reality itself. As representational models, diagrams are manipulated in lieu of their representational targets (Giere 2002; Downes 2012). Chemical formulas have received particular attention in this respect. Berzelian formulas like ‘H2O’ depicted chemical substances and allowed that marks on paper, like ‘H’ and ‘2’, be re-arranged in order to learn about the chemical reactions in which the substances were involved (Klein 2001, 2003). Another example are structural formulas of cyclical compounds, where the compounds’ stability was investigated by measuring on paper geometric features of the formulas (Goodwin 2008).
While such studies have demonstrated that diagrams can function as representational models (or ‘models’ in what follows), much remains open about how they do so. This paper aims to address this gap by focusing on four central questions:
-
1.
What does a diagram’s syntax and semantics contribute to its modelling role? Diagrams have syntactic and semantic properties (Goodman 1976; Perini 2005b) and both are probably relevant when diagrams are employed as models (Klein 2001, 2003). But the specific contributions of these properties are unclear. It is possible, for instance, that both syntax and semantics guide the manipulation of diagrams, as Klein (2001) maintains for Berzelian formulas. But another possibility is a division of labour, whereby (1) manipulating diagrams is a matter of following syntactic rules and (2) drawing inferences is a matter of attributing meanings to syntactic marks. Adjudicating between these options requires a closer look at the respective roles of syntax and semantics. I will argue that a strict division of labour can underpin the modelling role of diagrams.
-
2.
What justifies diagram-to-target inferences? Scientists employ models because they allow inferences about what they represent. Understanding what justifies the inferences is therefore important. In the case of scale models, part of the story is the ease/difficulty with which it is possible to contort them into certain shapes (Goodwin 2008; Toon 2011). But diagrams like chemical formulas offer no physical resistance to removing a letter here, a numeral there, or adding a baroque squiggle for good measure. In the absence of constraints on permissible modifications, it is therefore hard to see how diagrams could yield valuable inferences about their targets. The challenge, which received little attention so far, is to identify constraints that are functionally analogous to the physical constraints of scale models. In this paper, I will argue that analogous constraints arise when diagrams have the properties of ‘interpreted formal systems’ (Haugeland 1985), i.e. when they are sets of meaningful symbols, which are modified according to syntactic rules that respect the symbols’ meanings. This guarantees that manipulations to diagrams are non-arbitrary and yield meaningful results.
-
3.
What functions as the model: physical marks or mental images? The external, physical format of Berzelian formulas made them easy to modify and turned them into efficient research tools (Klein 2003). Insofar as they are physical entities, chemical formulas seem to function much like two-dimensional versions of scale models (Goodwin 2008, 2009). But manipulating diagrams on paper also involves mental manipulations. In fact, Perini (2012) maintains that chemical formulas are mostly modified in the chemists’ minds, not on paper. If true, then modelling with diagrams is quite unlike modelling with scale models, where the physical object is manipulated. Perini (2012) concludes from such considerations that, strictly speaking and contrary to first appearances, diagrams as physical entities do not serve a modelling function. Against Perini, I will argue that they do.
-
4.
Do diagrams vindicate the “artefactual approach” to models? Knuuttila (2011) has rightly emphasised the material aspect of models. But she takes the emphasis a step further by advocating an “artefactual approach” to models, according to which scientists learn from models primarily because models are readily manipulated “concrete artefacts”, not because they correctly represent their targets (although they can do that, too). On her view, manipulability is more important for modelling than representation. Conceivably, however, the two capacities do not differ in their overall importance (however defined), but rather in being associated with distinct stages of the modelling process. I will explore and defend the latter view.
I will address these questions with the help of a case study that, as I will argue, provides specific answers. The case study allows a particularly detailed understanding how one type of diagram functioned as a model. And it therefore also indicates how other diagrams may function. The case study approach is appropriate, not because it justifies quick extrapolations to diagrams in general, but rather because it provides specific working hypotheses.
My case study is taken from the early days of molecular biology and concerns diagrams that were used to elaborate an early hypothesis about protein synthesis. The hypothesis postulated a mechanism for arranging amino acids, the components of proteins, into a unique sequence (Gamow 1954). I chose this example because it allows exploring the four questions together and because it involves a biological mechanism. Diagrams of biological mechanisms are known to play explanatory (e.g. Bechtel and Abrahamsen 2005; Perini 2005a) and heuristic roles (e.g. Sheredos et al. 2013; Bechtel 2016), but to my knowledge they have not yet been found to function as models.
The paper is structured as follows. Section 2 presents the case study. Sections 3 takes a closer look at the syntax and semantics of the diagrams used. Section 4 details how the diagrams served as models. Section 5 answers the four questions in the light of the case study.
2 Gamow’s diagrammatic method
2.1 Background
Protein synthesis is the process by which proteins are built up from their constituents, amino acids. The question of how amino acids are arranged into a linear chain emerged as an important research problem by the early 1950s. According to template hypotheses, the linear chain of amino acids is determined by a pre-existing molecule composed of a linear series of units, where each unit determines the position of one amino acid (‘template units’ in what follows). The cosmologist George Gamow (1954) proposed an early hypothesis of this kind.Footnote 1 He suggested that the pre-existing molecule is DNA and that the template units were cavities arranged in a continuous spiral around the outer surface of the double helix. Each cavity was thought to attract one amino acid, by means of an unspecified lock-and-key mechanism, and hold it in place until it would be linked to the neighbouring amino acids on either side. Iterating this process would eventually generate an amino acid chain. I shall refer to this idea as Gamow’s ‘hypothesis’ or ‘proposal’.
Gamow (1954) depicted the cavities in two ways. One type of diagram showed a rod with circles surrounding irregular shapes with concave sides (Fig. 1). The irregular shapes depicted the cavities, and each circle depicted one DNA base. The cross-shaped arrangement of the bases was supposed to form the cavity. It is easy to see from this diagram how the cavities were meant to line up around the surface of the double helix. The second type of diagram was employed in a table (Fig. 2). The table contained 20 ♢-shapes (or diamonds) with different combinations of numerals. Each diamond depicted one cavity, each numeral one base, and the horizontal diagonal depicted the hydrogen bonds connecting one complementary base pair (x–xʹ). There were 20 different diamonds because it was assumed that proteins were composed of 20 different kinds of amino acids and because Gamow conjectured that each cavity specified exactly one amino acid.
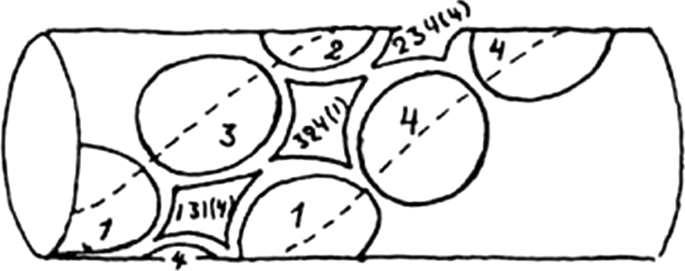
Diamond-shaped cavities on the surface of a DNA double helix (Gamow 1954 [his Fig. 1]). Circles—bases; shapes with concave sides—cavities. Reprinted with permission from Nature
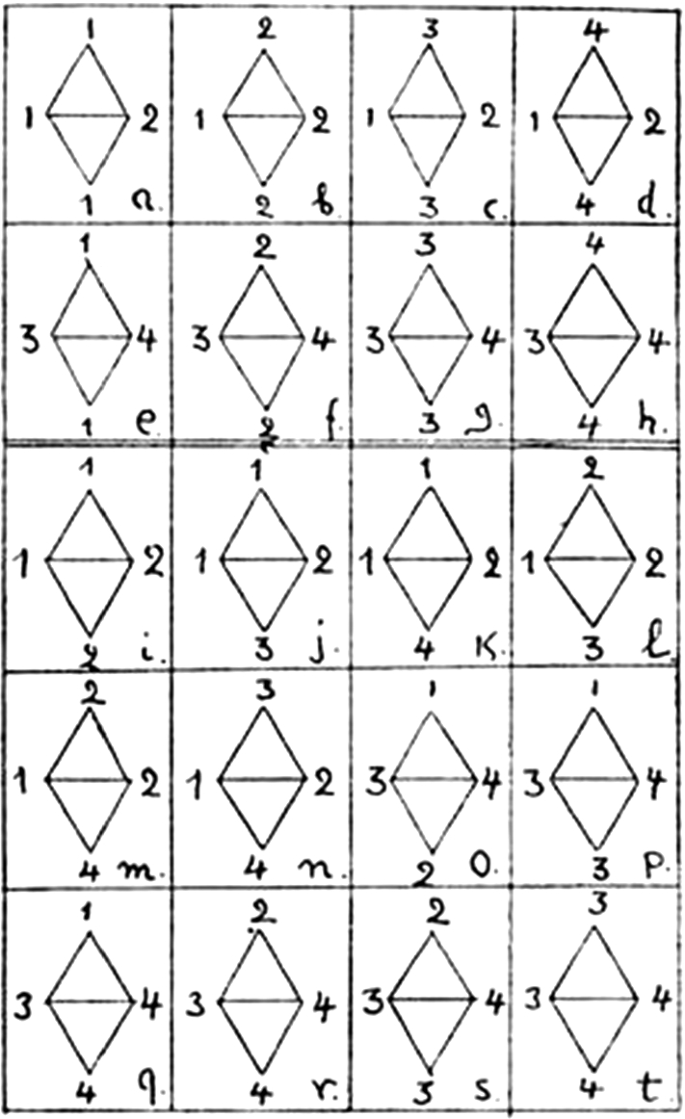
The twenty diamonds (Gamow 1954 [his Fig. 2]). Reprinted with permission from Nature
A crucial aspect was missing from Gamow’s (1954) proposal. It did not include any information about which of the 20 cavities specified which of the 20 amino acids. This issue was, however, addressed in subsequent research. One line of inquiry employed the second type of diagram, the ♢-shape, and was briefly described in a review article (Gamow et al. 1956). In the following I refer to this line of inquiry as Gamow’s ‘diagrammatic method’ or ‘procedure’. Its task was to establish a one-to-one assignment between the 20 ♢-shapes and the 20 amino acids. In other words, the procedure was meant to determine precisely which diamond depicted the leucine-specifying cavity, which diamond depicted the tyrosine-specifying cavity, and so on for all diamonds.
2.2 Overview
Gamow et al.’s (1956) description of the diagrammatic procedure was compressed and fragmentary, and only one figure illustrated the central process of modifying diagrams. Nevertheless, the description and figure contain sufficient clues for reconstructing the method. Here I summarize its main features (a more detailed reconstruction is given in Online Resource 1).
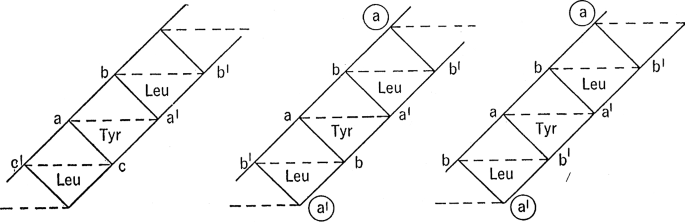
The starting point of the procedure was an empirical finding, namely that the protein insulin contained the amino acid sequence leucine-tyrosine-leucine. This finding had an immediate and obvious implication for Gamow’s (1954) hypothesis: the existence of a sequence of three DNA cavities in which the middle cavity specified tyrosine and the other two specified leucine. The procedure began by representing this implication in visual form: three ♢-shapes were concatenated and labelled ‘Leu’ or ‘Tyr’. The resulting diagram (Fig. 3, but without the corner labels) depicted one tyrosine-specifying cavity flanked by two leucine-specifying cavities.
Diagrams summarising the first steps of the diagrammatic method (Gamow et al. 1956, p. 46 [their Fig. 6]). Reprinted with permission from Elsevier
The next stage was adding corner labels to the three ♢-shapes. Of course, this could not be done by simply copying any two configurations of numerals from Gamow’s (1954) table (Fig. 2). It was, after all, unclear which of the 20 configurations were appropriate for the Leu- and Tyr-diamonds. Instead, the configurations had to be worked out in a painstaking process involving many individual steps.
Initially, the corners were labelled with letters a, b, c in alphabetical order (Tyr-diamond in the left diagram of Fig. 3). A given letter stood for any of the four DNA bases (adenine, guanine, cytosine, and thymine) and different letters could designate both different and identical bases. So, by labelling one corner a and the next b it was left open, not only which of the four bases a and b denoted, but even whether they denoted the same base. Any given letter-labelled corner revealed no more than a DNA base in that corner of the cavity.
Nevertheless, letter-labelling conveyed additional assumptions of Gamow’s (1954) hypothesis. One assumption was that each cavity contained one complementary base pair (depicted as x–xʹ). Another was that two adjacent cavities share two bases. This assumption was depicted by two adjacent ♢-shapes sharing two letters. For instance, the Tyr-diamond and its upper Leu-neighbour in the left panel of Fig. 3 shared letters b and a’. The fact that neighbouring diamonds shared letters was crucial for labelling them. It allowed applying what might be called the ‘complementarity rule’ for labelling the neighbours’ horizontal corner: since the upper Leu-diamond had b in its left horizontal corner (because its neighbour was the Tyr-diamond), one could add a bʹ, and only a bʹ, to the other (left panel of Fig. 3). Furthermore, label-sharing allowed applying the ‘matching rule’: since the bottom corner of the upper Leu-diamond had an aʹ (again, because its neighbour was the Tyr-diamond), one could add an aʹ, and only an aʹ, to the same corner of any other Leu-diamond, here to the lower Leu-diamond (the a’ inside the lower circle, middle panel of Fig. 3). In this way, the Leu-diamond was found to have letters bʹ–b horizontally, a at the top, and aʹ at the bottom.
However, the letter configuration b·a/aʹ·bʹ of the Leu-diamond did not yet represent the base configuration of a specific cavity, since the letters were deliberately ambiguous. The next task was therefore to reduce the ambiguity by replacing letters with a different set of symbols, i.e. numerals (1, 2, 3, 4). Unlike letters, different numerals always stood for different DNA bases. This convention enabled Gamow to render visually explicit the fact that the two bases forming a complementary base pair were distinct. Thus, letters x–xʹ were replaced with 1–2 or 3–4. While in this respect numerals were more restrictive than letters, they were equally ambiguous in another respect: a given numeral could stand for any of the four DNA bases, just like a letter. Replacing letters with numerals was therefore guided by the ‘replacement rule’, according to which a given letter could be replaced with any of the four numerals. This feature was employed in order to disambiguate the letter configuration b·a/aʹ·bʹ of the Leu-diamond. For instance, replacing both a–aʹ and b–bʹ in the Leu-diamond (b·a/aʹ·bʹ) with 3–4 yielded the β -configuration 3·3/4·4 (see Fig. 4). Enumerating all possible letter-to-numeral replacements revealed three additional numeral configurations for the Leu-diamond, α, γ, and δ (Fig. 4).

The four possible numeral configurations of the Leu-diamond (Gamow et al. 1956, p. 47 [their Fig. 7]). Reprinted with permission from Elsevier
A comparison showed that the four numeral configurations α, β, γ, and δ were identical with configurations i, t, o, and n (respectively) from Gamow’s (1954) table. It should be noted that it is possible to derive additional configurations for the Leu-diamond. For example, replacing both a–aʹ and b–bʹ with 4–3 (instead of 3–4) would yield an additional configuration, 4·4/3·3. But Gamow did not count that configuration as distinct due to the ‘rotation rule’ for modifying diamonds: two configurations count as the same configuration if (and only if) they can be transformed into one another by mentally rotating the diamond sideways or bottom-up by 180 ° (see Online Resource 2). This rule expressed Gamow’s assumption that swapping bases of a cavity sideways or bottom-up would make no functional difference, i.e. the cavity would specify the same amino acid.
Next, Gamow et al. (1956) sought to determine which diamonds represented the cavities for tyrosine, glutamic acid, and phenylalanine (see Online Resource 3). For this purpose, they used several additional amino acid sequences, among them phenylalanine–phenylalanine-tyrosine. Synthesizing this sequence required, on Gamow’s (1954) hypothesis, a corresponding series of cavities, which was represented as a series of Phe–Phe-Tyr diamonds. Gamow’s derivations revealed that the middle diamond was either the i or a-diamond from Gamow’s (1954) table. However, these diamonds needed to be assigned to the cavities for leucine, tyrosine, and/or glutamic acid during the derivation. They could therefore not be the configurations of a Phe-specifying cavity. So, Gamow and his co-workers performed further derivations based on the remaining possible configurations for Leu. But the outcome was always the same: any configuration derived for the middle diamond had already been attributed to other diamonds in earlier steps of the derivation. No configuration was left for the Phe-diamond. The consequences for Gamow’s proposal will be explored in Sect. 4.4.
This completes my summary of the diagrammatic method.
3 The syntax and semantics of diamond diagrams
Let us take a closer look at the syntactic and semantic features of diamond diagrams. Syntactic features of diamonds were shapes like ♢ and ‘4’. These shapes belonged to a set of elementary characters that could be combined into fully labelled diamonds. The fully labelled diamonds were complex characters that constituted “well-formed figures” (Perini 2005b). Online Resource 4 gives the definition of a well-formed figure for diamond diagrams. An important aspect of being well-formed was the exclusion of many potential shapes, such as ∇ and ‘5’. The fact that the elementary characters could be combined in a specific way into complex characters is important, because it rendered diamonds syntactically articulate in Goodman’s (1976) sense.Footnote 2
The diamonds also had semantic features (see Online Resource 5). Constituents such as ‘4’, the ♢-shape, and ‘Leu’ stood for a DNA base, a cavity, and the ability to specify leucine, respectively. A fully labelled diamond represented a template unit, i.e. an entity responsible for attracting one type of amino acid. The diamond-shape and corner labels reflected Gamow’s (1954) hypothesis that the template units were diamond-shaped cavities, each formed by four DNA bases. Concatenations of several diamonds depicted the linear arrangement of cavities along the surface of the DNA double helix. Furthermore, diamonds were semantically articulate. That is, the meaning of complex characters was determined by the meaning of its elementary characters and their spatial arrangement. For instance, the complex character that resulted from writing ‘Leu’ inside a ♢-shape represented a leucine-specifying cavity.Footnote 3
Clearly, Gamow’s (1954) diamonds had representational targets, namely the template units for amino acids. But as we know today, the actual template units are base triplets, not cavities. Since the diamonds depicted template units as diamond-shaped entities, each composed of four bases across both DNA strands, the diamonds misrepresented their targets. So, the diamonds failed to represent correctly, but this does not mean that they failed to represent simpliciter, in the sense of lacking representational content. It is widely acknowledged that misrepresentations are a subset of representations. To deny this would be to require that representations be veridical, which is an implausible requirement for models (Suárez 2015). In short, diamonds did represent the template units of amino acids, albeit incorrectly.
4 Modelling with diamond diagrams
We can now proceed to the central issue, the use of diagrams as models. By models I mean systems that (1) represent a target, whether correctly or incorrectly, and that (2) are the subjects of modifications that, ultimately, allow learning about targets (Frigg & Hartmann 2012).Footnote 4 The process of learning from models is often taken to involve three stages (Hughes 1997; Frigg and Hartmann 2012). Roughly, scientists construct a model that represents the target (‘denotation’); they explore the model in order to learn more about the model’s own features and behaviours (‘demonstration’); and they draw inferences from the model to the target (‘interpretation’). I endorse one important modification to Hughes’ (1997) accountFootnote 5: ‘denotation’ and ‘interpretation’ should be interpreted non-veridically. That is, denotation need not imply the target’s existence, and interpretation need not imply truth (Suárez 2015).
The aim of the following sections is to show that and how Gamow’s diamond diagrams were employed as models in Gamow et al.’s (1956) diagrammatic procedure. I structure the discussion along Hughes’ three modelling stages.
4.1 Denotation
Recall the first stage of the diagrammatic procedure (Sect. 2.2). The first stage consisted in concatenating three ♢-shapes and adding to each shape one label, such as ‘Leu’ or ‘Tyr’. Combining a ♢-shape with a label like ‘Leu’ sufficed to establish a representational relation between the shape and its target, a template unit. That is, the combination was sufficient to stipulate the shape as representing a leucine-specifying cavity. Specifying amino acids was the cavities’ main function. So, by representing the cavity as specifying leucine, the cavity was individuated in terms of its function; the cavity’s physical properties were left open, especially its base configuration.
In short, the first stage of the diagrammatic procedure established a representational relation between a diamond diagram and its target. This stage is a distinct phase of modelling, which Hughes (1997) called ‘denotation’. For Hughes (1997), however, denotation involved additional features. Denotation presupposed the existence of the target and the need to test denotation through demonstration and interpretation. But neither was required for learning from diamond diagrams. The feature of ‘denotation’ I wish to retain from Hughes’ account is the establishment of a ‘stand-in’ (or representational) relation between model and target.
4.2 Demonstration
During the next phase of modelling, a model is manipulated and explored with the aim of learning about it (‘demonstration’, Hughes 1997). The gradual addition and replacement of corner labels exemplifies this phase. This section explores how the modifications were implemented and what was learned as a result.
Consider first how the diagrams were modified. One important aspect of modifying diamonds was the use of a restricted symbol set. Only symbols from that set were added. Another key aspect was that adding corner labels to one diamond was not just relevant for that diamond, but also for labelling its neighbours. Since two neighbours shared two bases, labelling one diamond was tantamount to labelling two of the neighbour’s corners. Its two remaining corners were then labelled by taking the already assigned labels as inputs to the rules that guided the modifications. There were four such rules (Table 1). Although Gamow et al. (1956) did not articulate them explicitly, they can be shown to be operative by reconstructing the diagrammatic procedure and aiming to replicate its results.
The rules exhibited two features that deserve closer attention. First, the rules were sensitive only to the form or shape of the ‘input’ symbol, not to its meaning. For instance, when one horizontal corner of a diamond was labelled with an a-shape, then and only then should a’ be added to its opposite corner. The fact that a represented a nucleic acid base was irrelevant for determining what mark to add. Equally irrelevant were the physico-chemical properties of the depicted entities (bases), e.g. the effect of a base on the ability of a cavity to interact with amino acids. Rules for modifying symbols that are sensitive to the syntactic properties of a symbol, while insensitive to its semantic properties, are commonly known as “syntactic rules” (e.g. Haugeland 1985). The rules of Gamow’s diagrammatic method were syntactic in this sense.
Second, the rules were designed to reflect Gamow’s (1954) assumptions about protein synthesis (Table 1). The complementarity rule, for example, prescribed an x’-shape to one horizontal corner just in case there already was an x-shape in the other. The rule thus guaranteed the addition of labels for complementary bases. Note that the rules were purely syntactic even though they reflected Gamow’s assumptions. This is because a syntactic rule in the technical sense is simply one whose output symbol (e.g. aʹ) depends exclusively on the syntactic properties of the ‘input’ symbol (here, the a-shape). And the rules satisfied this condition.
I now turn to the second question: what did the modifications reveal about the diamond diagrams themselves? The main findings concerned the numeral configurations of functionally individuated ♢-shapes. The Leu-diamond, for example, was shown to have four possible configurations of numerals, α, β, γ, and δ (Fig. 4). And since identifying the possible configurations also revealed the impossible ones, it followed that the Leu-diamond could not have any of the other 20 − 4 = 16 configurations present in Gamow’s table (Fig. 2). Similar sets of possible and (larger) sets of impossible configurations were identified for the Tyr-, Glu-, and Phe-diamonds. None of these results were predictable from the initial, functionally defined ♢-shapes alone. Another, more specific finding concerned the Phe-diamond. The Phe-diamond turned out to have two possible configurations, both of which had already been assigned to other diamonds. So, although possible configurations of the Phe-diamond could be identified, an inconsistency ensued.
4.3 Interpretation
Gamow and his co-workers moved quickly from findings about diagrams to conclusions about their targets. The configurations of the Leu-diamond, for example, were taken to reveal something about the leucine-specifying cavity. In this section I consider how diagram-to-target inferences were achieved and how they were justified. The inferential step from the model to its target is the final stage of modelling (‘interpretation’, Hughes 1997).
Let us first look at how diagram-to-target inferences were implemented. Consider the inference from the Leu-diamond: the leucine-specifying cavity can have only one of the base configurations depicted by α, β, γ, and δ (Fig. 4). It is helpful to distinguish between two aspects of this inference and of analogous inferences from other diamond diagrams. First, the inference was about one specific type of cavity and, second, the cavity could have only one base configuration.
The first aspect was a matter of semantically interpreting physical marks on paper. Recall that the derived diagrams were semantically articulate complex characters, and so their meaning could be derived from their elementary marks. In the case at hand, the complex characters α, β, γ, and δ were each composed of the following elementary marks: a ♢-shape and a combination of numerals ‘1’, ‘2’, ‘3’, and/or ‘4’ in the corners (Fig. 4). Given the meanings of these marks and their arrangement, it followed that each complex character represented a leucine-specifying cavity with four distinct configurations of DNA bases. It might be objected that drawing this inference could not have been only a matter of semantic interpretation, but also required attending to the symbols’ syntactic properties. After all, different marks meant different things. And it is true that the inferences were, in this sense, affected by both semantics and syntax. But note that semantic interpretation included, and indeed commenced with, ascertaining the syntactic properties of derived, complex characters. Only then could it be decided what they depicted (and what they depicted was determined by the meaning of the elementary characters and their arrangement). Here I am concerned with identifying the meaning of the diagrams after they had been derived during the previous modeling phase.
The second aspect of the inference, i.e. the claim that the cavity could have only one base configuration, was not a matter of semantic interpretation. It was, instead, a consequence of Gamow’s (1954) assumption that each of the 20 amino acids were specified by only one of the 20 cavities, rather than by several. Hence, only one of the four complex characters could represent the leucine-specifying cavity. In conclusion, diagram-to-target inferences were achieved by means of combining parts of Gamow’s hypothesis with semantic interpretations of syntactic marks.
So far, we focused on the mechanics of diagram-to-target inferences. Now we ask how they were justified. Justification becomes an issue mainly because of the earlier stage of deriving diagrams. As noted in the introduction, diagrams offer no physical resistance to arbitrary changes. But the latter need to be prevented somehow in order to secure scientifically valuable inferences.
Two factors for preventing arbitrary changes involved syntax. One factor was the adherence to syntactic rules. Each modification, every addition of a letter and every replacement by a numeral, followed one of the rules. All other potential modifications were therefore illegitimate. In addition, all modifications drew on a pre-defined set of elementary marks and their combinations. All and only the marks and combinations taken from that set qualified as well-formed. Hence, baroque squiggles were prevented because they did not belong to the relevant set.
Yet, while adherence to these constraints was important, it was insufficient. For the constraints might themselves have been arbitrary. One can easily invent syntactic rules that draw from the same pre-defined set of marks but nevertheless generate nonsense (e.g. a rule to replace ‘a’ with ‘Phe’). Similarly, the meaning of individual marks might be inappropriate (e.g. ‘a’ denotes arm). Such pitfalls were avoided by strictly limiting what the marks and rules could express.
Marks with inappropriate meanings were excluded by requiring marks to reflect the assumptions of Gamow’s (1954) hypothesis. For instance, given the assumption that the template units were composed of DNA bases, there had to be marks that represented those bases (e.g. the numeral a). Nonsensical conclusions about, say, arms were thus avoided. Similarly, the syntactic rules were designed to express various parts of Gamow’s proposal. For example, his assumption that cavities contain one complementary base pair was reflected by the complementarity rule (Table 1). Implementing this rule was therefore the means for visualising the corresponding assumption.
The final ingredient for ensuring meaningful results were empirical data, i.e. the few known amino acid sequences. On Gamow’s proposal, these data immediately required the existence of a series of DNA cavities for exactly the amino acid sequence that had been found. We saw that the first stage of the diagrammatic procedure was to produce a diagram of these cavities. The significance of this move is now apparent: it ensured that the initial diagram (of concatenated diamonds) expressed both the data and Gamow’s proposal, rather than anything else; and it tied all subsequent modifications to the known sequence data.
4.4 The scientific value of modelling with diamond diagrams
Gamow’s (1954) original proposal for protein synthesis had a significant gap. While the proposal stipulated that each of the 20 cavities attracted one of the 20 amino acids, it remained silent about which cavity specified which amino acid. Gamow et al. (1956) sought to close this gap by manipulating diagrammatic representations of cavities, and they succeeded to some extent. For some amino acids it was possible to narrow down the set of possible cavities to a few candidates. The method revealed, for example, that the amino acid leucine was (purportedly) specified by one of four cavities (those represented by diagrams α, β, γ, and δ), although it could not determine the particular one. But the method had at least narrowed down the options from 20 to 4. Similar findings were made for the cavities (purportedly) specifying tyrosine, glutamic acid, and phenylalanine. The diagrammatic method therefore significantly elaborated Gamow’s original proposal. And elaborating hypotheses about biological mechanisms is recognized as an important part of mechanistic research.
It is worth pausing for a moment and consider how the diagrammatic procedure served to elaborate Gamow’s (1954) hypothesis. The key was to exploit as fully as possible the empirical data by working out what they meant for Gamow’s proposal. The means for working out the implications was the diagrammatic method. Obvious implications, i.e. the existence of cavities that could specify a known sequence of amino acids, could be depicted immediately as a series of functionally individuated diamonds. This made the implications explicit in visual form. The less obvious implications, i.e. a cavity’s base configuration, had to be worked out step-by-step. But again, the purpose of working with diagrams was to render these implications visually explicit, as well as Gamow’s theoretical assumptions. For instance, a diamond whose left corner had been labelled with mark c required, via the complementarity rule, that its opposite corner be labelled cʹ. Adding the mark cʹ to this diamond made visually explicit Gamow’s assumption that the cavity depicted by the diamond had a complementary base pair. Since each modification brought out an assumption of Gamow’s proposal or an implication from the empirical data, the final diagrams represented everything that could be learned from the sequence about Gamow’s hypothesis (and only that).
Another feature of the diagrammatic method worth emphasizing was the reliance on syntactic symbol manipulation. During the ‘demonstration phase’, the diagrams were modified based on the symbols’ syntactic properties and a set of syntactic rules. It was unnecessary to remember the symbols’ meanings or the rules’ assumptions; in fact, this might have been distracting. By contrast, diagram-to-target inferences relied on recovering the symbols’ semantics, a recovery enabled by the fact that the derived, complex character were semantically articulate.
Eventually, the method led to the refutation of Gamow’s (1954) hypothesis. The fact that the diagrammatic procedure was able to do so further underscores its scientific import. But what was the basis for this capacity? Recall the attempt to identify the cavity for phenylalanine (Sect. 2.2 and Online Resource 3). Working out the corner labels of the middle diamond in the series Phe-Phe-Tyr showed that it was impossible for that diamond to depict a phenylalanine-specifying cavity. It was therefore impossible for two phenylalanine-specifying cavities to occur next to a tyrosine-specifying cavity. Such a sequence of cavities could not exist. But without that sequence, the amino acid sequence phenylalanine–phenylalanine-tyrosine could not be synthesized in the way Gamow had proposed. Gamow’s (1954) proposal was thus refuted. Francis Crick employed the diagrammatic method to reach the same conclusion (Stegmann online first).
How the diagrammatic method contributed to this refutation can be clarified with a semi-formal reconstruction:
-
1.
The amino acid sequence phenylalanine–phenylalanine-tyrosine exists
[Sanger’s sequence data]
-
2.
The amino acid sequence phenylalanine–phenylalanine-tyrosine is caused by a corresponding sequence of DNA cavities
[application of Gamow’s (1954) hypothesis to Sanger’s sequence data]
-
3.
The corresponding sequence of cavities does not exist
[Inference from diagrams]
- C1:
-
The amino acid sequence phenylalanine–phenylalanine-tyrosine is not caused by a corresponding sequence of cavities
[1–3]
- C2:
-
Gamow’s (1954) hypothesis is false
[2, C1]
Sanger’s data demonstrated the existence of a specific sequence of amino acids (premise 1), whose production would have required a corresponding sequence of DNA cavities (premise 2). However, the diamond diagrams implied that this sequence could not exist (premise 3). Premise 3 was an inference both generated and justified by diamond diagrams, and the diagrams had been derived via the diagrammatic method. So, the method contributed to the refutation of Gamow’s hypothesis in virtue of supplying one of its premises.
5 Implications
It is time to apply the lessons of diamond diagrams to the general questions about modelling with diagrams.
-
1.
What does a diagram’s syntax and semantics contribute to its modelling role?
The presence of syntactic and semantic features in diagrams is well-established (Goodman 1976; Klein 2003; Perini 2005b), but their specific contributions to modelling received little attention. One exception is Klein’s (2003) work on Berzelian formulas. According to Klein,
“Berzelian formulas were easy to manipulate. The only syntactic rule which had to be followed was the additivity of the symbols.” 276 “[T]he syntax of these tools [Berzelian formulas] and aspects of their semantics which had been black-boxed in their first practical applications guided chemists’ work on paper and contributed to conceptual development” 267
For Klein, both syntactic and semantic properties of Berzelian formulas contributed to “conceptual development”. In addition, Klein maintains that both syntax and semantics “guided chemists’ work on paper”, which I take to mean that they affected how Berzelian formulas were manipulated on paper: manipulating Berzelian formulas depended on one syntactic rule (“additivity”) and on their meaning (“aspects of their semantics”). However, Klein leaves open which semantic aspects were involved and how they contributed to manipulating the formulas.
The general importance of both syntax and semantics is manifest in the case of diamond diagrams, too. But the diamond diagrams show that syntax and semantics became important at different stages of modelling. The modification of diamond diagrams (‘demonstration’) depended only on their syntactic properties insofar as their semantic properties had no influence on how they were modified. Semantic properties became important once the changes had been made and scientists wanted to draw inferences from the amended diagrams (‘interpretation’). These inferences relied on the fact that the shapes had pre-specified meanings and were semantically articulate.
This division of labour between syntax and semantics may apply to other types of diagrams, as well. For instance, the additivity rule of Berzelian formulas was sensitive to the syntactic properties of the marks, but it is unclear precisely which aspects of their semantics, if any, co-determined the rule’s outcome. On closer inspection it may therefore turn out that Berzelian formulas implemented the same division of labour. Moreover, the division makes sense in the light of what is known about the psychology of reasoning with diagrams. Several psychological studies have shown that diagrammatic reasoning eases the cognitive load by replacing explicit propositional with visuo-spatial reasoning (reviewed in Hegarty et al. 2015). Francis Crick’s handwritten notes strongly suggest that the diagrammatic method supported visuo-spatial reasoning and external information storage (Stegmann online first). Presumably, Gamow and his co-workers also exploited these advantages when they relied on visual shapes and syntactic rules, while bracketing the symbols’ meanings and physico-chemical considerations. The ease with which Berzelian formulas could be manipulated (Klein 2003) indicates that they, too, may have afforded similar benefits.
-
2.
What justifies diagram-to-target inferences?
Unlike scale models, diagrams offer no physical resistance to arbitrary modifications. In the absence of analogous constraints, it is therefore hard to see how diagrams could serve as models. As we saw, however, Gamow et al.’s (1956) diagrammatic procedure did provide such constraints. The constraints consisted in the limitations that were imposed, by fiat, on the syntax and semantics of both the symbols and their transformation rules. Viewed in its entirety, the procedure was the sort of formalism that is well captured by Haugeland’s (1985) notion of ‘interpreted formal systems’. Interpreted formal systems are composed of a set of tokens to which are assigned meanings (hence ‘interpreted’); they can be modified according to purely syntactic rules (hence ‘formal’) in order to derive possible token configurations; the latter are themselves meaningful (e.g. the truth-preserving formalisms of predicate logic). The power of interpreted formal systems is mainly due to the fact that “simply playing by the rules is itself a surefire way to make sense.” (106) In just this way, playing by the rules of diamond diagrams was bound to generate meaningful results.Footnote 6 The benefits that formalisms and notational systems provide for modeling have been recognized for mathematical formalisms and other systems, like Feynman diagrams (Gelfert 2016). It is a distinct possibility that other diagrams, especially chemical formulas, are powerful diagrammatic tools for the same reason.
A comparison with “mature mathematical formalisms” (Gelfert 2011, MMFs in what follows) is instructive. MMFs are composed of a mathematical framework, a fundamental physical theory, and rules for applying the framework to specific physical systems. An example is the formalism of so-called creation and annihilation operators (using the mathematical framework of operator algebra) in quantum physics (the physical theory). The framework can be deployed for modelling, say, the behavior of delocalized electrons in a metal. Deploying it for this task requires adherence to certain notational rules, e.g. that the operators only occur in pairs in mathematical equations. Such rules are crucial because they embody theoretical commitments about the target system, in this case a commitment to conservation of particle number. This brief sketch of MMFs suggests interesting parallels with the diagrammatic method. Both systems include rules for constructing and interpreting notations; the rules embody theoretical assumptions pertinent to the modelling task; and following the rules ensures that the results of notational manipulations are empirically meaningful. In other respects, however, the two systems appear to differ. The rules of MMFs are not part of their mathematical frameworks. They rather arise from, and are entrenched by, successful applications. By contrast, the diagrammatic method neither deployed pre-existing formalisms, nor added target-specific rules. Instead, the method was highly localized from the start. It was a unified and tailor-made device for modelling Gamow’s hypothetical DNA cavities.
-
3.
What functions as the model: physical marks or mental images?
Perhaps the most explicit argument for the modelling role of chemical formulas has been provided by Goodwin (2008, 2009). Chemical formulas can be manipulated easily as marks on paper, and they are sources of model-to-target inferences. For Goodwin, they function much like two-dimensional versions of scale models. Perini (2012) objected that the model consists in the scientists’ mental images of external marks, not in the marks themselves. This is because in contrast to scale models, chemical formulas are mostly modified in the chemists’ minds, not on paper. In order to address the disagreement, let us return to diamond diagrams and ask which entities played the roles of models: external marks, mental images, or some combination thereof? Following Hughes (1997), I focus on two essential roles of models, namely (1) acting as the object of inquiry and (2) being the source of inferences to targets.
Consider, first, the source of diamond-to-cavity inferences. Take the conclusion that the leucine-specifying cavity has one out of four possible base configurations (Sect. 2.2). This conclusion was based on the Leu-diamond having four possible configurations of labels (α, β, γ, or δ). Each of these configurations needed to be derived via a series of modifications and then compared to the others in order to confirm their distinctness. For example, α needed to be compared with β, γ, and δ, and each comparison might involve manipulations like rotating diamonds around their axes. It is hard to see how such complex and multiple comparisons could have been achieved without externally recording the result of each series of modifications, so as to make the result permanently available. In practice, therefore, the source of diagram-to-cavity inferences were external diagrams.
Next, consider the object of investigation when amending diamond diagrams, e.g. when deriving numeral- from letter-labelled Leu-diamonds (Sect. 2.2). One recognizes the letters in the diamond’s four corners and asks how that complex character, the external diamond, should and can be changed. One chooses a letter-to-numeral mapping, mentally replaces the letters with the corresponding numerals, and finally draws a diamond with numerals. The next step is to ask how the resulting diagram should and can be amended further, and so on. Mental manipulations are clearly important here. But note how they interact with external marks. The external marks are the input into a mental manipulation; this manipulation yields an output that is drawn on paper, which then becomes the input to the subsequent mental manipulation, and so on. At each step, we consider the external diagrams and inquire which changes are permissible and/or obligatory. The immediate object of this inquiry into permissible changes is the series of external marks. This is true even if Perini (2012) is correct in maintaining that the changes themselves are performed in the mind, and even if the differences between consecutive stages of external marks result from repeatedly manipulating the mental image of a given external mark.
An objection can be raised here. I described the modelling process as a repeated inspection of external diagrams. Yet someone with exceptional memory and skill may be able to proceed without fixing the results of a given mental manipulation on paper. They may be able to simply hold the resulting diagram in their mind and proceed immediately to the next mental manipulation. In the extreme, modelling with diagrams could be an entirely mental affair. But this objection would miss the mark. At stake is the question of how external marks are used when and to the extent they are employed when amending diamond diagrams. And when they are employed it is evident that they are the object of investigation and the source of inferences, and therefore play the roles of models.
Perhaps more importantly, psychological research suggests that modifying diamonds should have relied on external marks. Amending corner labels and rotating diamonds sideways or bottom-up were instances of visuospatial reasoning, which is a capacity that is known to be facilitated by external representations. External representations improve especially the efficiency (speed and accuracy) of task decomposition (Hegarty et al. 2015). Task decomposition is the strategy of dividing complex mental manipulations into manageable units and solving them individually (reviewed in Hegarty and Stull 2012). The many steps of Gamow’s diagrammatic method are a case in point. So, the most efficient and reliable application of the diagrammatic method would maximise the use of external marks. Since the psychological findings hold for a broad range of diagrams, manipulating (say) chemical formulas via external marks has probably similar advantages.
-
4.
Do diagrams vindicate the “artefactual approach” to models?
Knuuttila (2011) rightly emphasized the concrete, material nature of models. Diamond diagrams illustrate the material aspect well because they were, in Knuuttila’s terminology, “concrete artefacts” and served as “external tools for thinking”. We saw above that psychological research has shown the importance of utilizing external tools for visuospatial reasoning. However, Knuuttila takes this emphasis a step further by contrasting her “artefactual approach” with the “representational view”: the artefactual approach “provides an alternative to the representational view” of models and is, moreover, superior because it “better capture[s] many of their [the models’] epistemic qualities” (Knuuttila 2011, p. 270 and 263, respectively). For Knuuttila, the representational view maintains that a system can model a target when (and because) it represents the target correctly. On her artefactual view, a system serves as a model to the extent it is an external artefact that is readily manipulated (which is compatible with the system also having representational functions, e.g. p. 270).
We have seen the importance of external, physical marks for modifying diamond diagrams. The marks on paper were clearly “external tools for thinking”. But this does not mean that Gamow’s diagrammatic procedure supports the artefactual view as opposed to the representational view. This is because diamond diagrams had both artefactual and representational aspects, and both were equally essential for modelling. The difference between the two aspects was not that one was more important than the other, but rather that they were associated with different stages of the overall modeling process. During the second phase of the process (‘demonstration’), diamonds functioned as external thinking tools because their representational properties were irrelevant for modifying them; what mattered were their syntactic features. But during the third phase (‘interpretation’), diamonds needed to be considered as representations, for otherwise it would have been impossible to infer anything about DNA cavities. Hence, there was no contrast, and no difference in importance, between diamonds functioning as external tools as opposed to representations. Knuuttila’s distinction is not so much a description of two competing views about how models work. Instead, it points to two distinct, but complementary uses of a model.
6 Conclusion
This article sought to answer several questions about how diagrams can be employed for the purposes of scientific modelling. One question is about what the syntactic and semantic properties of diagrams contribute to modelling. Based on a historical case study, I argue that there can be a strict division of labour in the sense that the two classes of properties are essential for distinct stages of the modelling process (i.e. ‘demonstration’ and ‘interpretation’, respectively) and that, furthermore, this division is likely to facilitate modelling. A second question concerns the justification for using variously modified marks on paper as the basis for inferences about real-world targets. I found that diagrams and their modifications constituted an ‘interpreted formal system’ and that, consequently, modifying marks can be a reliable way of generating diagrammatic results that are interpretable in terms of real-world targets. The third question is whether, in the case of diagrams, the role of a scientific model is played by the external marks or by their mental images. It was found that external marks played two characteristic roles of models, whereas their mental images did not. This suggests that the external marks functioned as the model. Given that diagrams are material artefacts, the final question addressed in this article is whether diagrams vindicate the artefactual approach to scientific models. I argue that they do not. For the representational features of diagrams were as important for modelling as their capacity to serve as external reasoning tools. Overall, the case study demonstrates in some detail how a specific diagrammatic system was deployed for scientific modelling and, therefore, how diagrams may be used for modelling more generally. Whether other diagrammatic systems, like chemical formulas, are in fact deployed in the same way remains to be seen.
Notes
The emphasis in this paper on semantics, syntax, and models may be reminiscent of the syntax-semantics debate about scientific theories. But my goal is to identify features of a type of diagram that are important for modelling, and I make no claims about whether they are relevant to the ontology of diagrams. I also do not aim to contribute to an ontological account of scientific theories or of models in the sense of non-linguistic, set-theoretical structures that interpret theories.
Interestingly, diagrammatic reasoning figures prominently in Hughes’ (1997) argument. His argument is based on Galileo’s use of diagrams for investigating the movement of objects. Galileo’s diagrammatic method differs markedly from Gamow et al.’s (1956). Gamow’s diagrams represented physical objects and components of a mechanism; Galileo represented physical properties (e.g. speed) of a generic object that was not part of a mechanism. Furthermore, while Galileo’s investigated how properties interrelate, Gamow conducted mechanistic research by identifying physical properties of functionally defined entities. And whereas Gamow’s method relied on the successive transformation of diagrams according to syntactic rules, Galileo’s appears to have relied on comparing the properties of two diagrams. A more detailed comparison between these methods is a topic for another time.
The formalism of modifying diamonds can raise the question of whether the diagrammatic form of representation was essential for modelling or whether it was merely a convenient way of representing a hypothesis whose content might just as well have been expressed with a set of axioms. Psychological research suggests that the diagrammatic form was essential, because that form was what allowed tackling the problem by means of visuo-spatial reasoning. But this does not exclude the possibility of expressing the content in axiomatic form. In this context it is worth mentioning the notorious difficulty of drawing a principled distinction between language-like and image-like representations.
References
Bechtel, W. (2016). Using computational models to discover and understand mechanisms. Studies in History and Philosophy of Science, 56, 113–121.
Bechtel, W., & Abrahamsen, A. (2005). Explanation: a mechanist alternative. Studies in History and Philosophy of Biological and Biomedical Sciences, 36(2), 421–441.
Downes, S. M. (2012). How much work do scientific images do? Spontaneous Generations: A Journal for the History and Philosophy of Science, 6(1), 115–130.
Frigg, R., & Hartmann, S. (2012). Models in science. In E. N. Zalta (Ed.), The Stanford Encyclopedia of Philosophy. https://plato.stanford.edu/archives/sum2018/entries/models-science/.
Gamow, G. (1954). Possible relation between deoxyribonucleic acid and protein structures. Nature, 173, 318.
Gamow, G., Rich, A., & Yčas, M. (1956). The problem of information transfer from the nucleic acids to proteins. Advances in Biological and Medical Physics, 4, 23–68.
Gelfert, A. (2011). Mathematical formalisms in scientific practice: from denotation to model-based representation. Studies in History and Philosophy of Science, 42(2), 272–286.
Gelfert, A. (2016). How to do science with models: A philosophical primer. Dordrecht: Springer.
Giere, R. N. (2002). Models as parts of distributed cognitive systems. In L. Magnani & N. J. Nersessian (Eds.), Model-based reasoning: Science, technology, values (pp. 227–241). New York: Kluwer Academic.
Goodman, N. (1976). Languages of art. Indianapolis: Hackett.
Goodwin, W. (2008). Structural formulas and explanation in organic chemistry. Foundations of Chemistry, 10(2), 117–127.
Goodwin, W. (2009). Visual representations in science. Philosophy of Science, 76(3), 372–390.
Haugeland, J. (1985). Artificial intelligence: The very idea. Cambridge: MIT Press.
Hegarty, M., Stieff, M., & Dixon, B. (2015). Reasoning with diagrams: Towards a broad ontology of spatial thinking strategies. In D. R. Montello, K. E. Grossner, & D. G. Janelle (Eds.), Space in mind: Concepts for spatial learning and education (pp. 75–98). Cambridge: MIT Press.
Hegarty, M., & Stull, A. T. (2012). Visuospatial thinking. In K. J. Holyoak & R. G. Morrison (Eds.), The Oxford handbook of thinking and reasoning (pp. 606–630). Oxford: Oxford University Press.
Hughes, R. I. G. (1997). Models and representation. Philosophy of Science, 64, S325–S336.
Judson, H. F. (1996). The eighth day of creation. Cold Spring Harbor: Cold Spring Harbor Laboratory Press.
Kay, L. E. (2000). Who wrote the book of life? A history of the genetic code. Stanford: Stanford University Press.
Klein, U. (2001). Paper tools in experimental cultures. Studies in the History and Philosophy of the Biological and Biomedical Sciences, 32(2), 265–302.
Klein, U. (2003). Experiments, models, paper tools: Cultures of organic chemistry in the nineteenth century. Stanford: Stanford University Press.
Knuuttila, T. (2011). Modelling and representing: An artefactual approach to model-based representation. Studies in History and Philosophy of Science, 42(2), 262–271.
Olby, R. (1994). The path to the double helix: The discovery of DNA. New York: Dover Publications.
Perini, L. (2005a). Explanation in two dimensions: diagrams and biological explanation. Biology and Philosophy, 20(2–3), 257–269.
Perini, L. (2005b). The truth in pictures. Philosophy of Science, 72(1), 262–285.
Perini, L. (2012). Truth-bearers or truth-makers? Spontaneous Generations: A Journal for the History and Philosophy of Science, 6(1), 142–147.
Sheredos, B., Burnston, D., Abrahamsen, A., & Bechtel, W. (2013). Why do biologists use so many diagrams? Philosophy of Science, 80(5), 931–944.
Stegmann, U. E. (2016). ‘Genetic coding’ reconsidered: An analysis of actual usage. British Journal for the Philosophy of Science, 67(3), 707–730.
Stegmann, U. E. (online first). Physical models and embodied cognition. Synthese. https://doi.org/10.1007/s11229-018-01927-7.
Suárez, M. (2015). Scientific representation, denotation, and fictional entities. In U. Mäki, I. Votsis, S. Ruphy, & G. Schurz (Eds.), Recent developments in the philosophy of science: EPSA13 Helsinki (pp. 331–341). Dordrecht: Springer.
Toon, A. (2011). Playing with molecules. Studies in History and Philosophy of Science Part A, 42(4), 580–589.
Acknowledgements
An earlier version of this paper was presented at two workshops in 2016 (“Many Methods, One Biology?”, Munich, and “Representing Scientific Results”, Kassel). I thank participants for stimulating discussions. Special thanks to Christian Joas, Tilmann Massey, Robert Meunier, Kärin Nickelsen, and Raphael Scholl. I would also like to acknowledge the helpful comments by three anonymous reviewers. Springer/Nature and Elsevier granted permissions to reproduce copyrighted material.
Author information
Authors and Affiliations
Corresponding author
Ethics declarations
Conflict of interest
The authors declare that they have no conflict of interest.
Additional information
Publisher's Note
Springer Nature remains neutral with regard to jurisdictional claims in published maps and institutional affiliations.
Electronic supplementary material
Below is the link to the electronic supplementary material.
Rights and permissions
Open Access This article is distributed under the terms of the Creative Commons Attribution 4.0 International License (http://creativecommons.org/licenses/by/4.0/), which permits unrestricted use, distribution, and reproduction in any medium, provided you give appropriate credit to the original author(s) and the source, provide a link to the Creative Commons license, and indicate if changes were made.
About this article

Cite this article
Stegmann, U.E. Scientific modelling with diagrams. Synthese 198, 2675–2694 (2021). https://doi.org/10.1007/s11229-019-02239-0
Received:
Accepted:
Published:
Issue Date:
DOI: https://doi.org/10.1007/s11229-019-02239-0