Abstract
Thousands of exoplanets have now been discovered with a huge range of masses, sizes and orbits: from rocky Earth-like planets to large gas giants grazing the surface of their host star. However, the essential nature of these exoplanets remains largely mysterious: there is no known, discernible pattern linking the presence, size, or orbital parameters of a planet to the nature of its parent star. We have little idea whether the chemistry of a planet is linked to its formation environment, or whether the type of host star drives the physics and chemistry of the planet’s birth, and evolution. ARIEL was conceived to observe a large number (~1000) of transiting planets for statistical understanding, including gas giants, Neptunes, super-Earths and Earth-size planets around a range of host star types using transit spectroscopy in the 1.25–7.8 μm spectral range and multiple narrow-band photometry in the optical. ARIEL will focus on warm and hot planets to take advantage of their well-mixed atmospheres which should show minimal condensation and sequestration of high-Z materials compared to their colder Solar System siblings. Said warm and hot atmospheres are expected to be more representative of the planetary bulk composition. Observations of these warm/hot exoplanets, and in particular of their elemental composition (especially C, O, N, S, Si), will allow the understanding of the early stages of planetary and atmospheric formation during the nebular phase and the following few million years. ARIEL will thus provide a representative picture of the chemical nature of the exoplanets and relate this directly to the type and chemical environment of the host star. ARIEL is designed as a dedicated survey mission for combined-light spectroscopy, capable of observing a large and well-defined planet sample within its 4-year mission lifetime. Transit, eclipse and phase-curve spectroscopy methods, whereby the signal from the star and planet are differentiated using knowledge of the planetary ephemerides, allow us to measure atmospheric signals from the planet at levels of 10–100 part per million (ppm) relative to the star and, given the bright nature of targets, also allows more sophisticated techniques, such as eclipse mapping, to give a deeper insight into the nature of the atmosphere. These types of observations require a stable payload and satellite platform with broad, instantaneous wavelength coverage to detect many molecular species, probe the thermal structure, identify clouds and monitor the stellar activity. The wavelength range proposed covers all the expected major atmospheric gases from e.g. H2O, CO2, CH4 NH3, HCN, H2S through to the more exotic metallic compounds, such as TiO, VO, and condensed species. Simulations of ARIEL performance in conducting exoplanet surveys have been performed – using conservative estimates of mission performance and a full model of all significant noise sources in the measurement – using a list of potential ARIEL targets that incorporates the latest available exoplanet statistics. The conclusion at the end of the Phase A study, is that ARIEL – in line with the stated mission objectives – will be able to observe about 1000 exoplanets depending on the details of the adopted survey strategy, thus confirming the feasibility of the main science objectives.
1 Introduction
Thousands of exoplanets have now been discovered with a huge range of masses, sizes and orbits: from rocky Earth-size planets to large gas giants grazing the surface of their host star. However, the essential nature of these exoplanets remains largely mysterious: there is no known, discernible pattern linking the presence, size, or orbital parameters of a planet to the nature of its parent star. We have little idea whether the chemistry of a planet is linked to its formation environment, or whether the type of host star drives the physics and chemistry of the planet’s birth, and evolution.
Even within the limits of our current observational capabilities, studies of extrasolar planets have provided us with a clearer view of the place that the Solar System and the Earth occupy in the galactic context. As a result, a great deal of effort has been, and is being, spent to increase the number of known extrasolar planets (~3700 at the time of writing) and overcome the limits imposed by the incomplete sample, due to observational bias, currently available (Fig. 1).

Currently known exoplanets, plotted as a function of distance to the star (up to 30 AU) and planetary radii. The graph suggests a continuous distribution of planetary sizes – from sub-Earths to super-Jupiters – and planetary temperatures that span two orders of magnitude
On the same plot we show the conversion of the orbital period into planetary equilibrium temperature, i.e. the temperature that a black body would have at the given distance of a Sun-like star. Notice that in general a planet is not a black body: the albedo and atmospheric greenhouse effect, which are currently unknown for most exoplanets, have a great impact on its real temperature.
1.1 The ARIEL space mission
The information provided by the present and planned missions mainly deals with the orbital data and the basic physical parameters (e.g. mass, size) of the discovered planets. In the next decade, emphasis in the field of exo-planetary science must shift from “discovery” to “understanding”, by which we mean understanding the nature of the exo-planetary bodies and their formation and evolutionary history. It is in this context that the Atmospheric Remote-sensing Infrared Exoplanet Large-survey (ARIEL) has been selected as the next medium-class science mission, M4, by the European Space Agency.
1.1.1 Highlights & limits of current knowledge of planets
Since their discovery in the early 1990’s, planets have been found around every type of star, including pulsars and binaries. As they form in the late stage of the stellar formation process, planets appear to be rather ubiquitous. Current statistical estimates indicate that, on average, every star in our Galaxy hosts at least one planetary companion [21, 44] and therefore ~1012 planets should exist just in our Milky Way.
While the number of planets discovered is still far from the thousands of billions mentioned above, the ESA Gaia mission is expected to discover tens of thousands new planets [176]. In addition to the ongoing release of results from Kepler [21], ground-based surveys and the continuing K2 mission [53] will add to the current ground and space based efforts (see Table 6). In the future, we can look forward to many more discoveries from the TESS (NASA), Cheops (ESA) and PLATO (ESA) missions [36, 187, 192].
In all scientific disciplines, taxonomy is often the first step toward understanding, yet to date we do not have even a simple taxonomy of planets and planetary systems in our galaxy. In comparison, astrophysics faced a similar situation with the classification of stars in the late 19th and early twentieth century. Here it was the systematic observations of stellar luminosity and colours of large numbers of stars that led to the breakthrough in our understanding and the definition of the classification schemes that we are so familiar with today. The striking observational phenomenon that the brightness of a star correlates with its perceived colours, as first noted by Hertzsprung [110] and Russell [196], led to a link between observation and theoretical understanding of interior structure of a star its and their nuclear power sources [27, 72]. Thus, observation of a few basic observables in a large sample allowed scientists to predict both the physical and chemical parameters and subsequent evolution of virtually all stars. This has proved to be an immensely powerful tool, not only in studying “local” stellar evolution, but also in tracing the chemical history of the universe and even large scale cosmology.
We seek now a similar approach (i.e. the study of a large sample of objects to seek the underlying physical properties) to understand the formation and evolution of planets. Interestingly, planets do not appear to be as well behaved as stars in terms of parameter-space occupancy: what is certain, though, is that without observing a large number of planets, we will never be able to identify any trend allowing us to pinpoint the general principles underlying their formation and evolution.
The way forward: the chemical composition of a large sample of planets
The lesson taught us by the studies of Solar System planets is that to explore the formation and evolution of a planetary body we need to characterise its composition. The lesson taught us by exoplanets is that to grasp the extreme diversity existing in our galaxy we need large and statistically representative samples. A breakthrough in our understanding of the planet formation and evolution mechanisms – and therefore of the origin of their diversity – will only happen through the direct observation of the chemical composition of a statistically large sample of planets. This is achievable through remote-sensing observation of their gaseous envelop, i.e. through the characterisation of their atmospheres. Knowing what exoplanets are made of is essential to clarify not only their individual histories (e.g. whether a planet was born in the orbit it is observed in or whether it has migrated over a large distance), but also those of the planetary systems they belong to. Knowledge of the chemical makeup of a large sample of planets will also allow us to determine the key mechanisms that govern planetary evolution at different time scales (see Fig. 2).

Key physical processes influencing the composition and structure of a planetary atmosphere. While the analysis of a single planet cannot establish the relative impact of all these processes on the atmosphere, by expanding observations to a large number of very diverse exoplanets, we can use the information obtained to disentangle the various effects
A statistically significant number of planets need to be observed in order to fully test models and understand which physical parameters are most relevant. This aim requires observations of a large sample of objects (hundreds), generally repeatedly or on long timescales, which can only be done with a dedicated instrument from space, rather than with multi-purpose telescopes, such as JWST and E-ELT (see Section 1.5 for details).
The way forward: ARIEL
In order to fulfil the ambitious scientific program outlined in the previous section, ARIEL has been conceived as a dedicated survey mission for transit, eclipse & phase-curve spectroscopy capable of observing a large, diverse and well-defined planet sample. The transit and eclipse spectroscopy method, whereby the signal from the star and planet are differentiated using knowledge of the planetary ephemerides, allows us to measure atmospheric signals from the planet at levels of 10–50 ppm relative to the star. It is necessary to provide broad instantaneous wavelength coverage to detect as many molecular species as possible, to probe the thermal structure and cloud distribution and to correct for potential contaminating effects of the stellar photosphere (see Section 2 for details). This can only be achieved with a carefully designed stable payload and satellite platform [71, 181].
1.1.2 Planetary classes & ARIEL
An attempt at classifying how planets form and evolve, as derived from observations and theoretical results, is summarised in Fig. 3. A similar convention is used in this report. Because we do not know yet the internal composition of the planets observed, planets in the same area of the parameter space have often been given very different classification based on assumptions about their nature. The three categories shown in Fig. 2, for instance, divide the planets depending on their mass with respect to the critical mass range (5–15 Earth masses). Theoretical models indicate that when this critical mass range is reached, planetary bodies embedded in a circumstellar disc start accreting gravitationally nebular gas to become giant planets (like their Solar System analogues Jupiter, Saturn, Uranus and Neptune).

Schematic representation of our current understanding of the formation and evolutionary paths that, starting from the gas and dust in circumstellar discs (the bottom left corner of the diagram), create the different kinds of planets currently observed and predicted to now. Black arrows indicate the paths linked to the formation process (e.g. disc instability, solid accretion, gas capture) while blue arrows indicate the paths shaped by atmospheric evolution (e.g. atmospheric escape, atmospheric erosion, outgassing). Planets are divided into three broad categories: rocky/icy planets (mainly composed by Si, Mg, Fe, C, O), gas-rich planets (for which H and He represent a significant fraction of their mass) and transitional planets (encompassing the transition between the largest rocky/icy planets and the smallest gas-rich planets). The Solar System offers us examples of rocky/icy planets and gas-rich planets but not of transitional planets, for which we need to look to exoplanets. Figure from Turrini et al. [234]
As shown in Fig. 3, the planets falling below the critical mass range are labelled as rocky/icy planets, since they are expected to be gas-poor and mainly composed of rocks and ices. Planets above the critical mass range are labelled as gas-rich planets, as they are expected to have formed in the circumstellar discs and to have accreted a non-negligible fraction of their mass from the gaseous component of the discs. Planets falling into the critical mass range are instead labelled transitional planets, as depending on when they formed (i.e. before or after the dispersal of the circumstellar discs) they can either be massive super-Earths or sub-Neptunian gaseous planets. Each of these three classes is associated with a number of outstanding questions concerning the way they formed, how they evolved and their physical nature (see Section 1.2).
The large observational sample of ARIEL will ensure that, for each of these three classes, ARIEL will observe a statistically significant population and will be able to address the very core of these questions.
The broad classes of planets identified in Fig. 3 are all expected to have very different formation, migration and evolution histories that will be imprinted on their atmospheric and bulk chemical signatures. Many theoretical studies have tried to understand and model the various processes controlling the formation and evolution of planetary atmospheres, with some success for the Solar System. However, such atmospheric evolution models need confirmation and tight calibrations from observations. ARIEL will focus especially – but not exclusively – on warm and hot planets, for which the atmospheric composition is more representative of the bulk one.
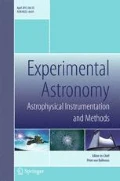
In Fig. 4 we show the predicted bulk atmospheric compositions as a function of planetary temperature and mass [80]. ARIEL will focus on the central-right part of the diagram, providing the observational constraints for a large population of rocky and gaseous planets (hundreds) with a range of temperatures and stellar host. The statistical approach provided by ARIEL is conditio sine qua non to confirm or identify new transitions between different regimes, and explain the physical processes behind them. The ability to trace a wide range of astrochemical molecules is another essential feature of ARIEL, without which we would not be able to capture the diversity and the complexity of the exoplanets we will observe. Tracing a large number of molecules is important not only for rocky/icy planets but also for gas-rich planets. While the bulk of their atmospheres is composed of H and He, it is their metallicity (i.e. the abundance of heavier elements) that contains the story of their formation and evolution. As such, for gas-rich planets the relevant questions and transitions concern all the molecules and atoms other than hydrogen and helium (see Section 1.2).

Schematic summary of the various classes of atmospheres as predicted by Forget and Leconte [80]. Only the expected dominant species are indicated, other (trace) gases will be present. Each line represents a transition from one regime to another, but these “transitions” need tight calibrations from observations. The axes do not have numerical values as they are unknown. Solar System planets are indicated, together with a lava planet, an Ocean planet and a hot Jupiter. ARIEL will observe planets ranging from the Earth to the super-Jupiter masses, especially warm and hot ones: many atmospheric regime transitions are expected to occur in this domain (see Section 1.2)
Obviously, we will not have direct access to the internal composition of an exoplanet but we will have access to the atmospheric composition. For the atmospheres to be our window into to their bulk composition, however, we need to study planets in different conditions compared to those in our Solar System. The Sun’s planets are relatively cold and, as a result, their atmospheric composition is significantly altered by condensation and sinking of different chemical species, both volatile and refractory (see e.g. Figure 5 and Section 1.2.1). By contrast, hot exoplanets represent a natural laboratory for chemistry and formation studies. This is because their higher atmospheric temperatures limit the effects of condensation and sinking of the volatile species, thus making the atmospheric composition more representative of the bulk one. ARIEL’s capability to trace a wide range of astrochemically important elements, from metals to refractories to volatiles, permits us to fully take advantage of such unique laboratory. Hot planets also allow us to investigate exotic chemical regimes (Si-rich and metal-rich atmospheres) that are impossible to observe in the Solar System and will offer us hints of the composition of the high-Z materials present in the interior of colder planets (see Section 1.2.2).

Cloud layers in atmospheres ranging from our Jupiter to the hottest brown dwarfs (figure from [142]). Condensate clouds of various species form at specific points in the temperature - pressure profile. As atmospheres cool, these clouds sink deeper, falling below the observable gaseous layer
Planetary migration: an ARIEL ally
The current sample of known extrasolar planets highlights how planetary migration is a widespread and important process in shaping the structure of planetary systems. About half the exoplanets discovered so far orbit their host star at semimajor axes less than 0.1 AU and, especially in the case of gas-rich planets (i.e. the hot-Jupiters and hot-Neptunes), which is a strong observational indication that they probably formed elsewhere – plausibly beyond the water ice condensation line – and migrated to their present position.
Migration can occur at different times in the life of a planetary system, can affect planets of very different masses and can have different causes (see Fig. 6 and [19, 61, 235] and references therein). Due to its widespread prevalence and its capability to create “hot” planets, i.e. planets in orbits extremely close to their host stars with temperatures above 1000 K, planetary migration delivers planets that formed at different times, under different conditions and at different distances from their host stars to this optimal orbital region for transit spectroscopy; this will make ARIEL’s observational sample statistically complete from the perspective of the different formation and evolution tracks of the planetary bodies, as summarised in Fig. 6.

Giant planets, and also most of the smaller planets, form in the outer, colder regions of the circumstellar discs, where there is most of the gas, dust and ice. If they stayed there, we would not be able to observe their atmospheres or we would get only very limited information about them. Luckily, migration delivers a good fraction of them closer to the star and makes them optimal targets for ARIEL for two main reasons: the chance they transit increases and the hot temperature makes the atmospheric signals more detectable on top of being more representative of the planet interior. Figure from Turrini et al. [234]
1.1.3 Planet density: an inaccurate indicator of exoplanets’ nature
To date very little empirical correlation is apparent among the basic observable exoplanetary parameters. For planets transiting in front of their parent stars – of which some 2700 are known today – the simplest observables are the planetary radius and, when combined with radial velocity, the mass. Mass and radius allow the estimation of the planetary density. While the planetary density permits a very first distinction between primarily gaseous and rocky/icy planets, on its own it is an inaccurate and potentially misleading indicator of the exoplanet bulk composition. For instance, from Fig. 7 top left it is evident that gas giants can exist with a broad range of interior structures and core composition and/or are observed at different ages, therefore being more or less puffed-up (e.g. [101, 82, 242]).

Top left: Masses and radii of known transiting exoplanets. Black lines show mass-radius relations for a variety of internal compositions: the models cannot fully capture the variety of cases and break the degeneracies in the interpretation of the bulk composition. Top right: zoom into the lower mass regime indicated as a grey rectangle on the left [143]. Coloured lines show mass-radius relations for a variety of internal compositions. Planets discussed in the text are labelled. Left: Demonstration of the degeneracy left in the internal composition of a planet when only the mean density is known. This ternary diagram relates the composition in terms of Earth-like nucleus fraction, water+ices fraction, and H/He fraction to total mass, to the radius (color coded) for a specific planetary mass (here the one of GJ 1214b). Each vertex corresponds to 100%, and the opposite side to 0% of a particular component (Figure from [239]). Constant radius – or density, since the mass is fixed – curves are shown by contours. A perfect radius measurement forces the composition to follow one of these curves. The inferred composition is therefore not unique. In our example, the available Mass-Radius data constrain GJ 1214 b to the black dashed band on the right. So both an almost pure water composition (dot labelled a) and a 90% rocky core with a 10% envelop of mixed water and H/He (dot labelled b) are consistent with the present data. Only a further characterization of the gaseous envelope can remove this degeneracy
Objects lighter than ten Earth masses (so called super-Earths, Fig. 7 top right) are even more enigmatic – we cannot derive their properties based on mass and radius alone, as pointed out in many papers in the literature (e.g. [1, 94, 239]) and noticeable e.g. in Fig. 7 bottom left. Currently, we can only guess that the extraordinarily hot and rocky planets CoRoT-7b, Kepler-10b and Kepler-78b sport silicate compounds in the gaseous and liquid phases [134, 157]. The “mega-Earth”, Kepler-10c [69], is twice the Earth’s size but is ~ 17 times heavier, making it among the densest planets currently known. The five inner planets orbiting Kepler-11 [141] show an extraordinary diversity, while being dynamically packed in orbits less than 0.45 AU in radius. Their masses range from ~2 to ~13 Earth masses and they cover a factor of six in density. Kepler 11b and c are possibly super-Earths with H2O and/or H/He envelopes [114]. Kepler 11d, e, f resemble mini-Neptunes. As explained in detail in Section 1.2, the characterisation of the atmospheres of these and other planets is essential to disentangle the degeneracies in the mass-radius relationship.
1.1.4 Current observations of exo-atmospheres: strengths & pitfalls
In the past decade, pioneering results have been obtained using transit spectroscopy with Hubble, Spitzer and ground-based facilities, enabling the detection of a few of the most abundant ionic, atomic (e.g. [45, 190]) molecular species and condensates [86, 208, 233] and constraints to be placed on the planet’s thermal structure. Information on the stability of the atmospheres of transiting planets has been collected through UV observations with Hubble (e.g. [140, 248, 83]) hydrodynamic escape processes are likely to occur for most of the planets orbiting too close to their parent star. The infrared (IR) range, on the contrary, offers the possibility of probing the neutral atmospheres of exoplanets and exploring their thermal structure (e.g. [122, 147, 213]). In the IR the molecular bands are more intense and broader than in the visible [224] and less perturbed by small particle clouds, and are hence easier to detect. On a large scale, the IR transit and eclipse spectra of hot-Jupiters seem to be dominated by the signature of water vapour (e.g. [13, 23, 28, 39, 47, 54, 55, 59, 63, 96, 126, 139, 154, 217, 218, 225, 226, 233]). Other carbon-bearing molecules, such as CO [209] and perhaps methane, are present [217]. Similarly, the atmosphere of hot-Neptune HAT-P-11b appears to be water-rich [84]. The data available for other warm Neptunes, such as GJ 436b, GJ 3470b are suggestive of cloudy atmospheres and do not always allow a conclusive identification of their composition (e.g. [87, 123, 164]). Multiple-band photometry and spectroscopy in the near-IR (1–5 μm) have been obtained for a number of young gaseous planets using ground-based dedicated instruments, such as VLT (SPHERE), Gemini (GPI), Subaru (SCExAO). The comparison of the chemical composition of these young gaseous objects (e.g. [144, 265]) with the composition of their migrated siblings probed through transit will help to clarify the role played by migration and by extreme irradiation on gaseous planets.
Concerning smaller planets, the analysis of the transit spectra for the 6.5 MEarth super-Earth GJ 1214b has oscillated between a metal-rich or a cloudy atmosphere (e.g. [22]; Kreidberg et al. [125, 126]). An interesting case is 55 Cnc e, a very hot super-Earth orbiting around its star in less than one day. Most recent observations with Spitzer/Hubble suggest a very strong day-night thermal gradient with a volatile atmosphere around it [65, 232]. Further observations in a broader spectral range are needed to understand the history and composition of the planet [106, 107, 118].
Despite some early successes, currently available data remain sparse – in particular, there is insufficient wavelength coverage and most observations were not made simultaneously. Because an absolute calibration at the level of 10–100 ppm is not guaranteed by current instruments, great caution is needed when one combines multiple datasets at different wavelengths which were not recorded simultaneously. The degeneracy of solutions embedded in the current transit observations (e.g. [133, 138, 145, 218]; Waldmann et al. [256, 257]) inhibits any reliable attempt to estimate the elemental abundances or any meaningful classification of the planets analysed (Fig. 8). New and better data of uniform calibration and quality are essential for this purpose, and most importantly we need the data for a large population of objects: both objectives can be achieved with a dedicated space mission like ARIEL. Figure 9 illustrates the capabilities of ARIEL for recording high quality, broad wavelength spectra for a range of planetary types. In the following sections, we explain how we are going to accomplish these objectives and we detail the specific questions ARIEL is going to address.

Left: transit and eclipse spectra of WASP43b as captured by the Hubble-WFC3 camera [126]. Right: comparison between the information content of ARIEL (Brown) and WFC3 (green) spectra as obtained with the TauREx spectral retrieval model [256]. The broader wavelength range provided by ARIEL enables allows to constrain the molecular abundances and temperature with great precision, and with little or no correlation among the parameters. The opposite is true for the WFC3, whose narrow spectral range does not permit one to separate the various atmospheric parameters with confidence

Simulated spectra of four exisiting planets with different sizes and temperatures as observed by ARIEL. The simulations were obtained with our instrument end-to-end simulator, ARIEL-Sim [199], see Section 2.2.1.1. Top: Transit spectrum of a hot-Jupiter similar to HD189733b, clouds are included in the simulation (left). Transit spectrum of a warm Neptune at 800 K around a K-type star, mag. K = 7, similar to HAT-P-11b (right). Bottom: transit spectrum of a warm sub-Neptune, similar to GJ1214b, at 600 K around a M star, Mag K = 9 (left). Eclipse spectrum of a hot super-Earth similar to 55-Cnc-e around a G-type star, Mag K = 4. Note that the simulated spectra were generated assuming the current knowledge about these planetary types, which is in many cases very limited when it comes to atmospheric composition (right)
1.2 Key science questions addressed by ARIEL
ARIEL will address the fundamental questions:
-
What are exoplanets made of?
-
How do planets and planetary systems form?
-
How do planets and their atmospheres evolve over time?
through the direct measurement of the chemical composition and thermal properties of a large population of exoplanets. The diversity in compositions is expected to be linked to different formation and evolution scenarios. ARIEL will therefore observe spectroscopically hundreds of transiting planets of different sizes with different temperatures around a variety of stellar types to establish what these planets are made of. ARIEL is going to address these fundamental questions, by enabling advances in a number of key areas discussed in the following sections.
1.2.1 How ARIEL will place the Solar System into a broader context
The Solar System has been so far our only example of a planetary system and its planets our only template of the different kinds of planetary bodies existing in our galaxy. The Solar System’s planets, however, do not sample all possible outcomes of the planetary formation process. Moreover, when studying them, we face the issue that the four giant planets are cold planets. Because of their low temperatures, their atmospheric composition is extremely affected by condensation and removal processes. The atmospheres of hot Jupiters and Neptunes present a critical advantage compared to the planets of the Solar System: their high temperature. Unlike Jupiter, Saturn, Uranus and Neptune, there is no cold trap in their atmosphere for species such as H2O, CH4, NH3, CO2 etc., which condense at much colder temperatures. Observations of hot gaseous exoplanets can therefore provide a unique access to their elemental composition (especially C, O, N, S) and enable the understanding of the early stage of planetary and atmospheric formation during the nebular phase and the following few million years (see Section 1.2.2).
Even today, in the Solar System, linking the atmospheric abundances to the elemental bulk composition of our four gas-dominated planets still represents a challenge. Yet such information is so crucial to our understanding of the Solar System to justify in part the Juno and JUICE missions to Jupiter: measuring the atmospheric composition is our best opportunity to solve the conundrum.
-
Solar System difficulty 1 – Condensation:
The bulk abundance of the most common heavy element, oxygen, in the four Solar System major planets cannot be measured directly by spectroscopy from Earth because its main molecular carrier, water, condenses in the atmosphere and is removed from the observable region (see e.g. [219]). This will not be true for ARIEL targets. As described in Fig. 10, even for some of the coldest objects in the ARIEL sample, temperatures in the atmosphere will be well in excess of the condensation temperature in a pure water atmosphere (the most conservative case). As most of the other main reservoirs of oxygen, carbon, and nitrogen (e.g. CO, CH4, CO2, NH3, N2) condense at even lower temperatures, the case is even stronger for these molecules. For some of the hottest objects, even more refractory elements (silicates, metals) can be detected, allowing us to constrain almost all of the major constituents of a potential core.

Atmospheric temperature profiles compared to the condensation curves for water (solid blue curves). The thermal profiles are computed using Guillot [103] for a planet resembling Jupiter (solid black) and for higher irradiations (dashed curves; Equilibrium temperature of 300 K, 700 K and 1500 K respectively from left to right). The right blue curve is the saturation vapor pressure curve, i.e. the temperature below which a pure water atmosphere would start to condense at a given pressure. This is the most conservative limit. The left blue curve represents the condensation temperature for water in an atmosphere with a solar abundance. If an atmospheric profile stays on the right of these curves, condensation will never occur. Then, while Jupiter is too cold to keep a large amount of water vapour aloft, planets warmer than Teq~300 K should not experience much condensation. As other species (e.g. CO, CH4, NH3, CO2) condense at even lower temperatures, the case is even more compelling for these species

Benefits of knowing the atmospheric composition when inferring the core mass of a gaseous planet. Left: Radius evolution tracks for a half Saturn mass planet for two different atmospheric compositions (black: Solar; Blue: 10 times solar) illustrating the core inference process (models from [131]). For the solar composition, a 9 M⊕ core is sufficient to explain the observed radius (grey cross). A super-solar atmosphere, being more opaque, slows down the cooling, hence the contraction, of the planet. A larger — here 15 M⊕ — core is thus needed to explain measured radius. Not knowing the composition can here lead to a 70% bias on the core mass inferred. Right: To see whether this effect is statistically significant when measurement uncertainties are taken into account, we repeated this process a large number of times, randomizing the measured radius (Thorngren et al. [222]). The radius uncertainty was taken to be equal to 2%, in line with the precisions envisioned for future missions [187]. For each atmospheric composition, a histogram shows the probability for the core to have a given mass. Assuming a given atmospheric composition (a given histogram), one would conclude that a 2% radius uncertainty entails 1 sigma = 1.4 M⊕ uncertainty on the core, but this is not accurate. The difference (or bias) on the average core mass inferred in the two atmospheric scenarios is 4 times larger. By constraining the atmospheric composition, ARIEL would thus lead to more accurate core mass predictions
-
Solar System difficulty 2 – Chemical (dis)equilibrium:
Because the main molecular carriers of the elements we want to constrain do not condense, as mentioned above, chemical disequilibrium is not necessarily a hindrance to the determination of the deep bulk elemental abundance of a planet. Indeed, when the most abundant molecules carrying a given element (for example, H2O, CO, CO2 for oxygen) can be constrained, the abundance of the element deep in the interior can be determined. This remains true as long as the transport of chemical species is dominated by turbulence and advection (as opposed to molecular diffusion), which is the case within and below the probed atmospheric regions, and that no species is removed (e.g. by condensation and settling) during the transport. The wide spectral coverage of ARIEL will prove an important asset as it covers the most visible molecular features of the main species (H2O, CO, CO2, NH3, CH4, HCN, H2S, C2H2, PH3).
This approach could of course be more difficult for some elements forming relatively transparent molecular species, e.g. nitrogen in the form of N2. For these species some chemical modeling will be needed. However, rather counter intuitively, thermochemistry at these warm to high temperatures is much better known and data-constrained than at the low temperatures encountered in Solar System giant planets. This is due to the huge databases used in industry to model combustion in engines which deal with the same type of pressure, temperature, and compositions [32, 243, 244]; these data are available to the scientific community through the KIDA database (Wakelam et al. [250, 249]). In addition, measurements of the radiatively active species and of the thermal structure of the atmosphere by ARIEL will ensure that the results of such chemical models will be better constrained, and thus more reliable than at present.
In summary, because of the very fact that currently-detected exoplanets in general, and ARIEL targets in particular, will be much warmer than the gaseous planets in the Solar System, most of the current hurdles in linking the atmospheric to the bulk composition will be effectively eliminated or mitigated.
-
There are only 8 planets in the Solar System…
While the knowledge of the planets in our Solar System is getting more and more accurate due to ambitious exploration programs by ESA, NASA, JAXA and other agencies, the statistics are too small to draw conclusions about the general properties of the planets and planetary systems in our Galaxy. A larger population of planets covering a broader parameter space in terms of size, mass, orbital characteristics, and stellar host is needed to progress in our understanding.
1.2.2 Formation-evolution of gas-rich planets & ARIEL
Gas-rich planets possess massive envelopes of hydrogen and helium captured from the nebular gas. The metallicity of these envelopes is determined by the heavy elements accreted by the planets through the gas and the solids and, as such, it records the formation history of the planets themselves. Different elements allow one to trace different sources: metals and refractories are linked to the accreted rocks, volatiles to the ices and the most abundant elements C, O and N are linked to both the accreted solids and gas. The different formation and migration scenarios of gas-rich planets predict different relative contributions of these sources to the atmospheric composition and metallicity of the planets. In the following sections, we detail the ARIEL’s contribution to the understanding of formation and evolution processes for gas-rich planets.
How ARIEL observations will help overcome degeneracies in the study of the exoplanet interior
While mass and radius determination (and in the case of Solar System planets, gravitational moments) give constraints on the interior composition, they leave important degeneracies that can only be resolved by adding some independent constraints.
Even if mass and radius measurements were accurate enough to provide us with the mean density of a given planet at any arbitrary precision (a statement that could almost be considered true in the solar system), large degeneracies would still remain on the actual bulk composition of the interior (Table 1).
When considering the large number and the diversity of the planets that will be probed by ARIEL, such enhanced mass-radius-composition constraints will thus allow us to really start addressing important questions: What are the main factors determining the total and relative elemental enrichments of a planet? Is enrichment determined by the stellar abundances or the formation location? Do planets have dense central cores?
The direct measurements made by ARIEL will give us the composition of the outer gaseous envelope of the planet. This of course departs from the bulk composition in three ways:
-
Condensation of major species as it happens for all four solar system giant planets: ARIEL specifically targets hot and warm planets to avoid this issue.
-
Presence of a dense core remaining at the centre of the planet that is not mixed within the gaseous layer: Then, the bulk composition (including the core) is retrieved by combining the usual information on the mean density (from the mass/radius measurements) with our knowledge of the composition of the gaseous envelope. This removes one free parameter (and thus a degeneracy) compared to the analysis of the density alone. ARIEL measurements also help improve the planetary models used to invert the density data (see below).
-
Presence of layers with significant compositional gradients due to mixing inefficiency: This cannot be ruled out, even for the solar system where gravity data are available [130]. Nevertheless, because metal enrichment must increase downward, our analysis will provide a lower limit on the total enrichment (Baraffe et al. [12, 242]).
Concerning the uncertainties on our determination of the bulk density for Giant planets, one can look at Fig. 4 in Guillot [98]: said figure illustrates how the uncertainties in the assumptions adopted in planetary models propagate on to the uncertainty in the inferred bulk composition. Once mass and radius measured uncertainties are reduced below the 3–5% level, as should be for most ARIEL targets, important contributions to the uncertainty budget are the albedo of the planet and the opacities in the atmosphere. ARIEL observations will measure both of these quantities, therefore reducing the uncertainty on the enrichment possibly below the 10% level which is sufficient to discriminate among formation models (see Fig. 16). We expect stellar ages to be refined as well thanks to Gaia data and asteroseismology.
Gas-rich exoplanets: ARIEL ability to measure atmospheric chemistry
Among the different categories of exoplanets, the hot/warm gas-rich planets are particularly interesting ones because the molecular abundances determined by observations are a direct reflection of their elemental abundances. In addition, they provide the highest quality observations. Indeed, unlike the giant planets of our own Solar System (Jupiter, Saturn...), condensation is likely to be less important in these very hot atmospheres, and there is therefore no cold trap for oxygen-, carbon- and nitrogen-bearing species (see Table 2). Key species such as H2O, CH4, NH3 do not condense and observations can provide a measure of the elemental composition. Table 2 summarises how ARIEL will test the validity of current theoretical predictions, which hypothesize classes of gaseous planets according to chemical and thermal properties.
The atmospheric temperatures found in short-period exoplanet atmospheres are very high and therefore one could think that the chemical composition of these atmospheres can be described by thermochemical equilibrium, as the high temperatures lead to very fast chemical kinetics. It is exactly what was assumed in the first models used to study these kind of planets (e.g. Burrows et al. [13, 38, 39, 40, 205, 206]), but it was quickly realised that interpreting observational data of hot-Jupiters was not so straightforward. There are out-of-equilibrium processes (mixing and photodissociations) that can influence the chemical composition [168, 243]. Indeed, a strong vertical mixing induces the phenomenon of quenching. In the deep atmosphere, the temperature is high, the kinetics are fast, and the atmosphere is at thermochemical equilibrium. At lower pressures, temperature decreases, the kinetics slow down, and there is a level where the dynamical timescale becomes shorter than the chemical timescale. Here, kinetics are not sufficiently fast to maintain the atmosphere with a composition corresponding to the thermochemical equilibrium. Then, vertical transport brings the composition of this level (called quenching level) towards lower pressure levels. The chemical composition of the atmosphere above this quenching level no longer corresponds to the prediction of the thermochemical equilibrium.
At a fundamental level, the chemical composition of the atmosphere is determined by:
-
1.
the elemental abundances (how much oxygen, how much carbon...) the planet formed with
-
2.
the temperature of the atmosphere, which is of course dependent on the host star and internal heating
-
3.
physical processes in the atmosphere (mixing, photolysis, etc.).
For warm planets (see Table 2), with atmospheres unlikely to be described by chemical equilibrium, it is interesting to quantify the effect of the different parameters that are likely to influence the chemical composition. Venot et al. [244] studied the atmospheric composition of a warm Neptune, GJ 3470b. They explored the parameter space for metallicity, temperature, eddy diffusion coefficient and stellar UV flux. They found that the value of the eddy diffusion coefficient and the intensity of stellar irradiation have a lower impact on the chemical composition, compared to the huge effect of metallicity and temperature. Change of several orders of magnitude in abundance could be observed for some species. For instance, Fig. 12 shows that the abundances of the main reservoirs of carbon, CO and CH4, depend to a large extent on the metallicity and the temperature. These differences in chemical composition are visible in the synthetic spectra and, if present, will be easily observed by ARIEL.

Vertical abundances profiles of CO (left) and CH4 (right) as calculated through 16 models of GJ 3470b in which the space of parameters of metallicity (ζ), temperature (T), eddy diffusion coefficient (Kzz), and stellar UV flux (Fλ) are explored. Each colour corresponds to a set of metallicity and temperature, and each line style to a set of eddy diffusion coefficient and stellar irradiation. From Venot et al. [244]
The relative elemental abundances can also have a crucial effect on the atmospheric chemical composition of exoplanets. Venot et al. [244] studied this effect as well as the consequences on the synthetic spectra. They found that for warm atmospheres, i.e. with a temperature around 500 K, changing the C/O ratio from solar (C/O = 0.54) to twice solar (C/O = 1.1) has almost no effect of the chemical composition, nor on the synthetic spectra.
For hot planets (see Table 2), the effect of relative elemental abundances is very important [244]. The increase of the C/O ratio leads to an important increase (by several orders of magnitude) in the abundance of hydrocarbon and other species (i.e. CH4, C2H2, HCN), accompanied with a decrease in the abundance of water (see Fig. 12). These differences in chemical composition are visible in the synthetic spectra and, if present, will be captured by ARIEL [246] (Fig. 13).

Left: Vertical abundance profiles for different molecules for a range of C/O. The different coloured lines show the molar fraction profiles at different C/O, as shown by the legend. Right: synthetic transit spectra and contribution of the various opacities for the atmospheric compositions shown on the left (Rocchetto et al. [193])
Non-Local Thermodynamic Equilibrium emissions
Non-LTE emissions from CH4 and other molecules have long been known in the upper atmospheres of the solar system gas giants (e.g. [117]). It provides for example insight into the emission level temperature, and is sensitive to both auroral and non-auroral conditions. The modelling of NLTE phenomena is relatively mature for the solar system gas giants. However, much work remains to be done to achieve a comparable degree of confidence in Non-LTE models for the high-temperature conditions of close-in gas exoplanets. CH4 non-LTE detections have been reported on HD189733b [216, 252], but such measurements from the ground are very challenging (Mandell et al. [148]). ARIEL’s spectral coverage and resolving power are well suited to detect the Non-LTE emission from CH4, which is expected to peak at 1–5 μm. Its detection will make it possible to test composition and temperature models of warm and hot Jupiter atmospheres.
Gas-rich exoplanets: ARIEL ability to measure atmospheric dynamics & cloud distribution
Chemistry and dynamics are often entangled. For instance, Agúndez et al. [2, 3] showed that for hot-Jupiters the molecules CO, H2O, and N2 and H2 show a uniform abundance with height and longitude, even including the contributions of horizontal or vertical mixing. For these molecules, it is therefore of no relevance whether horizontal or vertical quenching dominates. The vertical abundance profile of the other major molecules CH4, NH3, CO2, and HCN shows, conversely, important differences when calculated with the horizontal and vertical mixing.
Longitudinal variations in the thermal properties of the planet cause a variation in the brightness of the planet with orbital phase. This orbital modulation has been observed in the IR in transiting (e.g. [122]) and non-transiting [52] systems. In Stevenson et al. [213] obtained full orbit spectra with Hubble/WFC3. These observations are key constraints to 2D and 3D global circulation models (e.g. [50]; Showman et al. [207, 116]). ARIEL phase-curve spectroscopic measurements of the dayside and terminator regions will provide a key observational test to constrain the range of models of the thermochemical, photochemical and transport processes shaping the composition and vertical structure of these atmospheres.
One of the great difficulties in studying extrasolar planets is that we cannot directly resolve the spatial variation of these bodies, as we do for planets in our solar system. However, the evolution of the overall brightness during ingress and egress provides information on the spatial distribution of the planet’s emission. Majeau et al. [147] and De Wit et al. [66] derived a two-dimensional map of the hot-Jupiter HD189733b at 8 μm with Spitzer-IRAC (see Fig. 19).
Clouds can significantly affect atmospheric opacities and reflectivity, and thus the atmospheric circulation and the thermal structure of irradiated planets. Detecting their presence and inhomogeneous spatial distribution is therefore paramount (e.g. Charnay et al. [48], Parmentier et al. [172], see Fig. 14). As demonstrated for Kepler-7b [89], phase curves at visible wavelengths are partly dictated by reflected starlight, which encodes information on the cloud structure as well as the composition and particle size of the condensates. Disentangling the reflected starlight component from the planet thermal emission requires combined visible-infrared observations.

Left: Figure from Charnay et al. [48]. Amplitude of thermal phase curves of a warm sub-Neptune similar to GJ1214b without cloud (solid lines) and with cloud (dashed lines for radii of 0.5 μm and dotted line for radii of 0.1 μm) for metallicity of 1, 10, 100 and a pure water atmosphere. Right: Figure from Parmentier et al. [172]. Temperature and outgoing flux from the dayside of hot-Jupiters with different equilibrium temperatures. The first row shows the temperature at 10 mbar estimated by a global circulation model. The following rows show the total flux (emitted + reflected) from the dayside hemisphere in the spectral range observed by the Kepler spacecraft. The second row is a model without clouds, whereas in the subsequent rows one cloud species is condensing
ARIEL will provide phase curves, 2D-IR maps recorded simultaneously at multiple wavelengths, for several gaseous planets, an unprecedented achievement outside the solar system. These curves and maps will allow one to determine horizontal and vertical, thermal/chemical gradients, cloud patchiness, exo-cartography.
Gas-rich exoplanets: ARIEL ability to constrain exoplanet provenance & formation mechanisms
As the study of the formation and evolution of the Solar System and its different planetary bodies taught us, orbital parameters plus mass and size are not enough to solve the puzzle of the origin of a planetary system and to constrain its past evolution. The orbital evolution of planets is randomly affected by planetary encounters and can be drastically altered by migration. Migration, in turn, can act either very early, due to the interaction between a planet and the circumstellar disk in which it is embedded in (e.g [57, 121]), or at a later time, as a result of planet-planet scattering in unstable multiplanet configurations [49, 258]. Finally, the onset of the dynamical instability that will result in the planet-planet scattering event is affected by unknown or poorly constrained parameters, like the mass present in the form of solid bodies in the early life of the planetary system, and is therefore difficult to pinpoint in time [136, 231].
The experience derived from the study of the Solar System tells us that the additional information needed to solve the puzzle posed by the history of a planetary system and of its planets is compositional in nature [108, 189, 236]. Migration and, more generally, the formation and dynamical history of a giant planet, affect the composition in different ways [99, 150, 234, 235]. It affects the bulk elemental composition of the gaseous envelope by making it capture gas and solids from different regions of the circumstellar disk with different ratios between the condensate and gaseous phases for the most abundant elements like C and O (see Figs. 15 and 16, [75, 235, 247]). Additionally, migration enables the accretion of solid material from far away regions in the protoplanetary disk, enhancing the abundance of refractory elements and metals in the gaseous envelope (see Fig. 16 right and [235]).

Left: effects of the formation and migration history of a giant planet on its atmospheric C/O from the simulations of Turrini, et al. [235]. Right: two examples of enrichment patterns created by the accretion of solids through the four major cosmochemical groups for elements that have spectral features in the observing bands of ARIEL. The solid bars on the left of each pair of bars show the pattern created in a giant planet accreting solids mainly from beyond the water-ice condensation line, while the criss-crossed bars on the right of each pair show the pattern created in a giant planet accreting solids also from inside the water ice condensation line. Rock-forming and refractory elements give us information on the rocky component of the solid material accreted. Volatile elements are delivered by both rock and ices: with the information provided by the previous two classes of elements, we can disentangle the contribution of rock from that of ices. Atmophile elements are contributed both by solids and by gas, the information provided by the other classes can help us disentangle the relative contributions of these two sources

Figure from Venturini et al. [247] linking the bulk composition of the planets and the atmospheric enrichment, showcasing the need to use atmospheric measurements as guidance for determining the planetary composition and constraining formation models. Left: Zenv versus planetary mass, and current measurements of hot Jupiters. Right: the relation between the metallicity of the gaseous envelope (including the atmosphere) and the total metallicity (including the mass of heavy elements in the core) as predicted by formation models
ARIEL observations will enable the investigation of high-Z materials (i.e. heavier than hydrogen and helium) in the atmospheres of hot planets, which are impossible to observe in the Solar System giant planets, as they have condensed out/sunk into their interior. To derive the elemental composition, we need to extract the relative abundances of the molecular species present in the atmosphere in great detail which can be done through spectral retrieval models applied to the spectra observed by ARIEL. Rocchetto et al. [193] demonstrated that transit spectra recorded over a sufficiently broad infrared wavelength range can be effectively used to distinguish scenarios where C/O is equal, larger or smaller than 1. In Fig. 17 we show how accurately C/O can be recovered from simulated ARIEL spectra.

Right: Simulated transit spectra for an HD 209458b-like planet, with C/O of 1.1 and 0.8. as observed by ARIEL. The different spectral shapes are a result of the presence of different carbon and oxygen-bearing species for these two chemistries [244]. Left: Retrievals of C/O, temperature and radius for two versions of an HD 209458b-like planet with different input C/O using spectral retrieval TauREx [256]. The two values for C/O ratio can be recovered from the synthetic observed spectra
1.2.3 Formation-evolution of transitional planets & ARIEL
Transitional planets encompass both large super-Earths and sub-Neptunes. One of the critical open questions, from a planetary formation point of view, is where exactly the transition between these two populations occurs. On one hand, according to our current theoretical framework, the formation of transitional planets should occur during the lifetime of circumstellar discs to allow for these bodies to capture the nebular gas and become the planetary cores of gas-rich planets. On the other hand, the formation of super-Earths could be an extreme end product of the same process governing the formation of rocky/icy planets (see next section) and, based on the chronological data from the case of the Solar System, should take place mostly after the dispersal of the gaseous component of the circumstellar disc.
Planetary bodies reaching the critical mass range before the dispersal of the nebular gas might give rise to the exoplanetary population of sub-Neptunes (H/He rich formation scenario), while those that complete their accretion process after the dispersal of the disc might join the exoplanetary population of super-Earths (H/He poor formation scenario). In such a scenario, the planetary radius can be an unreliable indication of the nature of the planetary body in question, as we have no reason to expect that the largest super-Earths cannot possess a greater radius than the least massive sub-Neptunes (see Section 1.2.3.1).
Moreover, given that bodies in the critical mass range can already experience a significant migration due to their interaction with the disc, information provided by the planetary mass and density can be misleading: a large, ice-rich super-Earth that formed farther away than the water ice condensation line and a sub-Neptune with a rocky-metallic core that formed nearer to the host star could in principle have quite similar densities despite their extremely different natures. The most reliable measure of the nature of a critical-mass planet is therefore supplied by the composition of its atmosphere. Studying the transition between super-Earths and sub-Neptunes can be done to first order by searching for the presence of hydrogen and helium in the atmospheric signatures of the critical mass planets composing the observational sample of ARIEL. While super-Earths should possess secondary atmospheres generated by outgassing processes (therefore devoid of H and He), sub-Neptunes should possess primary atmospheres mainly composed by the gas captured from the circumstellar discs (therefore dominated by H and He), see Table 3.
Why mass-radius determination is not enough to constrain the transitional planets’ composition
Today, the only constraint we have on the bulk composition of an exoplanet is from its average density. As pointed out by Adams and Seager [1], however, the average density is not unique within the range of compositions. Variations of a number of important planetary parameters produce planets with the same average densities but widely varying bulk compositions. A planet with a given mass and radius might have substantial water ice content (a so-called ocean planet), or alternatively a large rocky iron core and some H and/or He. Adams and Seager [1] conclude that H-rich thick atmospheres will confuse the interpretation of planets based on a measured mass and radius. They find that the identification of water worlds based on the mass-radius relationship alone is impossible unless a significant gas layer can be ruled out by other means. Transmission and emission spectroscopy through transit, as performed by ARIEL, is the only way to remove this degeneracy.
A thorough study of volatile-rich super-Earths/sub-Neptunes was published by Valencia et al. [239]. Figure 18 illustrates the degeneracy embedded in the measurement of the mass-radius to constrain the bulk composition of many of the exoplanets in the critical mass region discovered so far. They conclude that a robust determination by transit spectroscopy of the composition of the upper atmosphere will help determine the extent of compositional segregation between the atmosphere and the envelope.

Demonstration of the degeneracy left in the internal composition of a planet when only the mean density is known. This ternary diagram relates the composition in terms of Earth-like nucleus fraction, water+ices fraction, and H/He fraction to total mass, to the radius (color coded) for a specific planetary mass (here the one of GJ 1214b). Each vertex corresponds to 100%, and the opposite side to 0% of a particular component (Figure from [239]). Constant radius – or density, since the mass is fixed – curves are shown by contours. A perfect radius measurement forces the composition to follow one of these curves. The inferred composition is therefore not unique. In this example, the available mass-radius data constrain GJ 1214 b to the black dashed band on the right. Both an almost pure water composition (dot labelled a) and a 90% rocky core with a 10% envelop of mixed water and H/He (dot labelled b) are consistent with the present data. Only a further characterization of the gaseous envelope can remove this degeneracy
How the atmospheric composition can solve the issue
A robust determination of the composition of the upper atmosphere of transitional planets will reveal the extent of compositional segregation between the atmosphere and the interior, removing the degeneracy originating from the uncertainty in the presence and mass of their (puffy?) atmospheres. Primordial (primary atmosphere) atmospheres are expected to be mainly made of hydrogen and helium, i.e. the gaseous composition of the protoplanetary nebula. If an atmosphere is made of heavier elements, then the atmosphere has probably evolved (secondary atmosphere). An easy way to distinguish between primordial (hydrogen-rich) and evolved atmospheres (metal-rich), is to examine the transit spectra of the planet: the main atmospheric component will influence the atmospheric scale height,Footnote 1 thus changing noticeably the amplitude of the spectral features (see Fig. 19). The heavier is the main atmospheric component, the more compact is the atmosphere, the smaller is the signal detectable with ARIEL. While clouds can mimic this effect to a degree, they mostly influence the short wavelengths (especially optical and NIR). See also Miller-Ricci and Fortney [159].

Simulated ARIEL transit spectra for a hot super-Earth whose atmosphere shows different fractions of H/He and H2O. The heavier is the main atmospheric component (i.e. water dominated in this case), the more compact is the atmosphere, the smaller is the signal detected. While clouds can mimic this effect to a degree, they mostly influence the short wavelengths (especially VIS-NIR). The figure was produced using TauREx model [256]. As spectral signatures become compressed in heavier atmospheres, more observations need to be obtained to reach the same detection significances
1.2.4 Formation-evolution of rocky/icy planets & ARIEL
Several scenarios may occur for the formation and evolution of small planets – i.e. predominantly solid planets (Fig. 2). To start with, these objects could have formed in situ, or have moved from their original location because of dynamical interaction with other bodies, or they could be remnant cores of more gaseous objects which have migrated in [107]. Having a lower mass, their atmospheres could have evolved quite dramatically from the initial composition, with lighter molecules, such as hydrogen, escaping more easily. Impacts with other bodies, such as asteroids or comets, or volcanic activity might also have altered significantly the composition of the primordial atmosphere. None of the terrestrial planets in our Solar System have primitive atmospheres of H and He: the atmospheres of the Earth and Venus are the result of partial degassing of their mantles. Isotope analyses demonstrate that these gases have been acquired with the solid material that built-up our planet. In fact, Earth’s gases (e.g. N, H, etc.) have a chondritic isotopic composition and not a solar composition; nevertheless, there is evidence for some solar gases (e.g. Ne, with solar isotopic composition) in the deep Earth’s mantle [149]. All this is well explained in the generally accepted view that, within the lifetime of the gaseous proto-planetary disk, the planetary embryos that formed in the inner solar system had only (approximately) the mass of Mars (see Morbidelli et al. [162], for a review). These embryos may have had thin primitive atmospheres and may even have absorbed some of these gases in their interiors. However, the terrestrial planets formed much later, after the removal of the gas from the protoplanetary disc, via mutual collisions among the embryos. During these high-energy impacts, the primitive atmospheres of the embryos got lost into space, while there was no more solar gas available to accrete. If super-Earths are analogous to solar system terrestrial planets in terms of formation process, but just more massive, they should have no H/He atmospheres either. ARIEL will be able to determine whether that is the case (see Table 3).
ARIEL Tier 1 observations will not only will confirm the presence or absence of a substantial H/He atmosphere enveloping small planets (see Sections 1.4.1 and 1.4.2), but ARIEL Tier 2 observations (see Section 1.4.3) can detect the composition of their atmospheres (SiO, H2O etc.), so we can test the validity of current theoretical predictions. More specifically: (Table 4).
1.2.5 Planets in rare and/or extreme conditions & ARIEL
As well as the population studies described in the previous paragraphs, ARIEL will observe a number of planets in extreme/odd conditions to test the physics in those extreme/unusual environments and get a glimpse of those exotic objects. We indicate here a few key examples:
-
Planets in high eccentric orbits – In contrast to Solar System planets, a large fraction of exoplanets discovered today revolve around their parent stars in eccentric orbits. In some cases the eccentricity is extreme, e.g. 0.98 for HD80606b. From a climate/chemistry perspective these planets represent a very interesting challenge (e.g. Williams and Pollard [259]): for instance Laughlin et al. [128] measured with Spitzer the thermal properties of HD80608b at periastron, finding that the planet temperature increased from 800 K to ~ 1500 K over a six-hour period. Maggio et al. [146] observed with XMM the highly eccentric HD 17156b: its parent star showed enhanced chromospheric and coronal emission a few hours after the passage of the planet at the periastron suggesting a complex planet-star interaction. The origin of the said “eccentric” planet is still being debated in the literature (e.g. [76]).
ARIEL will observe these and other similar planets to study the climate, and chemistry of high eccentricity planets. By providing the elemental composition of high-eccentricity planets, ARIEL will be able to cast light on the provenance and history of those objects.
-
Circumbinary planets – About twenty circumbinary planets, i.e. planets orbiting binary stars, including both S-orbit (planet orbiting just one of the 2 stars) or P-orbit (planet orbiting both stars at large distance) have been discovered. As in the case of eccentric planets, from a climate/chemistry perspective these circumbinary planets represent a very interesting challenge. ARIEL will observe transiting circumbinary planets to study the climate, and chemistry of these exotic bodies.
-
Transiting multi-planet systems – Among the 3500 planets discovered so far, about 600 planets are part of a planetary system. Special examples are Kepler 11 (6 transiting planets with sizes between super-Earths and Neptunes, [141]), Kepler 9 [111], 55 Cnc [78] and the most recent TRAPPIST1 (7 Earth-size planets transiting in the temperate zone of an ultra-cool dwarf, [93]). Transiting multiplanet systems give us a unique opportunity to study not just a single object, but to enable comparative exoplanetology for planets within the same extrasolar system. ARIEL observations of those and other transiting planetary systems will reveal the intra-planetary-system diversity outside our solar system. Since the planets have likely experienced a very similar formation process, this body of work will present a unique probe into the physical processes that govern the composition and structure and their evolution.
-
Disintegrating planets and planetesimals – The Kepler mission has reported the occurrence of a few transiting disintegrating planets (e.g. KIC 12557548b) and a postulated disintegrating planetesimal in orbit around the white dwarf WD 1145 + 017 (Vanderburg et al. [240]). These objects orbit their host stars in less than one day, and are suspected to carry dust tails with them. Characterizing the distribution of particle sizes will shed valuable light on the formation and evolution of the dust and, in turn, on the objects. Multi-wavelength photometry during transit (and slightly before/after) can put key constraints on the extinction cross sections of the dust particles and therefore on their sizes. So far, the observations from the UV to the IR (K′ band) have typically implied particle radii large enough (r ~0.5 μm or more) that they produce no chromatic extinction (Bochinski et al. [29]). For a given dust cloud, the cloud optical thickness depends strongly on the r/λ ratio. The fact that ARIEL will observe from 0.5 to 7.8 μm means that the optical thickness of the dust cloud can change significantly over ARIEL’s range of wavelengths. In other words, the same dust cloud that may appear optically thick at the shorter wavelengths would appear optically thin at the longer wavelengths. This information is pivotal to understanding the morphology of the dust cloud, the physical mechanisms that drive its variability, and in turn, to forming a more complete view of disintegrating planets and planetesimals.
-
Planets around flaring stars – Venot et al. [245] investigated how the activity of a star can influence the chemical composition and resulting spectra of typical exoplanets. They focused on the effect of stellar flares (see 2.2.2.5 for a discussion about flaring stars), and found significant changes in the chemistry of the atmospheres of two typical planets around an active M star. These changes are visible in the transit spectra of these planets, and the resulting differences are observable with ARIEL observations (see also [158]). ARIEL’s unique ability to measure a broad wavelength spectrum in one shot will enable the study of the atmospheres of planets around flaring stars with great accuracy and the testing/validation of theoretical predictions about planetary atmospheres in these extreme environments.
1.3 Extended use of ARIEL observations
ARIEL photometry (obtained through the FGS or by binning the AIRS spectra) will deliver high SNR signal as a consequence of targeting bright stars. In addition, this will be obtained with a cadence of up to 5 Hz, simultaneously at multiple wavelengths. High SNR and high cadence will produce transit light-curves of unprecedented precision allowing important additional (i.e. non-spectral) science at zero additional cost to the ARIEL core program.
-
ARIEL will generally produce time-series of a few hours duration since it will observe any particular star only around the time of each transit. This will provide spectra for stellar oscillations with periods less than around an hour (i.e. frequencies greater than about 300 μHz). At these relatively high frequencies, stellar variability is dominated by p-mode oscillations and by granulation noise. P-mode oscillations provide constraints on a star’s mass, radius and internal structure [113, 151]; information which is interesting in its own right but also necessary for accurate interpretation of the transits (e.g. as applied to Kepler data (Gilliland et al. [91]). Models of granulation noise (Samadi et al. [197, 198]; Cranmer et al. [51]) will benefit from testing against the suite of noise time-series which ARIEL will provide across a range of masses, rotation rates and metallicities. This will lead to a better understanding of photosphere convection and turbulence.
-
Moving to the “signal”, this can provide information about the planetary systems orbiting host stars since variations in the timing of transits are produced by perturbations from other bodies. The influence of other planets in a system has been clearly detected in Kepler data (e.g. see Fabrycky et al. [77]) but these transit time variations (TTVs) may also allow detection of moons (Sartoretti and Scheider [202, 119]) and large Trojans (Ford and Holman [79]).
-
No exomoons or exo-trojans have yet been discovered but, because of its high cadence, high precision photometry in the IR – where no limb darkening or stellar variability affect the signal – ARIEL could be the first observatory to do so. Monte-Carlo simulation of ARIEL’s TTV sensitivity assuming that the transiter is a ten Earth-mass ice-giant orbiting at the right distance from its star to have an effective surface temperature of ~ 500 K, show that the TTV signal produced by a five lunar-mass satellite orbiting at the maximum stable distance from the planet (i.e. 0.5 Hill radii, Domingos et al. [68]) is larger than the 3σ timing uncertainty. Confirmation of the exomoon candidates will require additional transit duration variation (TDV) signal, also observable by ARIEL – along with analysis of dynamic stability (Sasaki et al. [203]) – to distinguish between signals produced by planets, moons and Trojans.
1.4 Strategy to achieve the science objectives
1.4.1 How do we observe exo-atmospheres?
For transiting planets, we have five complementary methods to probe their atmospheric composition and thermal structure, which are described briefly in the following paragraphs. ARIEL will use them all.
-
1)
When a planet passes in front of its host star (transit), the star flux is reduced by a few percent, corresponding to the planet/star projected area ratio (transit depth, Fig. 20). The planetary radius can be inferred from this measurement. If atomic or molecular species are present in the exoplanet’s atmosphere, the inferred radius is larger at some specific (absorption) wavelengths corresponding to the spectral signatures of these species [37, 205, 226].

Methods adopted by ARIEL to probe the exoplanet composition and structure. Left: orbital lightcurve of the transiting exoplanet HAT-P-7b as observed by Kepler [33]. The transit and eclipse are visible. Centre: time series of brown-dwarf narrowband light curves observed with HST-WFC3 [6]. The spectral bands have been selected to probe specific atmospheric depths and unhomogeneities in the cloud decks. Right: slice mapping with ingress and egress maps as well as a combined map of HD189733b at 8 μm. These were achieved with Spitzer [66, 147]
The transit depth ΔF(λ) as a function of wavelength (λ) is given by:
where z is the altitude above Rp and τ the optical depth. Eq. (1) has a unique solution provided we know Rp accurately. Rp is the radius at which the planet becomes opaque at all λ. For a terrestrial planet, Rp usually coincides with the radius at the surface. For a gaseous planet, Rp may correspond to a pressure p0 ~ 1–10 bar.
-
2)
A direct measurement of the planet’s emission/reflection can be obtained through the observation of the planetary eclipse, by recording the difference between the combined star+planet signal, measured just before and after the eclipse, and the stellar flux alone, measured during the eclipse, Fig. 20. Observations provide measurements of the flux emitted/reflected by the planet in units of the stellar flux [46, 62]. The planet/star flux ratio is defined as:
-
3)
In addition to transit and eclipse observations, monitoring the flux of the star+planet system over the orbital period (phase curve) allows the retrieval of information on the planet emission at different phase angles (Fig. 20). Such observations can only be performed from space, as they typically span a time interval of more than a day (e.g. [33, 65, 213]).
The combination of these three prime observational techniques utilized by ARIEL will provide us with information from different parts of the planet atmosphere; from the terminator region via transit spectroscopy, from the day-side hemisphere via eclipse spectroscopy, and from the unilluminated night-side hemisphere using phase variations.
-
4)
In addition, eclipses can be used to spatially resolve the day-side hemisphere (eclipse mapping). During ingress and egress, the partial occultation effectively maps the photospheric emission region of the planet [188]. Figure 20 illustrates eclipse mapping observations [66, 147].
-
5)
Finally, an important aspect of ARIEL is the repeated observations of a number of key planets in both transit and eclipse mode (time series of narrow spectral bands). This will allow the monitoring of global meteorological variations in the planetary atmospheres, and to probe cloud distribution and patchiness (see e.g. [6] for similar work on brown dwarfs, Fig. 20).
1.4.2 ARIEL observational strategy: a 3-tier approach
The primary science objectives summarised in Sections 1.2 and 1.3 call for atmospheric spectra or photometric light-curves of a large and diverse sample of known exoplanets covering a wide range of masses, densities, equilibrium temperatures, orbital properties and host-stars. Other science objectives require, by contrast, the very deep knowledge of a select sub-sample of objects. To maximize the science return of ARIEL and to take full advantage of its unique characteristics, a three-tiered approach has been considered, where three different samples are observed at optimised spectral resolutions, wavelength intervals and signal-to-noise ratios. A summary of the survey tiers is given in Table 5. In the following subsections we report the expected performances of the ARIEL mission following the 3-tier strategy.
1.4.3 ARIEL Tier 1: exoplanet population analysis
ARIEL Tier 1 will analyse ~ 1000 exoplanets to address science questions where a large population of objects needs to be observed. For the majority of the targets observed by ARIEL, the necessary performance can be reached in 1 or 2 transits/eclipses (Fig. 24). The ARIEL Tier 1 survey mode will also allow rapid, broad characterisation of planets so that decisions can be made about priorities for future observations with Tier 2 and Tier 3. Tier 1 science questions include:
-
What fraction of planets are covered by clouds?
Tier 1 mode is particularly useful for discriminating between planets that are likely to have clear atmospheres, versus those that are so cloudy that no molecular absorption features are visible in transmission. Extremely cloudy planets may be identified simply from low-resolution observations over a broad wavelength range. This preliminary information will therefore allow us to take an informed decision about whether to continue the spectral characterization of the planet at higher spectral resolution, and therefore include or not the planet in the Tier 2 sample.
In addition, it may be possible to discriminate between broad cloud types simply using photometric indices. This will also be useful for planning follow-up observations, and additionally, if borne out by full retrieval analyses of ARIEL spectroscopic data, will increase the pool of cloudy planets to compare and contrast.
Examples of how such indices could work are given in Fig. 21. We assume that the photometric observation mode for ARIEL will utilise the three FGS photometry channels, and that the FGS prism and the two main spectroscopic channels will each be binned up to a single point, resulting in a total of six photometric points. Useful indices for cloud diagnostics are the relative slopes between these six points. Below are two examples that show clear differences in these indices for cases where cloud is either absent, deep or has low optical depth, against opaque, high grey clouds and opaque, high Rayleigh scattering clouds. In addition, it may also be possible to discriminate between vertically extended and vertically confined clouds, although this is more ambiguous (see [18]).

Preliminary cloud diagnostics using ARIEL Tier 1 type data. Plots are the result of an approximately solar composition model run for a planet with the bulk properties of HD 189733b. The channels shown are FGS 1 (FGS photometry channel from 0.8–1 μm), Prism (FGS prism between 1.25 and 2 μm) and the short and long spectroscopic channels. Colours are: black (clear atmosphere); red (Rayleigh scattering cloud, extended); orange (Rayleigh scattering cloud, confined); blue (grey cloud, extended); turquoise (grey cloud, confined). For the confined clouds, high cloud will have a lower optical depth than deeper cloud for the same specific density as the atmospheric density is reduced, so some high confined cloud models appear to show little evidence of strong cloud scattering. For the extended cloud models, cloud top altitude increases from the bottom left to the top right of the plots (see [18])
-
What fraction of small planets have still retained molecular hydrogen?
See Section 1.2.2 for a detailed description of the science case and Fig. 19 in particular.
-
Constraining/removing degeneracies in the interpretation of mass-radius diagrams
See Section 1.2.3 for a detailed description of the science case.
-
Potential classification through colour-colour diagrams or colour-magnitude diagrams
Colour-colour or colour-magnitude diagrams are a traditional way of comparing and categorising luminous objects in astronomy. By analogy with the Herzsprung-Russell diagram, which led to a breakthrough in understanding stellar formation and evolution, the compilation of similar diagrams for exoplanets might lead to similar developments ([230], Figs. 22 and 23).

Mid-infrared colour-magnitude diagrams, using Spitzer’s IRAC photometric system. The dayside emission of transiting exoplanets are represented as blue dots, while the coloured diamonds show ultra-cool dwarfs from spectral type M6 to Y1. The two lines show the locus of blackbodies with 1 Rjup (black) and 2 Rjup (grey). Planets do not follow this: they are not blackbodies. The systematic bias from the blackbody, on the right panel, indicates the presence of water in the population of planets. Whereas individual measurements were unable to extract this information, taken as a group, there is a significant detection. Adapted from [230]

Simulated mid-infrared colour-colour diagrams as will be obtained by ARIEL in the tier 1 survey. For each planet in our randomly generated sample, we determine the closest model spectrum from the grid made by Mollière et al. [160]. Then the colours in the various photometric bands are determined using the standard Spitzer/IRAC filter characteristics. To remain within the boundaries of the parameter space covered by the Mollière et al. [160] grid, each planet in the sample has been randomly assigned a temperature between 1000 and 2500 K, a metallicity between −0.5 and 2 dex, and a C/O ratio between 0.35 and 1.4. The colour coding shows the C/O ratio used for each planet. This shows that a population of planets with a low C/O ratio (blue) occupies, on average, a relatively distinct area of the diagram compared to high C/O ratio planets (red). Although we adopted IRAC bands for comparison, ARIEL will actually observe the entire spectrum and perform an optimal spectral binning afterward, therefore the bands containing more information can be determined a-posteriori during the analysis (through, for example, principal component analysis)
It is worth noting that many planetary scientists are sceptical about the usefulness of such diagrams to understand and classify planets, as they consider them too simple to capture the complexity and diversity of planets. However, as pointed out in Section 1.1.1, a large number of objects needs to be analysed to fully appreciate the underlying properties of the planetary population, a requirement which cannot be fulfilled today. Increasing by two orders of magnitude the number of planets characterised and multiplying the number of colour-filters available in the 0.5–8 μm wavelength range compared to current observations, ARIEL Tier 1 observations will provide, among other results, the ultimate test of whether an equivalent H-R diagram for planets does exist or not.
-
Albedo, bulk temperature & energy balance
Eclipse measurements of VIS and IR broadbands provide the bulk temperature and albedo of the planet, thereby allowing to estimate the planetary energy balance and whether the planet has an additional energy input, such as an internal heat source.
To generate an indicative core mission sample observable by ARIEL in 2028 during its four year mission, a list of targets with different stellar types (F, G, K, M) and planetary parameters (size: Jupiters, Neptunes, sub-Neptunes, super-Earths, Earth-size; different temperatures) has been created [264]. This list was compiled using the statistics provided by the NASA Kepler mission combined with the number/types of stars in the Solar neighbourhood (Fressin et al. [85]). More recently a few relevant papers have been published reporting revised planetary occurrence rates due to new K2 discoveries and TESS expected yields [14, 88, 152]. This information will be used in Phase B to revisit the ARIEL core mission sample. The required number of transits/eclipses to achieve the SNR/R reported in Table 5 has been calculated using the ESA Rad Model [183] and the end-to-end instrument simulator ExoSim [199]. Figure 24 shows the complete set of planet candidates observable by ARIEL Tier 1 in this indicative sample. The final list of Tier 1 targets will include an optimal sub-sample of ~ 1000 planets which can be observed during the four year mission out of the ~9500 available (see e.g. Figure 33). Different colours in Fig. 24 top panel indicate the number of transits/eclipses needed to reach Tier 1 performances (mostly one).

Top: planet candidates observable by ARIEL in the Survey modality (Tier 1) with a small number of transits/eclipses (mostly 1) divided in size bins. About ~1000 including planets of various sizes and temperatures can be observed in ~30% of the mission life-time (see Fig. 33). From Zingales et al. [264]. Left: spectral types and metallicity of the stars hosting the planet candidates observable by ARIEL in Tier 1 modality (Pillitteri and Micela [178])
1.4.4 ARIEL Tier 2: single planets & population analysis
We used the TauREx and NEMESIS spectral retrieval models to investigate the impact of wavelength coverage, SNR and spectral resolution on the retrievability of individual model parameters from transit and eclipse spectra as observed by ARIEL. Model parameters include the planetary temperature, molecular abundances and cloud parameters.
The Non-linear optimal Estimator for MultivariateE spectral analysis (NEMESIS) [115] uses a combination of the correlated-k forward model with an optimal estimation retrieval scheme (Rodgers [194]). It has been used to successfully investigate planetary atmospheres in our own Solar System and beyond [15, 16, 133]. Here simulated spectra are generated using an input atmospheric model, and random noise of the appropriate magnitude added. These are then used as inputs for the NEMESIS optimal estimation retrieval scheme and the retrieved atmospheric state compared with the input.
Tau-REx (Tau Retrieval for Exoplanets), as developed by Waldmann et al. [256, 257], is a line-by-line radiative transfer and fully Bayesian retrieval framework. It contains 1) the optimised use of molecular line-lists from the ExoMol project [220, 221, 262]; 2) an unbiased atmospheric composition prior selection, through custom built pattern recognition software; 3) the use of two independent algorithms to fully sample the Bayesian likelihood space: nested sampling as well as a more classical Markov Chain Monte Carlo approach; 4) iterative Bayesian parameter and model selection using the full Bayesian Evidence as well as the Savage-Dickey Ratio for nested models.
Figures 25 and 26 report the results obtained in the case of a hot Jupiter and warm-Neptune respectively. These simulations make us confident that Tier 2 and Tier 3 ARIEL data would provide high-precision abundances and would therefore fulfil the science objectives as stated in sec. 1.2. For the majority of the targets observed by ARIEL, these performances can be reached between 1 and 10 transits/eclipses (Fig. 27). We have also run some blind tests, where forward models of cloudy planets generated by NEMESIS were combined to a noise model generated by the ARIEL instrument simulator (Section 2.2.1.1) and then they were analysed with TauREx. TauREx and NEMESIS have been cross-validated with CHIMERA [139] and SPARC (SRON Planetary Atmosphere Retrieval Code, Min et al.). In the simulations analysed, all the parameters retrieved by the different models agree within one sigma confidence (Barstow et al., in prep; Waldmann et al., in prep.).

NEMESIS Retrieved results for signal-to-noise ratios of 7 (blue), 10 (red) and 20 (orange) for hot Jupiter HD 189733b in transit (2 panels on the left) and eclipse (2 panels on the right). Spectral fits are shown in the left-hand column, with retrieved molecular species and temperature profiles on the right. Grey bars indicate the input values for molecular abundances. A parameterized temperature profile, with variable deep and upper atmosphere temperatures, fixed knee pressures (at 0.1 and 1 bar) and an adiabat calculated in between, is retrieved for SNRs of 7 and 10, but for SNR 20 a continuous temperature profile is retrieved with a pressure correlation length of 1.5. In the upper atmosphere, the correct shape of the temperature profile can be recovered. NEMESIS retrievals of H2O, CO2, CO and CH4 abundances and the temperature-pressure profile from synthetic secondary transit spectra of cloudy hot Jupiter HD 189733b. Colours correspond to SNR = 7 (blue), SNR = 10 (red) and SNR = 20 (orange). In eclipse, especially in the presence of cloud, there is some degeneracy between absolute abundances of molecular species and temperature structure; however, the abundance ratios between species can be reliably retrieved. Figure credit Joanna Barstow

Same as Fig. 25 but for planet HAT-P-11b

Number of planets observable by ARIEL in the Deep modality (Tier 2) with a small/moderate number of transits/eclipses, divided in size bins (left) and equilibrium temperature bins (right). From Zingales et al. [264]
Phase-curves
As described in section 1.2.1.4, ARIEL phase-curves spectra will provide key observational constraints on the range of transport processes shaping the composition and vertical/horizontal structure of these atmospheres. We show here ARIEL performances in the case of phase-curves spectra for a hot super-Earth (Fig. 28). Figure 29 shows the full posterior distributions of retrievals – including chemical abundances and vertical thermal profiles – obtained with TauREx for super-Earth 55 Cnc-e at phases 0.1 (green), 0.25 (blue) and 0.5 (red) as shown in Fig. 28.

Simulated data for phase angles 0.1, 0.25 and 0.5 for super-Earth 55 Cnc e as observed by ARIEL. Phase 0.5 is considered the eclipse spectrum whereas phase 0.0 denotes mid-transit. Left: Black error-bars show the simulated spectrum at these angles and blue shaded areas the one sigma confidence interval of the retrieved emission model. The inset graphs show the marginalised posterior distributions of CO, HCN and C2H1. Right: retrieved temperature-pressure profiles at the various phases. These are snap-shots of an animation available at: http://bit.ly/2kGL4Wz (fig. Credit Ingo Waldmann)

Full posterior distributions of retrievals for super-Earth 55 Cnc e at phases 0.1 (green), 0.25 (blue) and 0.5 (red) as shown in Fig. 28. At low phase angles (< 0.1) little information is contained by the night-side dominated spectrum (here assumed to be a black body). For higher phases, molecular abundances are retrieved with surprising constancy. Variations in the spectral shape are mainly captured by varying TP-profile parameters (k1,k2,kir, α) as well as the planetary radius Rp, (fig. Credit Ingo Waldmann)
1.4.5 ARIEL Tier 3: very detailed study of select planets
Missions flying earlier than ARIEL or ground-based surveys, as well as ARIEL in its Tier 1, will likely identify “oddballs” that can have an impact on our general perspective of exoplanets. As a dedicated mission, ARIEL has the capability and the time for a detailed study of these identified interesting objects (Benchmark planets).
ARIEL Tier 3 observations will focus in particular on the study of the variability through time of the exoplanet atmospheres (weather). “Weather planets” are selected from the very best targets, i.e. planets for which the maximum ARIEL spectral resolving power and SNR > 7 can be reached in one observation. Repetition through time of the same observations will cast light on the temporal variability of the exo-atmospheres due to variations in the cloud coverage (see Fig. 21) or patterns in the global circulation (see Fig. 30). Concerning the latter, a robust feature of tidally-synchronized, close-in planets – especially hot-Jupiters – is the variability of their atmospheres. The variability is exhibited as quasi-periodicity (Fig. 30 left) and multiple equilibria (Fig. 30 right, J. Cho priv. comm). ARIEL Tier 3 observations will identify variations in the thermal vertical and horizontal structure through time and provide critical insight into the complex circulation patterns of these exotic atmospheres. These results will be used also to quantify for the first time the error introduced when we obtain only disc and time integrated spectra. By combining all the observations obtained through time for a Benchmark planet, unprecedented SNR will be achieved, enabling an extremely detailed study of the atmospheric chemistry and dynamics.

Left: Power spectrum of the quasi-periodic disk-integrated radiation flux centred on east terminator time series; the high-frequency part of the spectrum in shown in the inset. Strong peaks are demarcated at the top. The strongest peaks are in the 10–20 day periods, with the strongest at ~17 day period, in this case. Right: Multiple equilibria of hot-Jupiter atmospheres: two circulation states are exhibited from a single simulation. The top row shows a state characterized by cyclogenesis (formation of cyclonic storms), alternating in the northern and southern hemispheres. The Bottom row shows a state characterized by a translating dipole-pair, which is nearly phase-locked. Transitions between the two states, as well as a small number of others, are seen in long-duration simulations (fig. Credit, James Cho)
1.4.6 Targets available for ARIEL today
ARIEL will study a large population of planets, already discovered by other facilities. In particular, it will focus on hundreds of warm/hot gaseous objects (Jupiters, Saturns, Neptunes) and of super-Earths/sub-Neptunes around bright stars of all types. There are >200 currently known planets complying with these requirements.
The current 200 known targets, as shown in Fig. 31, have been discovered mainly close to the ecliptic plane because provided by ground-based surveys. Figure 31 also illustrates the sky visibility for ARIEL. K2, Cheops and NGTS are expected to complete the search for planets around bright sources closer to the ecliptic plane. TESS and PLATO will extend the planet search closer to the ecliptic poles, which are where ARIEL has continuous coverage.

A plot illustrating the fraction of the year for which a given location in the sky (in equatorial coordinates) is visible to ARIEL, as seen from a representative operational orbit of ARIEL around L2. Orange and green targets are the currently known best targets in term of stellar brightness and planetary parameters (green are the very best, including e.g. 55 Cnc e, HD 189733b, HD 209458 b, GJ 436 b etc.), yellow targets are currently known transiting planets observable by ARIEL (figure credit Marc Ollivier)
1.4.7 The ARIEL mission reference sample in 2028
An optimal sample of exoplanets – including both the already known exoplanets and the “expected” ones yet to be discovered – observable by ARIEL was estimated and is known as the Mission Reference Sample (MRS). The current ARIEL design enables the observation of ~1000 planets during the mission lifetime which exceeds the mission requirements. It is clear that this nominal list of planets will change over the years depending on the new exoplanet discoveries. In Figs. 32 and 33 we show a possible mission scenario where the ~ 1000 ARIEL planets are grouped according to their size, density, temperature and stellar type. Optimisation algorithms have been developed to plan the execution of the observations in the most efficient manner [90, 161].

Overview of the ARIEL MRS. The graph shows how the ARIEL 3 Tiers, i.e. Reconnaissance Survey, Deep Survey and Benchmark planets are nested [264]

Tier 1 planets plotted as a function of size versus planetary density (top) and planetary versus stellar temperature (bottom) [264]
Several surveys both from ground and from space will provide targets with the necessary characteristics to meet the objectives of the mission (i.e. 500–1000 planets observed). Table 6 summarises the most important surveys from which we expect a significant contribution to the final core sample. The list is not exhaustive.
Even without future planned and approved space missions such as CHEOPS, TESS and PLATO, there is expected to be a catalogue of >2000 possible targets to choose from available. When these missions are included as well the potential list could number > 8000. (Fig. 34)

Comparison between the TESS targets (red and yellow bars, Sullivan et al. [215]) and ARIEL target sample (green bars). TESS will be an important mission that will probably provide many of the targets for the ARIEL space mission
1.5 Uniqueness of ARIEL and synergies with other facilities
Future general purpose facilities with large collecting areas (James Webb Space Telescope, ESO-Extremely Large Telescope, etc.) will allow the acquisition of better exoplanet spectra compared to those currently available, especially for fainter targets. Tens of planets will probably be observed with JWST and E-ELT in great detail, but to address the questions of formation and evolution of exoplanets we need to be able to observe a sample that is one or two order of magnitude larger, i.e. we need a dedicated mission like ARIEL. (Table 7)
1.5.1 Complementarity ARIEL-JWST
JWST will be the most powerful space observatory for transiting planets in the coming decade, and the only one able to study the climate of temperate terrestrial planets. JWST will likely obtain high-quality transmission and emission spectra of a variety of exoplanet atmospheres over a wavelength range of 1–11 μm. However, a few key points make this great observatory unsuitable for the science case addressed by ARIEL, as detailed here:
-
1.
Obtaining JWST spectra over 1–11 μm, will typically require observations of four separate transit (or eclipse) events using four instrument modes for planets with bright host stars ([95]; Cowan et al. [56, 25]). Faint targets can be observed in 2 passes, provided they do not saturate NIRSpec near 1–2 μm (see Fig. 35).
-
2.
A first cut, notional observing program for the JWST is encompassed in the Science Observations Design Reference Mission (SODRM – http://www.stsci.edu/jwst/science/sodrm/jwst/science/sodrm/): this consists of a number of observing programs built around seven science themes designed to allow the mission team test the observation planning tools. The allocation to exoplanet science is 16.1%. This includes also direct imaging observations.
-
3.
Cowan et al. [56] anticipating that actually 25% of JWST time will be devoted to transiting planets (based on the community interest) and multiplying this by the 70% duty cycle of the observatory and a 5 year mission, estimate 320 days devoted to the observation of transiting exoplanets. They provide in Table 8 possible science portfolios for transiting exoplanets and the time required to complete the observations. If the focus is on hot-Jupiters, up to 150 planets could be observed by JWST. They conclude that a dedicated mission is needed to performance an atmospheric survey in order to compliant the detailed characterisation of the most challenging targets that will be conducted with JWST.
-
4.
JWST will have insufficient time to study the hundreds – thousands of planets discovered by current and future missions and ground-based surveys. Additionally, these observations will be heterogeneous both in terms of spectral coverage and observing mode. The best way to capitalise on these discoveries is ARIEL, designed to perform a large survey of the brightest transiting planets in its 4-year mission.
-
5.
Having a large collecting area, i.e. more photons, is certainly positive, but the lesson learnt from Spitzer and Hubble is that other aspects are also critical, especially the instrument stability and the knowledge of the instrument systematics. Kepler has been an incontestable success because it was built from start to achieve the 100 to 10 ppm photometric precision needed to discover Earth-size planets. We do not know at this time exactly how JWST data will be impacted by systematic noise, but one can assume that the noise is consistent with the best performance of HST or Spitzer as appropriate for each wavelength range. We show in Fig. 36 the comparison between JWST and ARIEL performances in the case of a hot-Jupiter. As shown from the posteriors of the molecular abundances and other atmospheric parameters, in this case the retrieved information is very similar for ARIEL and JWST.
-
6.
Instruments are most of the time not calibrated at the level needed to combine multiple observations. The ability to observe simultaneously a broad wavelength range, and the use of frequent observations to external calibrators will solve these issues in the case of ARIEL.
-
7.
Another critical point is the stellar activity (see Section 2.2.2), which often interferes with the possibility of combining measurements at different wavelengths, if recorded at different times. Barstow et al. [17] find that stellar activity could be the limiting factor for accurate retrievals of JWST observations of active stars. While simultaneous photometric observations by other observatories at relatively short wavelengths would be needed to correct this effect in the case of JWST, the ARIEL mission has been designed to be self-sufficient in its ability to correct for the effects of stellar activity. This is possible thanks to the instantaneous, broad-wavelength coverage and the strong chromatic dependence of light modulations caused by stellar variations. This is a unique capability of ARIEL, unmatched by present and future space and ground observatories.
-
8.
In the first months of observations, ARIEL will re-observe some of the targets studied by JWST for calibration purposes. In general, the knowledge acquired through JWST observations will be fed into the ARIEL observational planning: e.g. whether duplicating some of the observations by JWST is desirable to study e.g. weather variability or to record a missing data set.

J-band limiting magnitudes for the different NIRSpec modes as a function of host star temperature (http://www.cosmos.esa.int/web/jwst-nirspec/exoplanets). The colored dashed lines are for the high resolution gratings, the coloured solid lines for the medium resolution gratings, and the solid black line for the prism. Sources below the lines can be observed in the full wavelength range of the given mode as specified in the table above. Labeled planets are known optimal targets for ARIEL.

Posterior distributions of various atmospheric trace gases, temperature and top cloud pressure obtained with TauREx by retrieving the simulated spectra shown on the right, as observed by HST/WFC (green), JWST (red) and ARIEL (orange). Dashed lines in the histogram plots show the 1 sigma confidence intervals. The gases and atmospheric parameters retrieved include H2O, CO2, CO, CH4 and NH3, temperature, radius and derived mean molecular weight. There is still considerable degeneracy for retrievals from WFC3 spectra, but ARIEL and JWST data are expected to be very constraining. The information content for JWST and ARIEL in the case of bright sources is comparable, indicating that ARIEL will be able to characterize atmospheres to a similar degree of accuracy
Endmember portfolios for transiting planet science with JWST. Linear combinations of these are possible, and probably more scientifically productive: e.g., 70 × 2 = 140 days of structure, 5 × 12 = 60 days of mapping, and 1 terrestrial (100 days) also adds up to 300 days.
1.5.2 Complementarity ARIEL-E-ELT
ARIEL and E-ELT are expected to be operational in the same time-frame, i.e. 2025+. ARIEL and E-ELT observations will be highly complementary and mutually beneficial. Ground-based observations of exoplanet atmospheres have many challenges and limitations: large parts of the electromagnetic spectrum are blocked from view due to absorption and scattering in the Earth’s atmosphere. In addition, the thermal background from the sky and telescope are strongly variable, making high- precision ground-based transit or eclipse spectroscopy practically impossible from the ground at wavelengths longer than 5 μm. However, the E-ELT will be very valuable in specific ways. One particularly successful observing strategy makes use of spectroscopy at a very high dispersion of R~100,000 using the METIS instrument [34]. At this resolution, molecular bands in exoplanet spectra are resolved into hundreds to thousands of individual lines, whose signals can be combined to secure a molecular detection. Only astrophysical information over small wavelength scales is preserved, hence the line-contrast is being measured with respect to a local pseudo-continuum. This technique has been used very successfully using the VLT, for both exoplanet transmission spectroscopy [209] and emission spectroscopy (Brogi et al. [41]), and will be more effective on the next-generation of extra-large telescopes.
E-ELT observations will be highly complementary to ARIEL. The ARIEL spectra, which will be obtained over a large instantaneous wavelength range, are crucial for measuring the most important planetary atmosphere parameters − the temperature-pressure profile, the cloud coverage and the key molecular abundances. With these parameters determined by ARIEL, i.e. the local pseudo-continuum, high-resolution E-ELT observations, providing planet differential transmission and day-side spectra at specific wavelengths, can then be calibrated and used to target other, specific aspects of the planetary atmospheres. For the best observable targets, the E-ELT can provide information on the rotation of the planet and high-altitude wind speeds using the absorption line profiles [209, 210].
2 Scientific requirements
In section 2 we presented the science objectives of the ARIEL mission. Here we detail the science requirements which need to be met by the ARIEL mission to enable those objectives. These include the spectral coverage and resolution, the signal to noise ratios, the photometric stability and the data needed to be able to deal with astrophysical noise sources such as stellar variability, activity and flaring.
2.1 Required wavelength coverage, spectral resolution and S/N
To maximise the scientific impact achievable by ARIEL, we need to access all the molecular species expected to play a key role in the physics and chemistry of planetary atmospheres. It is also essential that we can observe warm and hot planets at different temperatures (mainly from ~500 K to 3000 K, Fig. 37) to probe the differences in composition potentially linked to formation and evolution scenarios.

Left: Reflected and thermal components for very hot (HAT-P-7b and CoRoT-1b), hot (HD209458b and HD189733b) and warm objects (GJ 436b and GJ 1214b). Calculations are made for a very low value of the albedo a = 0.1, and for a = 0.3 in the case of GJ1214b. The green area indicates the spectral window covered by the ARIEL, as indicated in Table 9. Right: Cloud signature in the 0.5–2.5 μm range: through the spectral coverage provided by ARIEL, clouds can be well detected and characterised (particle-size, distribution, etc.)
Broad, simultaneous wavelength coverage is therefore required to:
-
Measure both albedo and thermal emission to determine the planetary energy budget (Fig. 37).
-
Classify the variety of planets at different temperatures.
-
Detect the variety of chemical components present in warm & hot exoplanet atmospheres (Fig. 38)
Fig. 38 
Left: Spectral retrieval of cloudy hot-Jupiter atmospheres observed with transit spectroscopy. The error in the estimation of the molecular abundances is provided as a function of the spectral resolution & SNR obtainable with ARIEL (plots obtained with TauREx model, Rocchetto priv. comm). Right: Spectral retrieval of cloudy warm Neptune atmospheres observed with transit spectroscopy. The error in the estimation of the molecular abundances is provided as a function of the spectral resolution & SNR
-
Guarantee redundancy (i.e. molecules detected in multiple bands of the spectrum) to secure the reliability of the detection – especially when multiple species overlap in a spectral range (Fig. 39).
-
Enable an optimal retrieval of the chemical abundances and thermal profile (Section 1.2.3.2).
-
Detect clouds and constrain their spatial distribution and temporal variability (see Section 1.4.3).
-
Correct for stellar variability (see Section 2.2.2)


Molecular signatures in the 1–18 μm range at the required spectral resolving power of ARIEL (R = 100 for 1.95–3.9 μm and R = 30 for >3.9 μm
This means covering the largest wavelength range feasible given the temperature limits. Table 9 summarises the choices made for ARIEL in terms of wavelength bands, Resolving power (R) and required signal to noise (SNR) to maximise the scientific return.
Some spectral regions are more critical than others (see also e.g. [74, 224]):
-
(i)
For hot and warm planets, the wavelength coverage 1.25–7.8 μm is critical for ARIEL, as it guarantees that ALL the key chemical species (shown in Fig. 39) can be detected.
-
(ii)
Redundancy (i.e. molecules detected in multiple bands of the spectrum) significantly improves the reliability of the detection, especially when multiple chemical species overlap in a particular spectral range.
-
(iii)
Redundancy in molecular detection is also necessary to allow the retrieval of the vertical thermal structure and molecular abundances [17].
-
(iv)
The moderate resolving power of ARIEL will permit the detection of most molecules at warm and hot temperature given the spectral broadening [224].
-
(v)
Two photometric bands in the visible and one in the NIR are sufficient to measure the planetary albedo (see Fig. 37), and to correct for stellar variability (see Section 2.2.2).
-
(vi)
The spectrograph in the NIR and VIS/NIR photometers enable to detect and differentiate between of Rayleigh scattering as opposed to clouds/hazes (see Fig. 37 right).
2.2 Dealing with Systematic and Astrophysical Noise
2.2.1 ARIEL performance requirements
ARIEL’s top-level requirement is that the photometric stability over the frequency band of interest shall not add significantly to the photometric noise from the astrophysical scene (star, planet and zodiacal light). The frequency band over which the requirement applies is between 2.8 × 10⁻⁵ Hz and 3.7 mHz, or ~5 min to 10 h [70, 173, 183, 255]. This implies having the capability to remove any residual systematics and to co-add the elementary observations from many repeat visits to a given target. The photometric stability budget is described in detail in Sarkar et al. [200] using the tools described by Pascale et al. [173], Waldmann and Pascale [255] and Puig et al. [183]. To achieve the required performance, particular attention is required to:
-
the design of the spacecraft, payload and instruments
-
the calibration strategy to characterise all possible systematic variations in performance
-
the data processing pipeline(s).
The top level science requirements for ARIEL on sensitivity are to meet a signal to noise ratio (SNR) of 7 for the resolutions defined in Table 9 for each of the Survey tiers. A derived requirement from this has been formulated during Phase A by the ESA Science Study Team using the ESA Radiometric Model to specify parameters X and Nmin such that the system level noise (after post-processing) shall be lower than X times the astronomical noise floor (defined by the RSS of stellar target and zodiacal background shot noises) plus an absolute noise floor Nmin:
Where N0 is the flux of the target star being observed. The parameter X covers all noise sources which are related to the target brightness (such as jitter noise) and parameter Nmin covers all other source (such as detector dark current and read noise). The required values of X and Nmin are shown in Fig. 41. These parameters give an equivalent photometric stability in the target frequency band of between 10 and 50 ppm for all the ARIEL required targets depending on the source brightness.

ExoSim Model Architecture

Right: Performance of ARIEL for the brightest, bright and faintest targets compared to noise requirements from the Mission Requirements Document. The requirements are shown by the bold grey lines, the thin grey lines denote the channels and the red, green and blue are the different targets. The noise requirements are expressed as the achieved Varience on the signal (Var(s)) must be less a factor of (1 + X) above the target star signal (N0) with an absolute varience floor of Nmin. Hence the noise requirement is that Var(s) = (1 + X)N0 + Nmin where X and Nmin are given in the plots above for each channel. These noise requirements are shown to be equivilent to a photometric stability requirement of 10 – 100 ppm for the range of target brightnesses covered by ARIEL. Left: Expected output (with error bars) from the ARIEL processed data product compared with the input model assumption for a hot super-Earth similar to 55-Cnc-e around a G-type star with Kmag of 4. ARIEL performances using 8 eclipses (~32 h of observation) are compared to currently available data for 55 Cnc e from Spitzer-IRAC (8 eclipses, [65]) and performances of Hubble-WFC3 extrapolated from transit observations of 55 Cnc e [232]

Time series showing the effect of simulated granulation and pulsations on the bolometric luminosity of a star of spectral type M2V. The plot has a timebase of 20 h, sampled every 10 s

AIRS Ch0 noise budget for GJ1214 showing the noise from granulations and pulsations (shown in green) in relation to other noise sources. The photon noise limit arising from the source is shown in blue. The noise from granulations and pulsations is not significant when compared to the photon noise and most other noise sources

simulated GJ1214 by ARIEL-Sim (assuming spot coverage of 10%). Left: with faculae. Centre: with spots only. Right: mixture of coupled and uncoupled faculae

10% hemispheric spot coverage with uniform spatial distribution pattern. Left: uniform size distribution. Right: log-normal size distribution

Top: ARIEL-Sim configuration showing an equatorial latitudinal band crossed by a ‘high impact parameter’ planet transit chord, the example shown is the transit chord for GJ 1214 b, where the planet crosses mostly the unspotted region (left) and a ‘low impact parameter’ transit chord, here simulated as equatorial, crossing over the band (right). Bottom: ARIEL-Sim configuration showing active longitudes with the planet crossing directly over the regions (right), and crossing at a higher latitude (left)

Transit spectra for a hot-Jupiter similar to HD209458b orbiting a G0V star. Spots and faculae are included in the simulations, the respective temperatures are 4100 K and 6335 K (SEDs obtained with Phoenix model). The clouds (bottom right) are assumed to be very high altitude (1 mbar) grey clouds. We note that spot activity for the sun is of the order of 0.1%

Retrieved molecular abundances, planetary parameters and stellar spot/faculae distribution for a cloud-free gaseous planet orbiting an inactive star (red plot) and an active star with Spots 10%, Faculae 60%. Simulations done with Tau-REx (Waldmann, Sarkar et al.). The ground truth to be retrieved is log10(H2O) = −4.0, log10(CH4) = −4.0, T = 1400 K, Rp = 1.35. The mean molecular weight μ is not fitted but derived from the atmospheric chemistry

Left: Probability (# Flare Epochs/ #Epochs) to detect a flare for stars from M0 to M6 as a function of the band. Right: Multi-wavelength observations of a bright flare in AD Leo. The entire time span is 30 min. The variation in the U band is of the order of 1.5 magnitude (at peak) while the upper limit in K is less than 0.02 mag
In deriving the noise performance requirements, a sensitivity study has been completed that shows that the mission science goals are very robust against the noise parameters assumed. The minimum required noise performance (which is exceed by the design) allows the mission science to be achieved with up to 1000 planets being observed within the baseline mission lifetime to the required SNR. Increases in the noise levels lead only to a gradual degradation of the number of targets that can be successfully observed in each of the 3 tiers during the mission life.
The ARIEL end-to-end instrument simulator: ARIEL-Sim
The ExoSim tool [199] has been used to simulate the performance of the ARIEL system (Fig. 40). ExoSim is a generic, numerical end-to-end simulator of transit spectroscopy intended as open-access software. It permits the simulation of a time-resolved spectroscopic observation in either primary transit or secondary eclipse. The observational parameters can be adjusted, and the telescope and instrument parameters changed in a simple manner to simulate a variety of existing or proposed instruments. ExoSim is a tool to explore a variety of signal and noise issues that occur in transit spectroscopy observations, including the effects of the instrument systematics, correlated noise sources, and stellar variability. The simulations are fast, which allows ExoSim to be used for Monte Carlo simulations of such observations. A specific instance “ARIEL-Sim” has been created with the baseline instrument parameters of the payload and spacecraft performance detailed in [200].
The simulator has been validated against both existing published transit data ([26], Kreidberg et al. [125, 126]), and the combination of simulator and ARIEL specific instrument parameters has been validated against the independent (static) Radiometric Model prepared by ESA [183]. The simulations include a representative pointing jitter timeline (supplied by the ESA industrial study teams) and all other noise sources identified in [200]. A basic data reduction pipeline (not using optimal data extraction and noise decorrelation techniques at this stage) is used to post-process the output data in the same way as the real science data will be handled.
Postprocessing analysis techniques
Within the ARIEL consortium, we have developed field-leading time series decorrelation techniques based on non-parametric machine learning ([251, 254] [164,134,135,167, 253]; Damiano et al. [58]) which recently won the Spitzer time-series data challenge [127] and enabled the first detection of a super-Earth’s atmosphere with Hubble-WFC3 [232]. These techniques are highly complementary to traditional de-trending and post-processing as they de-trend the data from systematic (e.g. instrument) noise on a purely statistical basis. Hence, we can well address any residual systematic noise that has not be captured by more traditional, parametric data de-trending routines.
2.2.2 Correcting for stellar activity
The differential spectroscopy measurement strategy of ARIEL (before/during/after the transit) may be affected by changes in the host star spectrum on the timescale of the transit. Changes in the host star spectrum are caused by magnetic activity (flares, co-rotating active regions and spots) and convective turbulence (granulation, pulsations). Results from the Kepler mission [20] indicate that most G dwarfs have photometric dispersions less than 50 ppm over a period of 6 h, while most late-K and M dwarfs vary at a level of some 500 ppm. Note that Kepler operates in the visible where stellar photometric variability is few times higher than in the “sweet spot” of ARIEL – the NIR and MIR – because of the contrast between surface inhomogeneities and the stellar photosphere.
The ARIEL mission has been designed to be self-sufficient in its ability to correct for the effects of stellar activity. This is possible thanks to the instantaneous, broad-wavelength coverage and the strong chromatic dependence of light modulations caused by stellar variations. This is a unique capability of ARIEL, unmatched by present and future space and ground observatories.
The impact of stellar variations on the ARIEL data has been carefully evaluated in parallel by many teams part of the ARIEL consortium working on stars [109, 156, 204, 263] and more specifically through ARIEL-Sim [201]. We have explored several possible approaches to evaluate the effect of oscillations and stellar activity and developed methodologies to prove the performance of ARIEL data in reaching the required precision. We describe here these methodologies.
ARIEL-Sim simulations of impact of stellar variability on ARIEL observations
We have simulated two sources of stellar variability:
-
a)
convection-driven variability arising from pulsations and granulations
-
b)
star spot activity.
These simulations have been coupled with the end-to-end simulator, ARIEL-Sim incorporating the ARIEL instrument model, to obtain estimates of the impact of these sources of variability on ARIEL observations
-
Pulsations and granulations
Convection in the outer layer of stars induces stochastic pulsations and the emergence of granulation on the stellar surface. Both of these phenomena cause local temperature fluctuations and yield a stellar effective temperature that varies over time. Figure 42 shows time series from the convection model simulating pulsations and granulations. For oscillations, the timescales and amplitudes of optical and infrared variability were calculated based on University of Leuven’s simulations using the BiSON solar data from Broomhall et al. [42] where amplitudes and frequencies were rescaled using the scaling relations from Kjeldsen and Bedding [120]. The peak-to-peak variation due to oscillations was computed on a 10 h basis. The Marcs model atmosphere parameters for the different spectral types were chosen following Habets and Heintze [105] and Pickles [177]. For granulation, the variability for solar type stars was simulated using different red noise components due to active regions and background granulation [171]. The scaling from the optical to the infrared was done using SEDs from Marcs models [104].
Timelines from these models were incorporated into the ARIEL ExoSim model and the noise resulting on the out-of-transit timelines obtained for each spectral bin and channel. An example is shown in Fig. 43, which shows the noise budget for M-dwarf GJ1214 (faintest required target) in AIRS channel 0, where the stellar convection noise can be compared to the contribution of other noise sources. We find that noise from granulations and pulsations is insignificant when compared to the photon noise and most other noise sources.
-
Star spots/faculae
A stellar spots/faculae model has been developed which is now fully integrated with ARIEL-Sim [201]. The model can simulate different star classes, with spots and faculae of different sizes, temperatures and spatial distributions.
We note that the spot temperature contrast has a known relationship to spectral class (E.g. Andersen and Korhonen [5]), but the faculae contrast is not so well constrained in stars other than the Sun. The facula brightness temperature for the Sun also varies with limb position. The faculae temperature contrast in ARIEL-Sim is based on the ratio of average faculae: spot temperature contrast in the Sun and scale for other stars based on their spot contrast. Secondly the exact faculae: spot area (Q) ratio is not well established for stars other than the Sun. There is some evidence that the Q ratio is lower in more active (higher spot fraction) stars. A relationship based on extrapolation of data in Chapman et al. (1997) is used to predict the Q ratio at spot fractions much higher than exist on the Sun. The Q ratio falls with spot coverage based on this relation. Pixelation and overlap effects reduce the final Q ratio somewhat from the input Q ratio.
Due to this uncertainty, spots-only simulations in addition to spots and faculae can be run to assess the worst-case scenario of unopposed spot effects, though the faculae simulation is based on reasonable physical assumptions.
To address the concern that plage areas might not always be associated with spots, the plage areas can be uncoupled from the spots if required. Figure 44 right is an example of a 1% spot coverage case (with an equatorial spatial distribution) where a fraction of the faculae coverage is uncoupled to the spots, giving a final Q ratio of 10:1.
A default log-normal distribution is used for the size distribution of spots based on the size distribution pattern for the Sun (Bogdan [31, 211]) adapted for different spot coverages. However, ARIEL-Sim can also simulate spots with uniform size distributions as shown below for a 10% hemispheric spot coverage case, where the cold spots are 2 degrees in diameter (Fig. 45).
ARIEL-Sim can simulate active regions as well as uniform distributions. In Fig. 46 we show four distinct configurations.
The transit of a planet across the spotted star can be simulated at multiple wavelengths and the resulting light curves from the ARIEL instrument model recovered, and used to obtain a reconstructed planet spectrum with the effects of spots/faculae in each channel. Spots/faculae may affect transit depths and the reconstructed spectrum in a number of ways:
-
Unocculted spots/faculae may increase/decrease the transit depth, with the bias being wavelength dependent.
-
Occulted spots/faculae may reduce/increase the transit depth obtained through curve fitting, with the amplitude on the light curve being wavelength dependent.
-
Occulted/unocculted spots with molecular absorption features can contaminate the planet spectrum.
The situation is simpler for eclipses, where the planetary emission follows directly from the depth measurement. In this case, only activity-induced variations on the timescale of the duration of the occultation need to be corrected to ensure that the proper stellar flux baseline is used.
Stellar spots/faculae simulations using the ARIEL-Sim was used in particular to explore the effects of stellar activity on transit spectra. We show in the next paragraph the impact of said uncorrected activity on the retrieval of atmospheric and planetary parameters. In 2.2.2.2 we report various decorrelation methodologies published in the literature to mitigate the effects of spots and faculae.
-
Impact of stellar activity to spectral shapes
The TauREx spectral retrieval code was upgraded to assess the impact of stellar activity due to spots and faculae to transit and eclipse spectra and retrieved results. The code can simulate several combinations of spots and faculae (spot/faculae size distribution, % star coverage, spatial distribution), for stars of different temperatures (Waldmann and Sarkar, submitted). SEDs of stars are simulated with Phoenix models.
As illustrated by Fig. 47, spots and faculae will impact primarily the short wavelengths. Spots’ and Faculae’ contributions at wavelengths longer than 2 μm are in the Rayleigh-Jeans tail of the stellar/spot/faculae SEDs and exhibit sufficiently smooth trends (when modelled with Phoenix models) for the relative retrievals of trace gas abundances to not be biased by unocculted spots/faculae. Most spot/faculae effects are observed <1.0 μm and exhibit smooth trends where complex molecules are predominantly detected. The main effect observed is a bias to the absolute Rp/Rs level (i.e. spectra shifted up or down) for large coverage of spots or faculae. Figure 47 further shows the effect of various combinations of unocculted spots and faculae coverages for a G0V (HD 209458 type) star. This near constant bias in Rp/Rs over 2 μm can affect the retrieval accuracy of the planet radius and temperature mainly but, due to the lack of sharp spectral features in the main ARIEL wavelengths, we find that unocculted stellar activity does not significantly bias trace gas abundance retrieval results.
Figure 48 shows the retrievals of a very spotty star with 10% spot coverage and 60% faculae and the retrieval of a spot/faculae free star. In both cases the spot and faculae coverage, spot and faculae temperatures as well as the trace gases (H2O, CH4), planet radius and temperatures were fitted as free parameters. As seen in Fig. 48, trace gas abundances were retrieved with good accuracy without systematic biases. We note that these cases all assume an extremely pessimistic level of uncorrected stellar activity. Here the stellar activity information contained in <1 μm data has not been used to correct for these effects (or as informed priors on stellar activity parameters) but instead has been taken as ‘unknown and uncorrectable’ parameters in this study. Hence, these retrievals/spectra very much present an unrealistic worst-case scenario.
Methods to correct the effect of star spots on transit spectra
Different methods have been developed by members of the ARIEL consortium or were published in the literature to correct for effects occurring during transits. These and other methods will be further tested in Phase B to evaluate their applicability and effectiveness in correcting ARIEL data.
-
Herrero et al. [109] developed a stellar simulator including surface inhomogeneities (spots, faculae), limb darkening/brightening and time-variable effects such as differential rotation and active region evolution. They used said simulator to assess the correlation between activity-induced transit depth variations in the visible (0.8 μm) and the IR (2.5 and 5.0 μm). The existing correlation was used to correct the transit data down to 10 ppm. A different approach based on Principal Component Analysis, has been developed by Micela [156] with similar conclusions. Zellem et al. [263], Bruno et al. [43] proposed the analysis of out of transit lightcurves to correct/identify the noise due to stellar activity.
-
A further approach has focused on statistical methods to de-correlate astrophysical noise from the desired science signal. Given single time series on an active star with various modes of pulsation obtained by the Kepler space telescope, Waldmann [251] showed that a randomly chosen pulsation mode of the star could be isolated and the remaining autocorrelative noise of the star suppressed, resulting in a strong reduction of the stellar noise component. Similar concepts apply to periodic exoplanetary lightcurves observed over multiple transits and/or wavelengths. The results were repeated for a sample of Kepler stellar light curves, spanning from M to G types. In all cases a correction of the order of 10–100 ppm in the visible wavelengths depending on the frequency of the sampling (i.e. 10 h continuous observations every day or 10 h once a week), was obtained.
-
Despite the high activity of GJ1214 in the optical due mainly to faculae, as described in Rackham et al. [186], in the NIR Kreidberg et al. [125, 126] do not detect signs of activity in the 12 WFC3 transit spectra analysed, an analysis confirmed by Zellem et al. [263].
-
The star CoRoT-2 is notoriously very active and has been observed extensively with Corot. Bruno et al. [43] presented a new method for the fit of transit photometry which takes into account the impact of activity features on the transit. This approach models both non-occulted and occulted features and their evolution. The method was applied to correct the light curve of CoRoT-2 in two ways. The first is based on the simultaneous modelling of activity features and transits in a non-normalized light curve. The second consists in normalizing the transits by using the modelling of the out-of-transit light curve, and then in a standard fit of the so-normalized transits.
Flares
Flares show up as stochastic stellar variations on short time scales on all solar type stars (A to BDs). They are rare events, more prominent in the bluest bands than in the red and in infrared, since their emission is due to material heated by magnetic reconnection (up to ten(s) thousand degrees). Recently Balona [10] analysed the flare properties along the HR diagram making usage of the short (1 min) cadence Kepler data of 4758 stars from A to M types spanning a few months. These data have a cadence sufficient to resolve even relatively short flares and a photometric precision of 0.1 ppt (part per thousand). Their results indicated that only 209 stars show flares for a total of 3140 flares. This number indicate that flaring stars are rare, with a maximum of ~10% among the K-M stars (see Table 10 from Balona [10]). Furthermore, the average number of flares for each flaring star (~15) indicates that flaring/non-flaring stars belong to different classes, and that it is very unlikely that a star in the non-flaring class shows a flare. Flaring stars are more common among fast rotators and therefore among active young stars. Most of those will not be observed by ARIEL.
The first step will be, therefore, the identification of planets around flaring stars and either eliminate them from the sample, or actually target them for specific science cases [245]. However even if after the cleaning of the sample, some flares will occur, it will be possible to recognize a typical flare from the shape of light curve with the photometric channels from the FGS. The typical sudden rise and slow decay signature of a flare over one/several hours allows to disentangle it from a transit signature. The hot color of the flare emission will also allow to use the two optical channels to recognize the flare in the light curves and discard the data if necessary.
If some low intensity flares remain undetected in the optical channels, the contamination of the NIR-MIR spectra will be very limited. In fact, a recent detailed study of three M dwarf flare stars [229] and M dwarf stars from SDSS and 2MASS surveys, Davenport et al. [60] performed a multi-wavelength characterization of flares in low-mass stars. Using their results, it is possible to obtain the relation between the flare intensity in the u-band and in the IR. The flare intensity reduces towards the longer wavelengths nearly following a power-law, and it depends on the sub-spectral type. In Table 11 ∆mu and ∆mv are the expected magnitude changes in the U and V band, respectively, and produce effects in K band at levels as indicated (courtesy of J. Zoreck, IAP), while Fig. 46 left from Davenport et al. [60] gives the probability to detect a flare for stars from M0 to M6 as a function of the band.
Globally the flare effect in the NIR is therefore very small, as illustrated from the case of AD Leo (a very active M-star) reported in Fig. 49 right (from [60]). In Table 11 we give example of intense flares for M0 and M3 stars. Earlier spectral type stars will have flares of significantly lower intensity.
To summarize, stars with intense flaring are uncommon and might not make it to the final ARIEL sample. Isolated flares would be immediately identified with the FGS and the flare effect in the IR is very small.
2.3 The ARIEL data policy
The ARIEL data policy has been designed to embrace the astronomy community in general and the exoplanet community in particular. It is recognised that ARIEL data and data products will be of huge interest to the entire exoplanet community, not only to those directly involved in the mission. The intention is to provide high quality data in a timely manner and to have a continuous dialogue with the wider community, maximising the science that can be achieved by the mission.
Inputs to the target list – to be observed will be solicited from the wider community (e.g. through whitepapers, meetings, and other mechanisms), the community will be kept informed about the status of the target list, as will the ESA Advisory Bodies whose feedback will be solicited.
A Science Demonstration Phase (SDP) will be conducted as the final step before routine science phase operations commence. The SDP is foreseen to provide approximately one month worth of data observed in the same manner that the core survey will be conducted. These data will be made public on a timescale of about a month, in conjunction with organisation of a major public workshop.
Regular timely public releases of high quality data products at various processing levels will be provided throughout the mission. The data will be pipeline processed to different levels of data products labelled ‘raw telemetry’ (level 0), ‘raw spectral frame cubes’ (level 1), ‘target (star + planet) spectra’ (level 2), and ‘individual planet spectra’ (level 3), respectively. The lower levels can generally be released quicker than higher levels, but the objective is to release all levels timely in order to maximise the science return and impact of ARIEL.
Beyond the science community, ARIEL’s mission to characterise distant worlds offers an immense opportunity to capture the public imagination and inspire the next generation of scientists and engineers. Through the provision of enquiry-based educational programmes and citizen science platforms, school students and members of the public will have the opportunity to participate directly in the analysis of ARIEL data.
3 Conclusions
We have presented in this paper an overview of the science objectives for the ARIEL mission and the worked completed during the Phase A study. In order for the ARIEL mission to address the fundamental questions of “what are exoplanets made of” and “how do planetary systems form and evolve”, the investigation of many hundreds of planetary atmospheres will be needed. By observing a large number (~1000) of transiting planets from a range of different classes of objects we will gain a statistical understanding of their nature.
The main ARIEL focus will be on warm and hot planets to take advantage of their well-mixed atmospheres which should show minimal condensation and sequestration of high-Z materials and thus reveal their bulk and elemental composition (especially C, O, N, S, Si). Observations of these warm/hot exoplanets will allow the understanding of the early stages of planetary and atmospheric formation during the nebular phase and the following few million years. ARIEL will thus provide a truly representative picture of the chemical nature of the exoplanets and relate this directly to the type and chemical environment of the host stars.
The combination of a stable platform, operating in a stable thermal environment and with a highly integrated payload and systems design, will ensure the very high level of photometric stability required to record exoplanet atmospheric signals, i.e. 10–50 ppm relative to the star (post-processing). The broad, instantaneous wavelength range covered by ARIEL will allow to detect many molecular species, probe the thermal structure, identify/characterize clouds and monitor/correct the stellar activity. Finally, requiring an agile, highly stable platform in orbit around L2, from which the complete sky is accessible within a year, will enable the observation of hundreds of planets during the mission lifetime.
Notes
The scale height H of an atmosphere is the altitude at which the atmospheric pressure decreases by 1/e. H = k T/μ g; where: k Boltzmann constant, T atmospheric temperature, g gravity acceleration, μ atmospheric mean molecular weight. ARIEL can measure directly T through eclipse measurements, g is known through the radius and mass, so a measure of the scale height determine μ, the molecular weight of the atmosphere.
References
Adams, E.R., Seager, S.: ApJ. 673, 1160 (2008)
Agúndez, M., et al.: A&A. 548, A73 (2012)
Agúndez, M., et al.: A&A. 564, A73 (2014)
Alonso, R., et al.: ApJ. 613, L153 (2004)
Andersen, J.M., Korhonen, H.: Mon. Not. R. Astron. Soc. 448, 3053 (2015)
Apai, D., et al.: ApJ. 768, 121 (2013)
Artigau, É., Donati, J.-F., Delfosse, X.: 16th Cambridge workshop on cool stars, stellar systems, and the sun. Astron. Soc. Pac. 448, 771 (2011)
Auvergne, M., et al.: Astron. Astrophys. 506, 411 (2009)
Ballerini, P., et al.: A&A. 539, 140 (2012)
Balona, L.A.: Mon. Not. R. Astron. Soc. 447, 2714 (2015)
Bakos, G.A., et al.: PASP. 114, 974 (2002)
Baraffe, I., Chabrier, G., Barman, T.: A&A. 482, 315–332 (2008)
Barman, T.S.: ApJ. 661, L191 (2007)
Barclay, T., et al., AJ submitted, arXiv:1804.05050. (2018)
Barstow, J.K., et al.: MNRAS. 430, 1188 (2013a)
Barstow, J.K., et al.: MNRAS. 434, 2616 (2013b)
Barstow, J.K., et al.: MNRAS. 448, 2546 (2015)
Barstow, J.K., et al.: ApJ. 834, 50 (2017)
Baruteau, C., et al.: Protostars and Planets VI. University of Arizona Press. 667 (2014)
Basri, G., et al.: AJ. 141, 20 (2011)
Batalha, N.: Proc. NAS. 111, 12647 (2014)
Bean, J.L., et al.: Nature. 468, 669 (2010)
Beaulieu, J.-P., et al.: MNRAS. 409, 963 (2010)
Beaulieu, J.-P., et al.: ApJ. 731, 16 (2011)
Beichman, C., et al.: PASP. 126, 1134 (2014)
Berta, Z., et al.: ApJ. 747, 35 (2012)
Bethe, H.A.: Phys. Rev. 55, 434 (1939)
Birkby, J.L., et al.: MNRAS. 436, L35 (2013)
Bochinski, J.J., et al.: ApJL. 800, L21 (2015)
Bodenheimer, P., et al.: ApJ. 548, 466 (2001)
Bogdan, T.J., et al.: Astrophys. J., (ISSN 0004-637X). 327, 451 (1988)
Bounaceur, R., et al.: Int. J. Vehicle Design. 44, 124 (2017)
Borucki, W.J., et al.: Science. 325, 709 (2009)
Brandl, B., et al.: Proc. SPIE. 9908, 74 (2016)
Brewer, J.M., et al., AJ (2016) arXiv:1612.04372
Broeg, C., et al.: EPJWC. 47, 03005 (2013)
Brown, T.M.: ApJ. 553, 1006 (2001)
Burrows, A., Sharp, C.M.: ApJ. 512, 843 (1999)
Burrows, A., et al.: ApJ. 661, 502 (2007)
Burrows, A., Budaj, J., Hubeny, I.: ApJ. 678, 1436 (2008)
Brogi, M., et al.: Nature. 486, 502–504 (2012)
Broomhall, A., et al.: MNRAS. 396, L100 (2009)
Bruno, G., et al.: A&A. 595, A89 (2016)
Cassan, A., et al.: Nature. 481, 167 (2012)
Charbonneau, D., et al.: ApJ. 568, 377 (2002)
Charbonneau, D., et al.: ApJ. 626, 529 (2005)
Charbonneau, D., et al.: ApJ. 686, 1341 (2008)
Charnay, B., et al.: ApJL. 813, L1 (2015)
Chatterjee, S., et al.: ApJ. 686, 580 (2008)
Cho, J.Y.-K., et al.: ApJ. 675, 817 (2008)
Cranmer, S.R., et al.: Astrophys. J. 781, 124 (2014)
Crossfield, I.J.M., et al.: ApJ. 723, 1436 (2010)
Crossfield, I.J.M.: ApJS. 226, 7 (2016)
Crouzet, N., et al.: ApJ. 761, 7 (2012)
Crouzet, N., et al.: ApJ. 795, 166 (2014)
Cowan, N.B., et al.: Publ. Astron. Soc. Pac. 127, 311 (2015)
D’Angelo, G., et al. Vol. 2011, pp. 319 U. of Arizona Press (2011)
Damiano, M., et al.: AJ. 154, 39 (2017)
Danielski, C., et al.: ApJ. 785, 35 (2014)
Davenport, J.R.A., et al.: ApJ. 748, 58 (2012)
Davies M. B., et al., Protostars and Planets VI, University of Arizona Press, p. 787 (2014)
Deming, D., et al.: Nature. 434, 740 (2005)
Deming, D., et al.: ApJ. 774, 95 (2013)
Demory, B.O., et al.: ApJ. 776, L25 (2013)
Demory, B.O., et al.: Nature. 532, 207 (2016)
De Wit, J., et al.: A&A. 548, 128 (2012)
De Wit, J., et al.: Nature. 537, 69 (2016)
Domingos, R.C., Winter, O.C., Yokoyama, T.: Mon. Not. R. Astron. Soc. 373, 1227–1234 (2006)
Dumusque, X., et al.: ApJ. 789, 154 (2014)
Eccleston, P., et al.: Proc. SPIE. 9904, 33 (2016)
Eccleston P., et al., Exp. Astron. Submitted (2017)
Eddington, A.S.: MNRAS. 84, 308 (1924)
Elkins-Tanton, L.T.: Astrophysics and Space Science. 332, 359 (2011)
Encrenaz, T., et al.: Exp. Astron. 40, 523 (2015)
Espinoza, N., Fortney, J., Miguel, Y., et al. ApJL (arXiv:1611.08616) (2013)
Fabricky, D., Tremaine, S.: ApJ. 669, 1298 (2007)
Fabrycky, D.C., et al.: ApJ. 750, 114 (2012)
Fisher, D.A., et al.: ApJ. 675, 790 (2008)
Ford, E.B., Holman, M.J.: Astrophys. J. 664, L51 (2007)
Forget, F., Leconte, J.: Phil. Trans. R. Soc. A. 372, 20130084 (2014)
Fortier A. et al.: Proc. SPIE 9143, id. 91432J (2014)
Fortney, J., et al.: ApJ. 659, 166 (2007)
Fossati, L., et al.: ApJL. 714, L222 (2010)
Fraine, J., et al.: Nature. 513, 526 (2014)
Fressin, F., et al.: ApJ. 766, 81 (2013)
Fu, G., et al.: ApJL. 847, L22 (2017)
Fukui, A., et al.: ApJ. 770, 95 (2013)
Fulton, B.J., et al.: AJ. 154, 109 (2017)
Garcia-Munoz, A., Isaak, K.: PNAS. 112, 13461 (2015)
Garcia-Piquer, A., et al.: Exp. Astron. 40, 671 (2015)
Gilliland, R.L., et al.: Publ. Astron. Soc. Pac. 122, 131 (2010)
Gillon, M., et al.: Nature. 533, 221 (2016)
Gillon, M., et al.: Nature. 542, 456 (2017)
Grasset, O., Schneider, J., Sotin, C.: ApJ. 693, 722 (2009)
Greene, T.P., et al.: ApJ. 817, 17 (2016)
Grillmair, C.J., et al.: Nature. 456, 767 (2008)
Guillot, T., et al.: Astrophys. J. Lett. 459, L35 (1996)
Guillot, T.: Science. 286, (1999)
Guillot, T., Gladman, B.: Disks, Planetesimals, planets, ASP conference proc. 219 (2000)
Guillot, T., Showman, A.: A&A. 385, 156 (2002)
Guillot, T.: Ann Rev Earth Planet Sci. 33, 493 (2005). https://doi.org/10.1146/annurev.earth.32.101802.120325
Guillot, T.: Phys. Scr. 130, id. 014023 (2008)
Guillot, T.: A&A 520, id.A27 (2010)
Gustafsson, B., et al.: A&A. 486, 951 (2008)
Habets, G.M.H.J., Heintze, J.R.W.: A&AS. 46, 193 (1981)
Hammond, M., Pierrehumbert, R., ApJ in press (2017)
Hansen, B.M.S., et al.: MNRAS. 450, 4505 (2015)
Helled, R., Lunine, J.: MNRAS. 441, 2273 (2014)
Herrero, E., et al.: Exp. Astron. 40, 695 (2015)
Hertzsprung, E.: Publ. Astrophys. Observ. Potsdam. 22, 1 (1911)
Holman, M.J., et al.: Science. 330, 51 (2010)
Howell, S.B., et al.: PASP. 126, 398 (2014)
Huber, D., et al.: ApJ. 767, 127 (2013)
Ikoma, M., Hori, Y.: ApJ. 753, 66 (2012)
Irwin, P., et al.: JQSRT. 109, 1118 (2008)
Kataria, T., et al., 801 86 (2015)
Kim, S.J., et al.: Icarus. 257, 217 (2015)
Kite, E.S., et al.: ApJ. 828, 80 (2016)
Kipping, D.M., et al.: ApJ. 750, 115 (2012)
Kjeldsen, H., Bedding, T.R.: A&A. 529, 8 (2011)
Kley, W., Nelson, R.P.: ARAA. 50, 211 (2012)
Knutson, H.A., et al.: Nature. 447, 183 (2007)
Knutson, H.A., et al.: Nature. 505, 66 (2014)
Konopacky, Q.: MEMSAI. 84, 1005 (2013)
Kreidberg, L., et al.: Nature. 505, 69 (2014a)
Kreidberg, L., et al.: ApJL. 793, LL27 (2014b)
Ingalls, J.G., et al.: AJ. 152, 44 (2016)
Laughlin, G., et al.: Nature. 457, 562 (2009)
Leconte, J., et al.: Exp. Astron. 40, 449 (2015a)
Leconte, J., Chabrier, G.: A&A. 540, 20 (2012)
Leconte, J., Chabrier, G.: NatGe. 6, 347 (2013)
Leconte, J., Forget, F., Lammer, H.: Exp. Astron. 40, 449 (2015b)
Lee, J.-M., Fletcher, L.N., Irwin, P.: MNRAS. 420, 170 (2012)
Léger, A., et al.: Icarus. 213, 1 (2011)
Léger, A., Selsis, F., Sotin, C., et al.: Icarus. 169, 499 (2004)
Levison, H.F., et al.: Astron. J. 142, 152 (2011)
Lindegren, L., et al.: IAU Symp. 248, 217 (2007)
Line, M.R., Yung, Y.: ApJ. 779, 6 (2013)
Line, M.R., et al.: AJ. 152, 203 (2016)
Linsky, J.L., et al.: ApJ. 717, 1291 (2010)
Lissauer, J., et al.: Nature. 470, 53 (2011)
Lodders, K., & Fegley B., Jr, Chemistry of low mass substellar objects, Springer (2006)
López-Morales, M., et al.: AJ. 152, 204 (2016)
Macintosh, B., et al.: Science. 350, 64 (2015)
Madhusudhan, N., Seager, S.: ApJ. 707, 24 (2009)
Maggio, A., et al.: ApJL. 811, L2 (2015)
Majeau, C., et al.: ApJ. 747, L20 (2012)
Mandell, A.M., et al.: ApJ. 728, 18 (2011)
Marty, B.: Sci. Lett. 313, 56 (2012)
Matter, A., Guillot, T., Morbidelli, A.: Planet. Space Sci. 57, 816 (2009)
Matthews, J.M., et al.: Nature. 430, 51 (2004)
Mayo, A.W., et al.: AJ. 155, 136 (2018)
McCullough, P.R., et al.: Publ. Astron. Soc. Pac. 117, 783 (2005)
McCullough, P., et al.: ApJ. 791, 55 (2014)
Micela, G., et al.: Exp. Astron. 40, 577 (2015)
Micela, G.: Exp. Astron. 40, 723 (2015)
Miguel, Y., et al.: ApJL. 742, L19 (2011)
Miguel, Y., et al.: MNRAS. 446, 345 (2015)
Miller-Ricci, E., Fortney, J.J.: ApJL. 716, L74 (2010)
Mollière, P., et al.: ApJ. 813, 47 (2015)
Morales, J.C., et al.: Exp. Astron. 40, 655 (2015)
Morbidelli, A., et al.: Annu. Rev. Earth Planet. Sci. 40, 251 (2012)
Morello, G., et al.: ApJ. 786, 22 (2013)
Morello, G., et al.: ApJ. 786, 22 (2014)
Morello, G., et al.: ApJ. 802, 117 (2015)
Morello, G.: ApJ. 808, 56 (2015)
Morello, G., et al.: ApJ. 820, 86 (2016)
Moses, J., et al.: ApJ. 737, 15 (2011)
Nutzman, P., Charbonneau, D.: PASP. 120, 317 (2008)
Oliva E. et al.: In: Moorwood A.F.M., Masanori, I. (eds.) Ground-Based Instrumentation for Astronomy. Proceedings of the SPIE, Volume 5492, pp. 1274–1279 (2004)
Palle, P.L., et al.: ApJ. 441, 952 (1995)
Parmentier, V., et al.: ApJ. 828, 22 (2016)
Pascale, E., et al.: Exp. Astron. 40, 601 (2015)
Pepe F. et al.: Proc. SPIE Vol. 4008. In: Iye, M., Moorwood, A.F. (eds.) Optical and IR Telescope Instrumentation and Detectors, p. 582–592 (2000)
Pepe F. et al.: Proc. SPIE 7735, id. 77350F (2010)
Perryman, M. A. C., et al., 797 14 (2014)
Pickles, A.J.: PASP. 110, 863 (1998)
Pillitteri, I. & Micela, G., ARIEL-INAF-SCI-TN-002 (2017)
Pollacco, D.L., et al.: PASP. 118, 1407 (2006)
Proceedings of "The CoRoT Mission Pre-Launch Status - Stellar Seismology and Planet Finding" (ESA SP-1306). In: Fridlund, M., Baglin, A., Lochard, J., Conroy, L. (eds.) ISBN 92-9092-465-9. (2006)
Puig L., et al., Exp. Astron. Submitted (2017)
Puig, L., et al.: Proc. SPIE. 99041W, 9904 (2016). https://doi.org/10.1117/12.2230964
Puig, L., et al.: Exp. Astron. 40, 393 (2015)
Queloz, D., et al.: A&A. 354, 99 (2000)
Quirrenbach A. et al.: Proc. SPIE 9908, id. 990812 14 pp. (2016)
Rackham, B., et al.: ApJ. 834, 151 (2017)
Rauer, H., et al.: Exp. Astron. 38, 249 (2014)
Rauscher, E., et al.: ApJ. 662, L115 (2007)
Raymond, S.N., et al.: Icarus. 183, 265 (2006)
Redfield, S., et al.: Astrophys. J. Lett. 673, L87 (2008)
Rein, H., arXiv:1211.7121 (2012)
Ricker, G.R., et al.: SPIE. 9143, 20 (2014)
Rocchetto, M., et al.: ApJ. 833, 120 (2016)
Rodgers, C. D.: Inverse Methods for Atmospheric Sounding: Theory and Practice. World Scientific Publishing Co. Pte. Ltd. ISBN #9789812813718, (2000)
Rowe, J., et al.: ApJ. 689, 1345 (2008)
Russell, H.N.: Popular Astronomy. 22, 275 (1914)
Samadi R. et al.: Astron. Astrophys. 559, id.A39 (2013a)
Samadi R. et al.: Astron. Astrophys. 559, id.A40 (2013b)
Sarkar, S., et al.: SPIE. 9904, 138 (2016)
Sarkar, S., et al., ARIEL-CRDF-PL-AN-001; ARIEL-CRDF-PL-TN-002 (2017)
Sarkar, S., et al., Stellar pulsation and granulation as noise sources in exoplanet transit spectroscopy in the ARIEL space mission, MNRAS, (2018)
Sartoretti, P., Schneider, J.: Astron. Astrophys. Suppl. 134, 553 (1999)
Sasaki, T., Barnes, J.W., O’Brien, D.P.: ApJ. 754, 51 (2012)
Scandariato, G., et al.: Exp. Astron. 40, 711 (2015)
Seager, S., Sasselov, D.D.: ApJ. 537, 916 (2000)
Sharp, C.M., Burrows, A.: ApJS. 168, 140 (2007)
Showman, A.P., Lewis, N., Fortney, J.: ApJ. 801, 95 (2015)
Sing, D.K., et al.: Nature. 529, 59 (2016)
Snellen, I.A.G., et al.: Nature. 465, 1049 (2010)
Snellen, I.A.G., et al.: Nature. 509, 63 (2014)
Solanki, S.K., Unruh, Y.C.: MNRAS. 348, 307 (2003)
Sozzetti, A., et al.: Exp. Astron. 40, 595 (2015)
Stevenson, K.B., et al.: Science. 346, 838 (2014)
Sullivan, P.W., et al.: ApJ. 809, 77 (2015a)
Sullivan, P.W., et al.: ApJ. 809, 77 (2015b)
Swain, M.R., et al.: Nature. 463, 637 (2010)
Swain, M.R., Vasisht, G., Tinetti, G.: Nature. 452, 329 (2008)
Swain, M.R., et al.: ApJ. 690, L114 (2009)
Taylor, F. W. et al.: ed. F. Bagenal, T. E. Dowling, & W. McKinnon (Cambridge: Cambridge Univ. Press), Chapter 4 (2004)
Tennyson, J., Yurchenko, S.N.: MNRAS. 425, 21 (2012)
Tennyson, J., et al.: J. Mol. Spectrosc. 372, 73 (2016)
Thorngren, D.P., et al.: ApJ. 831, 64 (2016)
Tinetti, G., et al.: Proc. SPIE. 9904, 99041X (2016). https://doi.org/10.1117/12.2232370
Tinetti, G., Encrenaz, E., Coustenis, A.: Astron. Astrophys. Rev. 21, 63 (2013)
Tinetti, G., Deroo, P., Swain, M., et al.: ApJ. 712, L139 (2010)
Tinetti, G., et al.: Nature. 448, 169 (2007)
Tinney, C.G., et al.: ApJ. 551, 507 (2001)
Todorov, K.O., et al.: ApJ. 796, 100 (2014)
Tofflemire, J.W., et al.: AJ. 143, 12 (2012)
Triaud, A., et al.: MNRAS. 444, 711 (2014)
Tsiganis, K., et al.: Nature. 435, 459 (2005)
Tsiaras, A., et al.: ApJ. 820, 99 (2016)
Tsiaras, A., et al.: AJ. 155, 156 (2018)
Turrini, D., et al.: Exp. Astron. (2018). https://doi.org/10.1007/s10686-017-9570-1
Turrini, D., et al.: Exp. Astron. 40, 501 (2015)
Turrini, D., Svetsov, V.: Life. 4, 4 (2014). https://doi.org/10.3390/life4010004
Valencia, D., et al.: Icarus. 181, 545 (2006)
Valencia, D., et al.: ApJ. 665, 1413 (2007)
Valencia, D., et al.: ApJ. 775, 10 (2013)
Vanderburg, A.: et al. Nature. 526, 546–549 (2015)
Varley, R., et al.: Exp. Astron. 40, 621 (2015)
Vazan, A., et al.: ApJ. 829, 118 (2016)
Venot, O., et al.: A&A. 546, A43 (2012)
Venot, O., et al.: A&A. 577, A33 (2015)
Venot, O., et al.: ApJ. 830, 77 (2016)
Venot, O., et al., Exp. Astron. (2018), accepted.
Venturini, J., et al.: A&A. 596, 90 (2016)
Vidal-Madjiar, A., et al.: Nature. 422, 143 (2003)
Wakelam, V., et al.: ApJS. 217, 20 (2015)
Wakelam, V., et al.: ApJS. 199, 21 (2012)
Waldmann, I.P.: ApJ. 747, 12 (2012)
Waldmann, I.P., et al.: ApJ. 744, 35 (2012)
Waldmann, I.P., et al.: ApJ. 766, 7 (2013)
Waldmann, I.P.: ApJ. 780, 23 (2014)
Waldmann, I.P., Pascale, E.: Exp. Astron. 40, 639 (2015)
Waldmann, I.P., et al.: ApJ. 802, 107 (2015a)
Waldmann, I.P., et al.: ApJ. 813, 13 (2015b)
Weidenschilling, S.J., et al.: Nature. 384, 619 (1996)
Williams, D.M., Pollard, D.: Int. J Astrobiol. 1, 61–69 (2002)
Wheatley, P., et al., MNRAS submitted (2017), arXiv:1710.11100
Wordsworth, R.D., et al.: A&A. 522, A22 (2010)
Yurchenko, S.N., et al.: Proc. Natl. Acad. Sci. 111, 9379 (2014)
Zellem, R.T., et al.: ApJ. 844, 27 (2017)
Zingales, T., et al.: Exp. Astron. (2018). https://doi.org/10.1007/s10686-018-9572-7
Zurlo, A., et al.: A&A. 587, A57 (2016)
Acknowledgments
The payload consortium would like to thank the national agencies for their support during the assessment study.
Many co-authors of this paper were supported by European Research Council grants (programs AEROSOL, E3ARTHS, ExoAI, ExoLights, ExoMol, MoltenEarths, SPECULOOS, WHIPLASH), H2020-COMPET-2017 (ExoplANETS A) and ANR (e-PYTHEAS) UKSA grant ST/S002634/1.
We would like to thank the ESA CDF team, as well as TEC and SRE directorate colleagues and industrial teams led by Airbus Defense and Space – France and TAS – France who provided support during the course of the study.
Author information
Authors and Affiliations
Corresponding author
Appendix
Appendix

Rights and permissions
Open Access This article is distributed under the terms of the Creative Commons Attribution 4.0 International License (http://creativecommons.org/licenses/by/4.0/), which permits unrestricted use, distribution, and reproduction in any medium, provided you give appropriate credit to the original author(s) and the source, provide a link to the Creative Commons license, and indicate if changes were made.
About this article

Cite this article
Tinetti, G., Drossart, P., Eccleston, P. et al. A chemical survey of exoplanets with ARIEL. Exp Astron 46, 135–209 (2018). https://doi.org/10.1007/s10686-018-9598-x
Received:
Accepted:
Published:
Issue Date:
DOI: https://doi.org/10.1007/s10686-018-9598-x